Daily Market Analysis
Market Focus
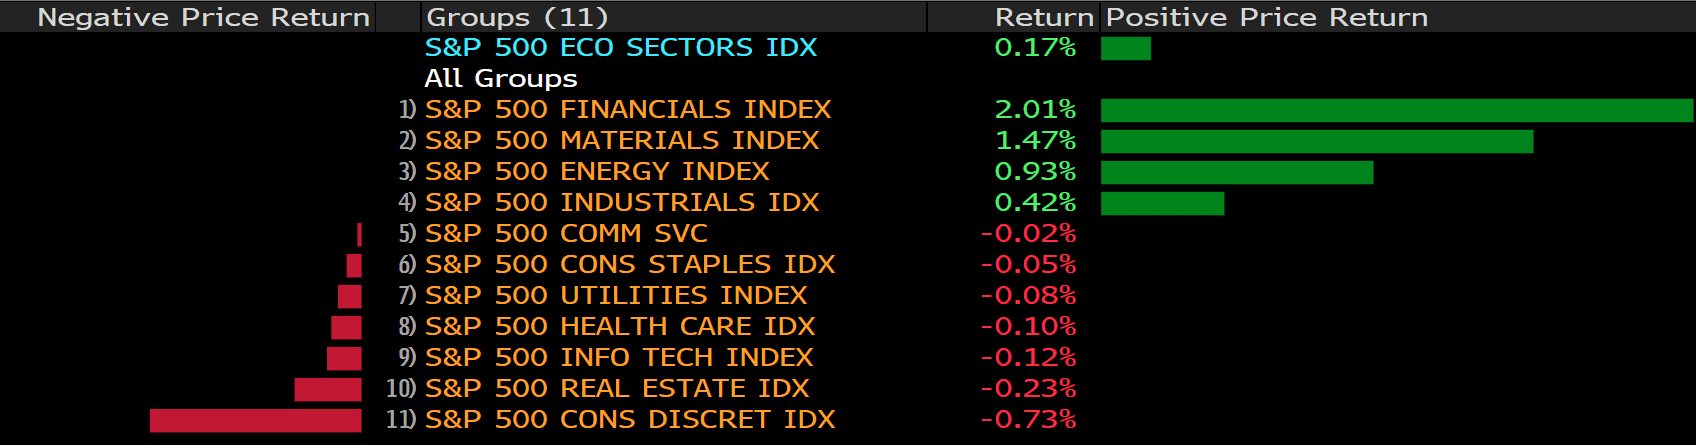
Slumping technology stocks stood in contrast to a broader gain in U.S. equities, exposing the lingering concerns about the ability of the economy to weather less stimulus and rising Covid outbreaks. While the S&P 500 and Dow Jones climbed to another all-time high, the tech-heavy Nasdaq declined along with Amazon.com Inc. Micron Technology Inc. led a decline in chip stocks, which slid for a fourth session. Energy shares rallied with oil. In Europe, the Stoxx 600 Index climbed for a seventh day.

The Senate passed a $550 billion infrastructure plan that would represent the biggest burst of spending on U.S. public works in decades, sending the legislation to the House where its fate is in the hands of the fractious Democratic caucus.
The bipartisan 69-30 vote Tuesday marked a significant victory for President Joe Biden’s economic agenda. It was a breakthrough that has eluded Congress and presidents for years, despite both parties calling infrastructure a priority and an issue ripe for compromise. Nineteen Republicans, including Minority Leader Mitch McConnell, joined with all 50 senators who caucus with Democrats to support the bill.
However, the bill still faces hurdles in the House, which is scheduled to be on break until Sept. 20. House Speaker Nancy Pelosi, under pressure from progressives who want their priorities addressed, has said she will not allow a vote on the bipartisan package until the Senate has passed the broader economic plan. Moderates, meanwhile, are clamoring for the House to take up the bill sooner than that.
Main Pairs Movement:

The greenback surged against European and safe-haven rivals but edged marginally lower against commodity-linked currencies, which were underpinned by the solid performance of crude oil and energy stocks.
The euro pair fell for a seventh consecutive day, heading toward the yearly low at around 1.1700. Cable settled around 1.3840, while Aussie added some 20 pips, and Lonnie hovered within the 1.2520 price zone. NZD/USD has been back to the 0.7000 level on Tuesday. USD/JPY extended its advance and trades at its highest in almost a month around 110.60.
Gold remained depressed, ending the day at $1,730 a troy ounce. Crude oil prices recovered some ground, with WTI ending the day at $68.50 a barrel, and Brent at $70.85. US Treasury Bond Yields continues their rising streak, with the 10-year yield closing the day at 1.3560.
Cryptocurrencies seesawed around the familiar price level amid the ongoing infrastructure bill negotiation which could impose tax requirements on digital assets. Though both Bitcoin and Ethereum ended the day red against the US dollar, their losses were within 2%.
Technical Analysis:
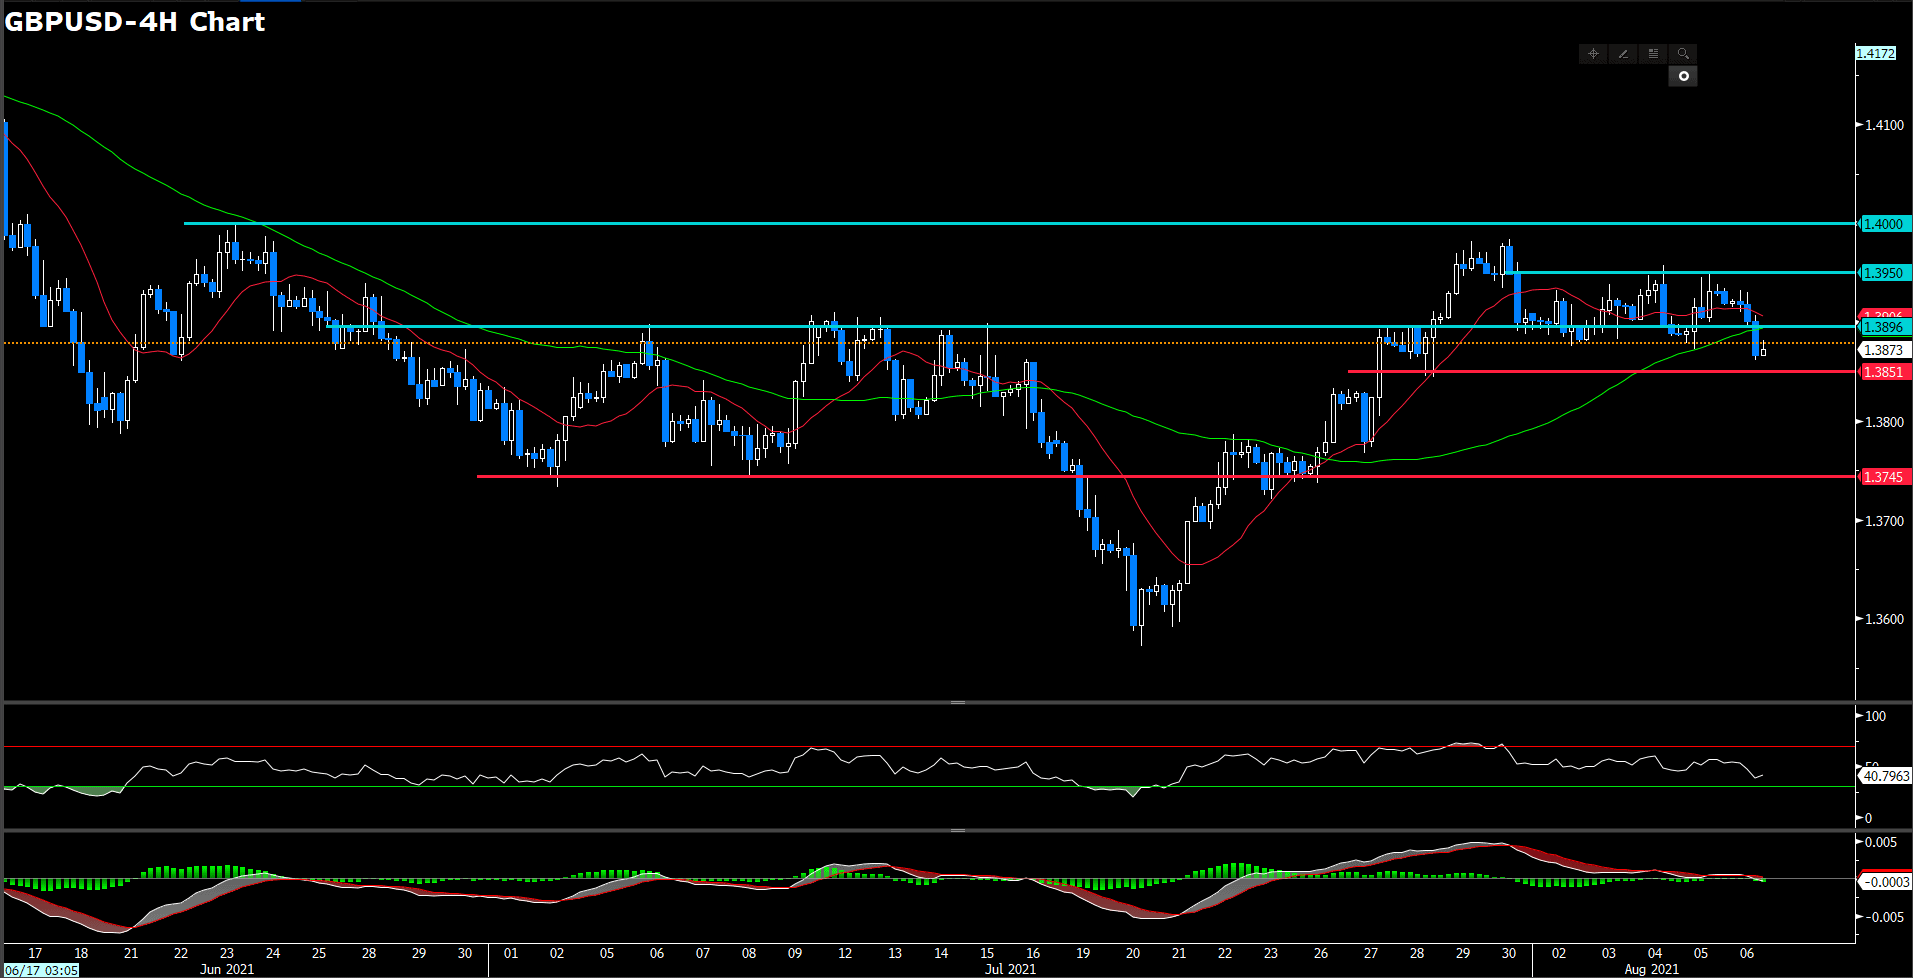
GBPUSD (4-hour Chart)

Pound trade near a daily low of 1.3827 with mounting pressure amid persistent dollar’s strength after spending most of the day hovering around the 1.385 level. The pair has declined with consecutive 4 days. At the same time, dollar remaining in the top spot on hawkish Fed and anticipantion of tapering. On the other hands, net GBP position perspective, last week net shorts dropped sharply in a follow-through from month end squaring. For technical aspect, RSI indicator printed 41 figures, suggesting bearish momentun ahead. For moving average side, 15 long SMA indicator remaining downside movement and 60 long SMA seems to change it upward movement to sideway.
In lights of aforementional, we still expect this pair will continue slightly move to sideway. If price fall ahead, the first immediately support level will eyes on 1.385 level in short term and 1.38 level follow. However, the imminet U.S. CPI data might give dollar rival currencies a whispaw. If price could go over the last highs spot which around 1.395, it will heading to over 1.4 level.
Resistance: 1.3896, 1.395, 1.4
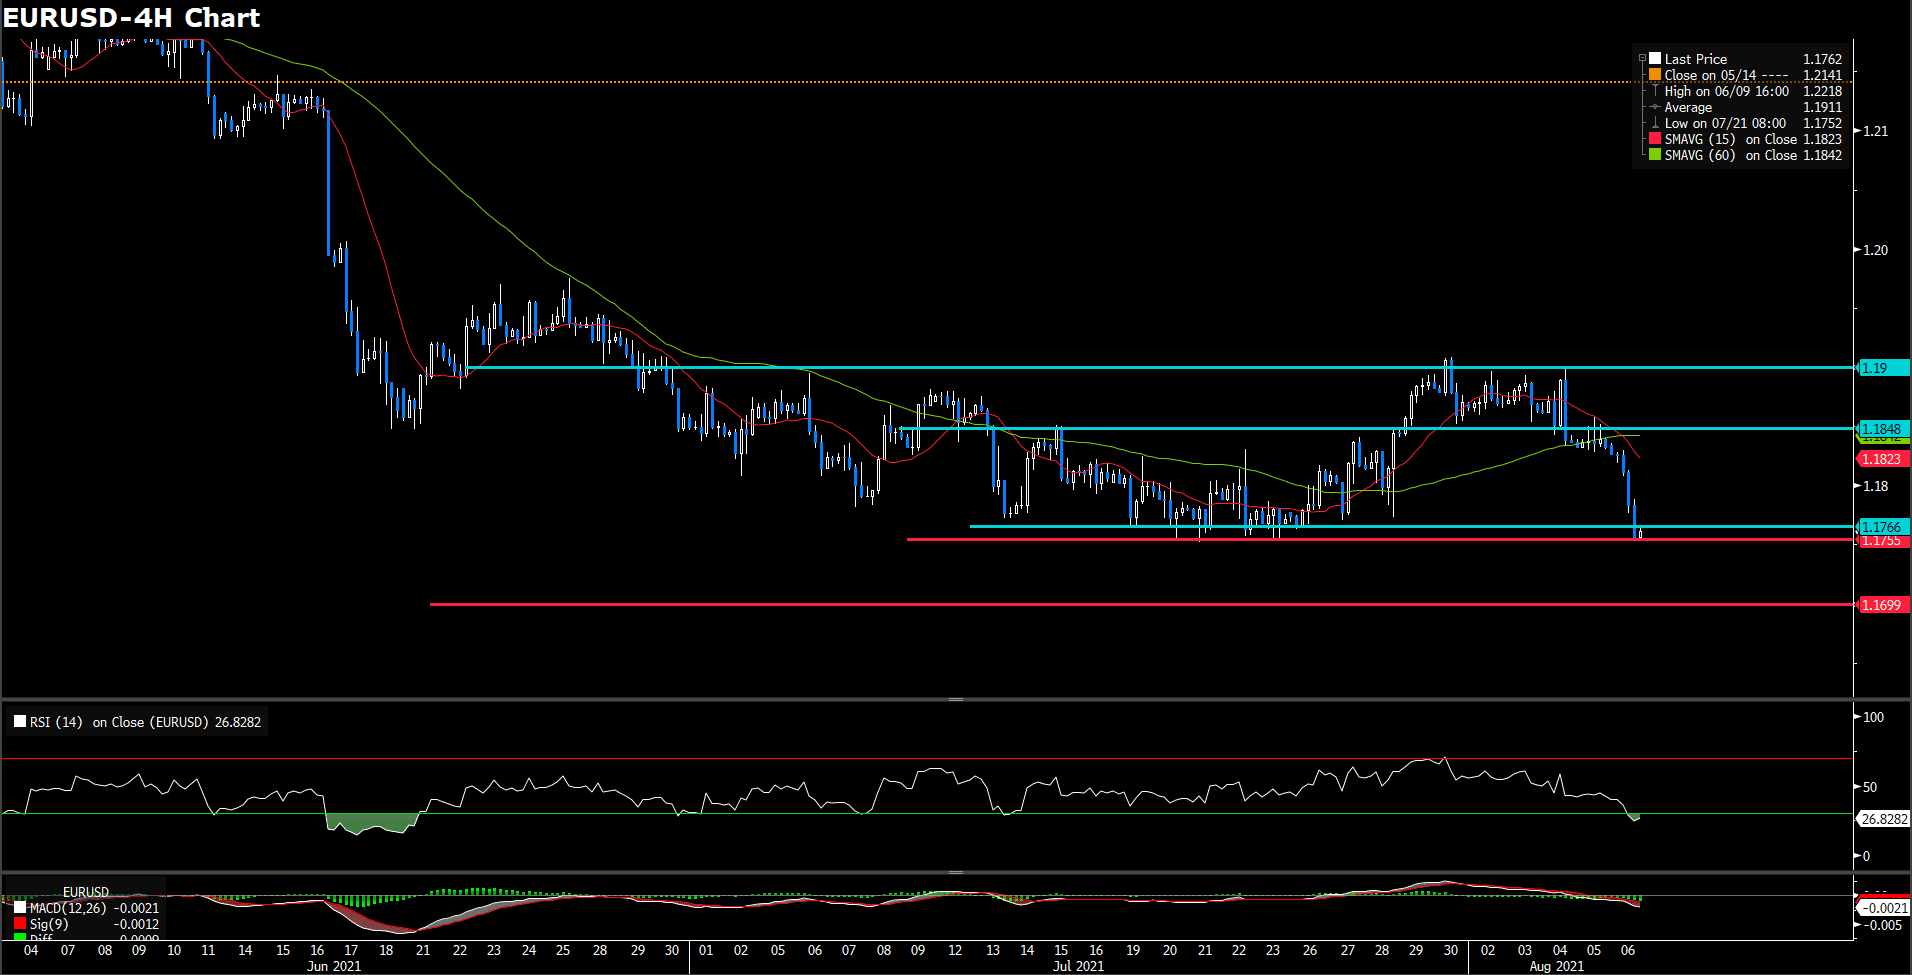
EURUSD (4- Hour Chart)

EUR/USD pair is stucking 1.172 around as solid greenback demand persists while the shared currency gives up to tepid German data. Investors welcome U.S. news on infrastructure investment, eyes on U.S. inflation data. The pair seems to have gone into a consolidation phase and was last seen losing 0.14% in daily market at 1.17190 as of writing. From the technical perspective, RSI indicator still immerse in over sought territory, suggesting oevrly incling on bearish momentum. For moving average side, 15 long SMA indicator retaining downward slope and 60 long SMA completely head it way to negative side.
As our mention previously, we expected if price drop below 1.1755, market momentum would drag it to lower lows that eyes on 1.17. Therefore, we forecast 1.17 will be the last support level, especially for bid buyer. On contrast, if price could stand above 1.1755, price will choppy between 1.1755 and 1.18.
Resistance: 1.1755, 1.18, 1.185
Support: 1.17
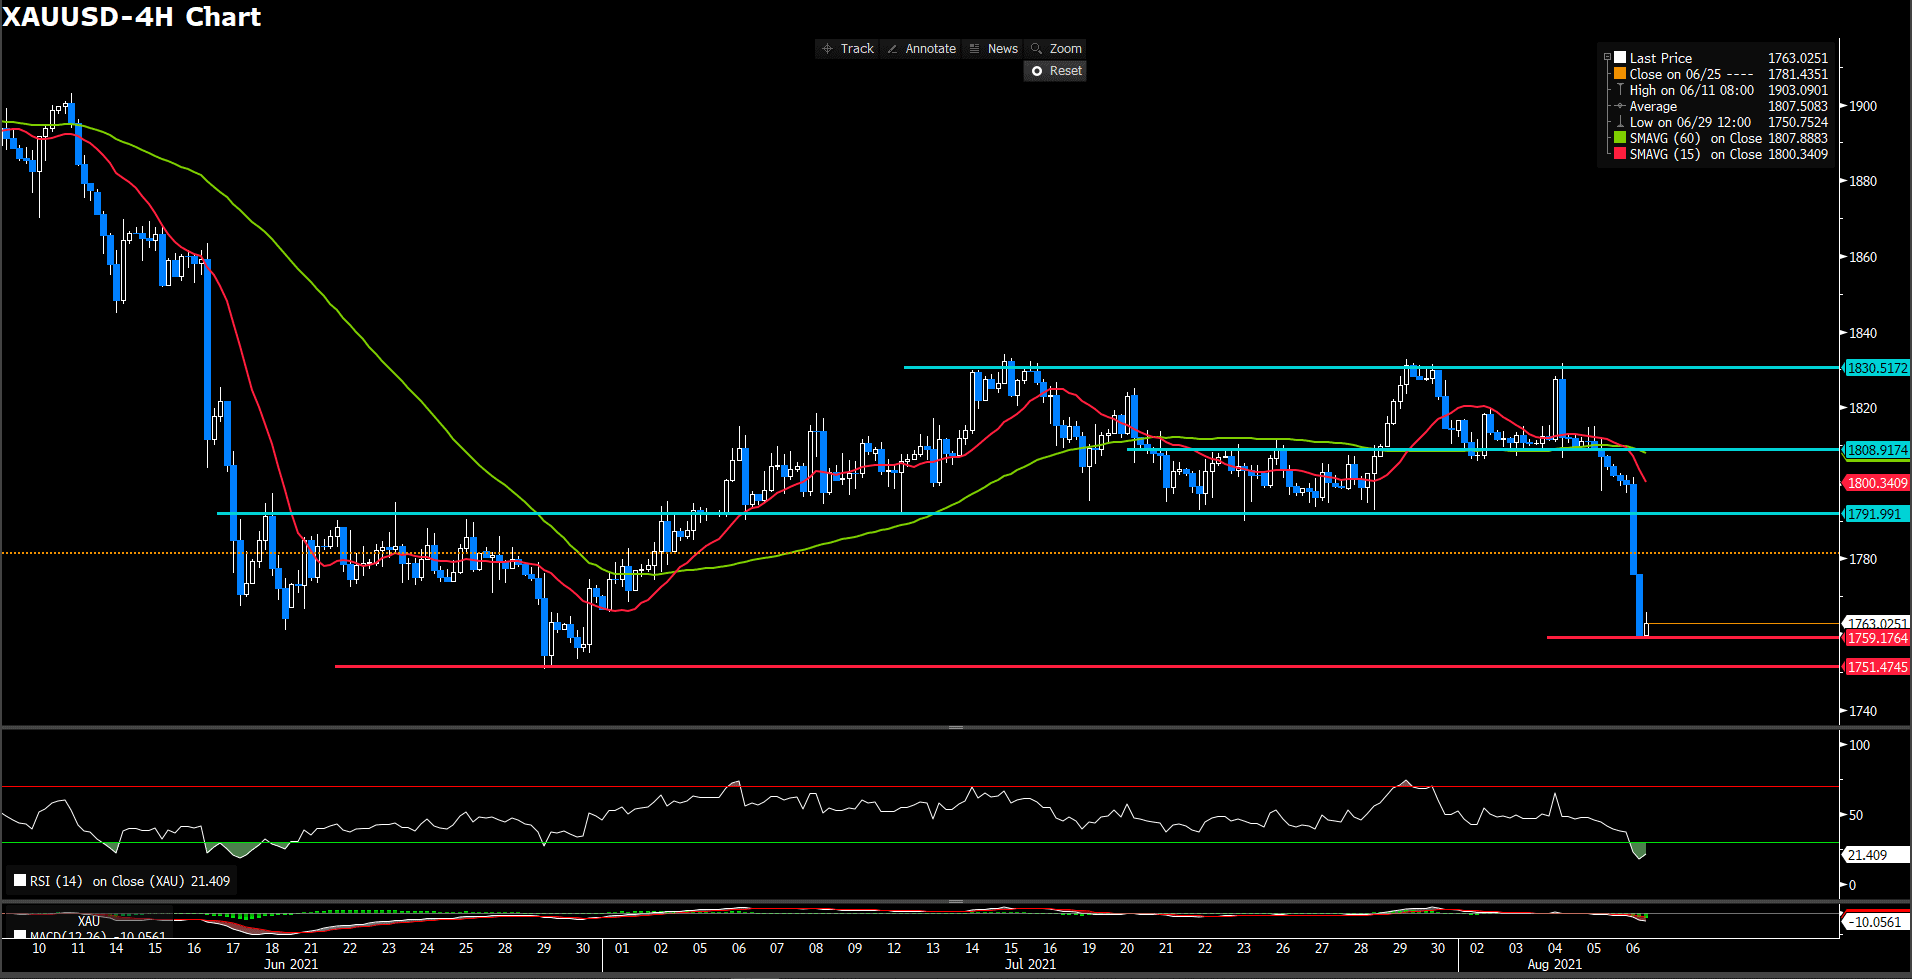
XAUUSD (4- Hour Chart)

The Japan yen advanced to an almost one-month high of 11.058, trading nearby as the day comes to an end. The greenback retained its strength while New York session, the latter fueled by news indicating a fresh financial injection in the U.S., coming from the government. At the same time, 10 years U.S. treasuries yields has rallied to 1.35%, printed the record high in nearly two-week, that just gain 20% advanced from last bottom. For technical side, RSI indicator record 71.6 figures as of writing, suggesting over bought sentiment for yen market. For moving average perspective, both 15 and 60 long SMAs indicator are retaining downwind movement.
For the price action, the strong resistance has built by last couple high point which around neckline of bottom pattern at 110.66. Meanwhile, relative strong indicator aslo shows the overly sentiment that might forestall the bid side momentum or fuel the take profit action. On contrast, we expect 110.11 will be the first support level yet is short of price cluster, and 109.7 following
Resistance: 110.665
Support: 110.11, 109.7, 109.36
Economic Data
|
Currency |
Data |
Time (GMT + 8) |
Forecast |
||||
|
USD |
Core CPI (MoM)(Jul) |
20:30 |
0.4% |
||||
|
OIL |
Crude Oil Inventories |
22:30 |
-1.271 M |
||||