Daily Market Analysis
Market Focus
Stocks rose to record levels on the heels of a key labor market report, which reflected a stronger-than-expected rebound in employment last month and a marked drop in the jobless rate. S&P 500 extended its record-setting gains from a day earlier. Dow Jones added more than 100 points, or 0.4%, and also set a record high. The Nasdaq dipped as Treasury yields gained across the curve after the better-than-expected print on the labor market’s recovery.
A slow-going Senate debate over a broad $550 billion infrastructure package spilled into Sunday and could go on for days yet, with lawmakers unable to agree on which final changes to consider.
Amendments still on the table include proposals for new cryptocurrency rules and flexibility for states and localities that choose to use some unspent pandemic relief funds for roads and bridges.
Senator Bill Cassidy, a Louisiana Republican who helped negotiate the bipartisan proposal, said he expects the package of money for roads, water systems and broadband expansion will eventually pass, but suggested that may be two days away unless all 100 senators can agree to speed things up.
Majority Leader Chuck Schumer opened the Sunday session saying Democrats were ready to consider amendments to the legislation, which is a cornerstone of President Joe Biden’s agenda. “That will require the cooperation of our Republican colleagues,” he said. “In any case, we’ll keep proceeding until we get this bill done.”

Main Pairs Movement:
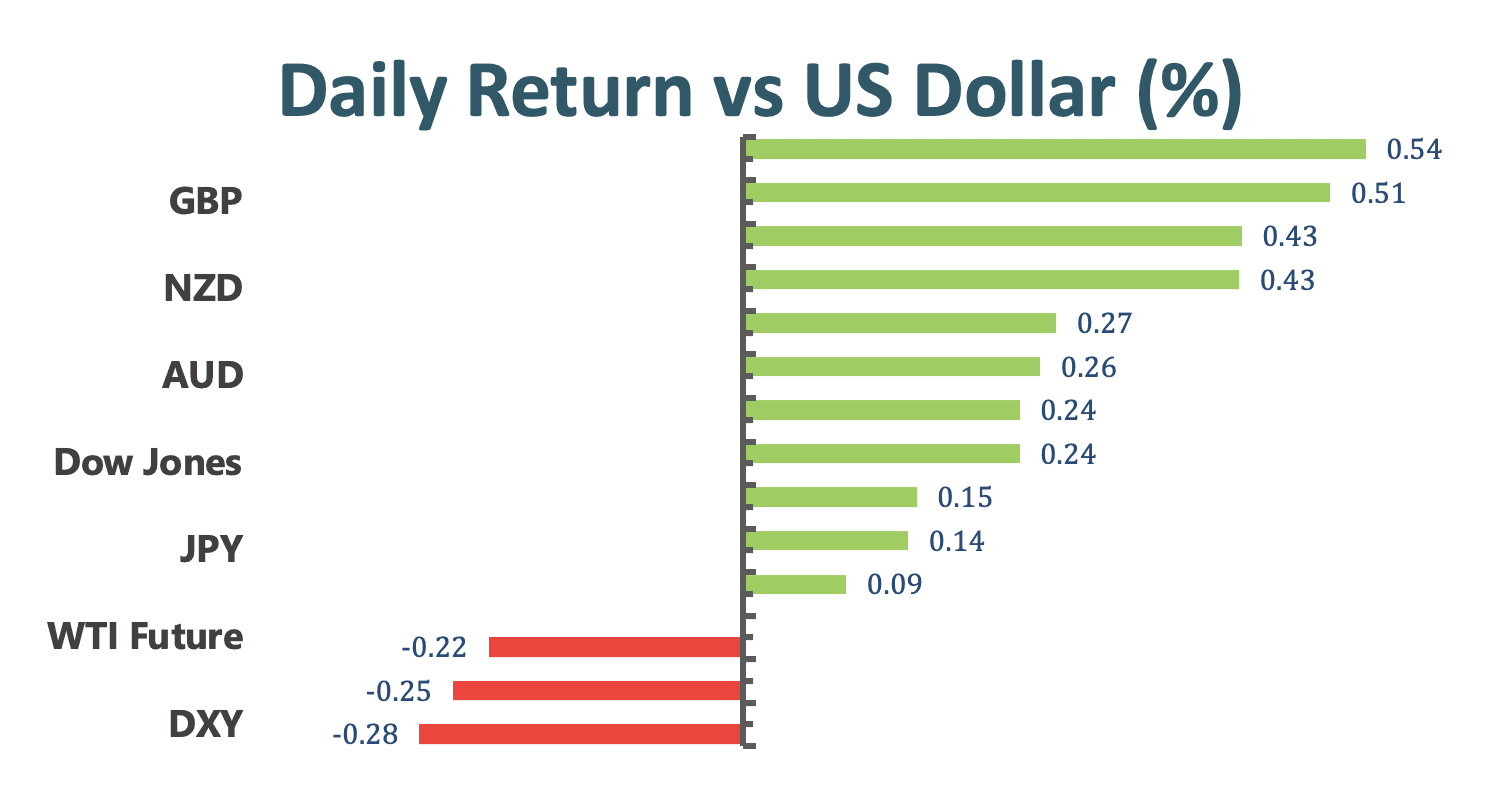
The dollar soared at the end of the week, closing green against most major rivals, right after an upbeat US Nonfarm Payroll report. The US added 943K new jobs in July, while the unemployment rate contracted to 5.4%, both largely beating the market’s expectations. The better-than-expected labor market results revived speculation that the Fed will have to tighten its monetary policy sooner than anticipated.
The eruo pair trades around 1.1760, and Cable settles at 1.3870. Commodity-linked currencies lost ground against their American peer. Loonie surged near 0.5% to the 1.25500 level, Ausssie plummeted to 0.7350, approaching its 2021 low, and NZD/USD hovers around 0.7000, struggling to defend the major support level.
Gold price collapsed, with the yellow metal losing roughly $35, closing the week at $1763 a troy ounce. Crude oil prices were also under selling pressure, with WTI ending the day at $68.00 a barrel, and Brent at $70.30. The yield on 10-year US Treasury note surged to 1.3000, amid the overall market optimism.
Technical Analysis:
GBPUSD (4-hour Chart)
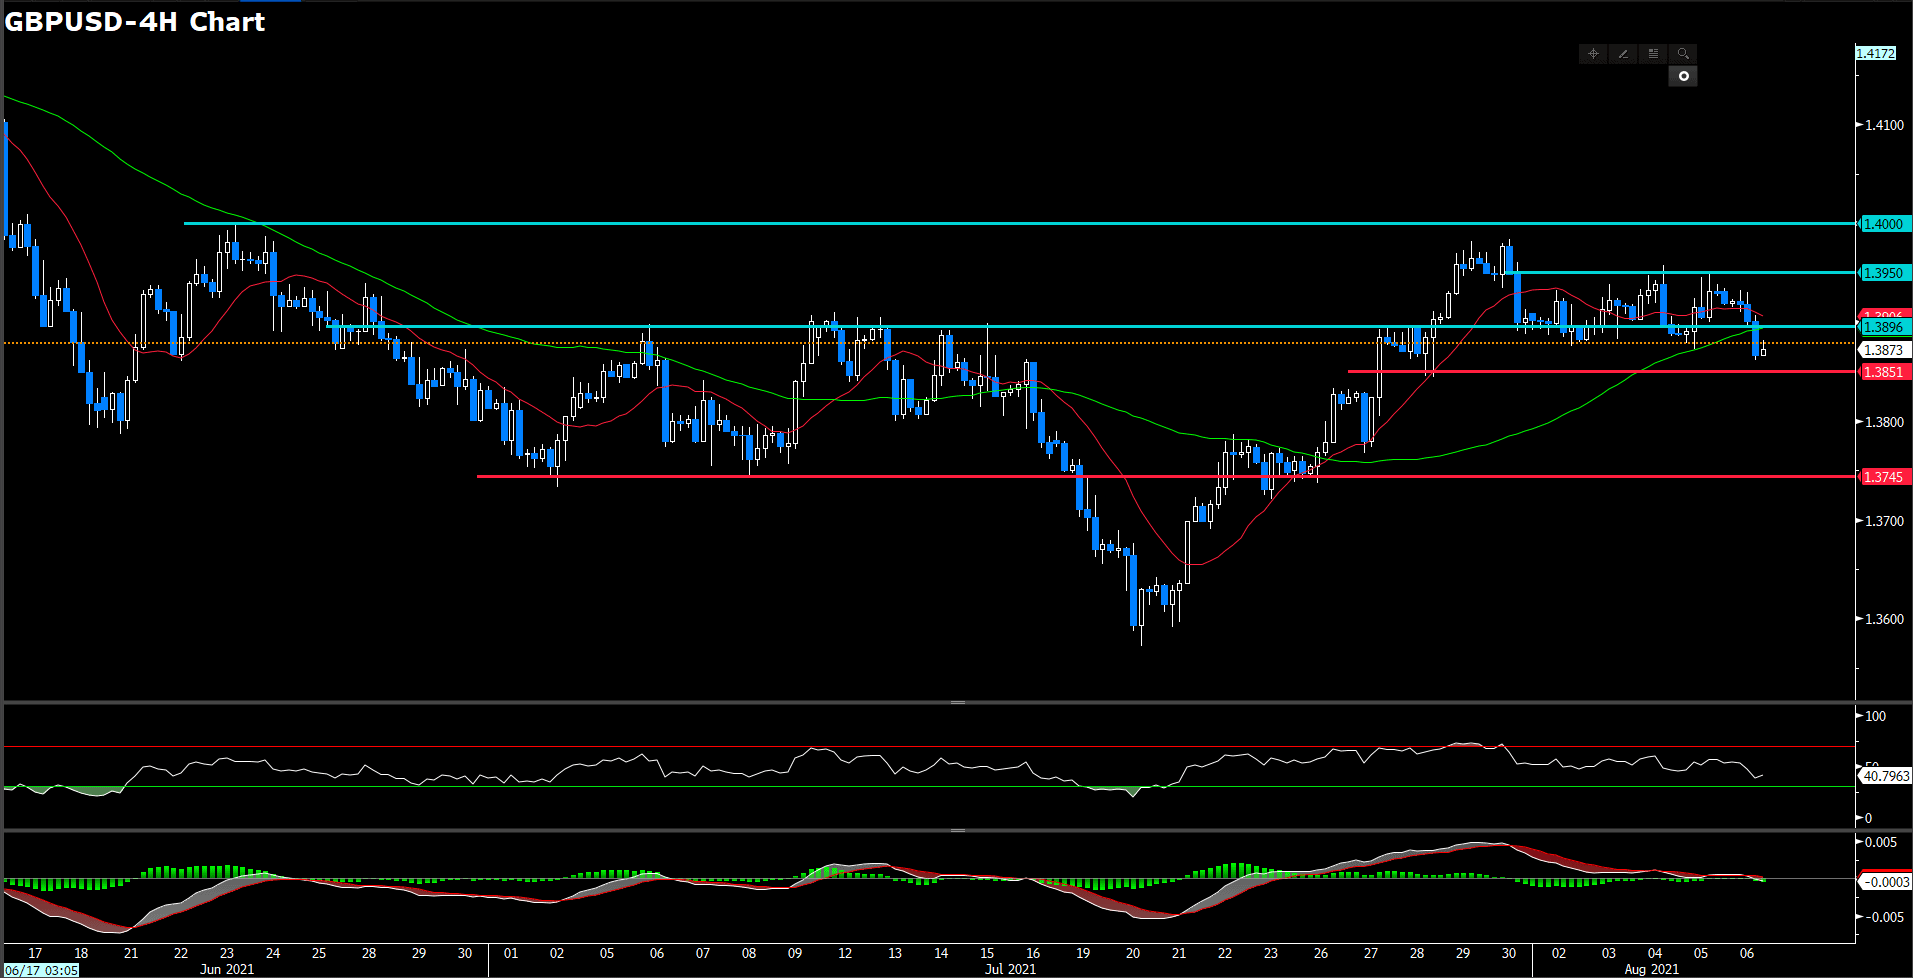
Pound has declined under 1.39 after the U.S. reported an increase of 943k jobs, beating expectations and raising outlook for tighter monetary policy by Fed, set 1.38785 as of writing. At the same time, macroeconomic data trigger sell-off in U.S. treasuries. For technical aspect, RSI indicator pull up from slightly-bearish condition to set at 41 figures, suggesting slightly bearish movement ahead. For moving average side, 15 long SMA indicator slightly heading to negative territory and 60 long SMA indicator remaining upway traction.
All in all, we believe this pair still lacking of a direction as it miring in a tiny horizontal channel which choppy nearly a week. If price fall ahead, market will eye on 1.385 level in short term and 1.38 level follow. On upway, if price could go over the last highs spot which around 1.395, it will heading to over 1.4 level.
Resistance: 1.3896, 1.3985, 1.4
Support: 1.3665, 1.3745, 1.38, 1.385
EURUSD (4- Hour Chart)
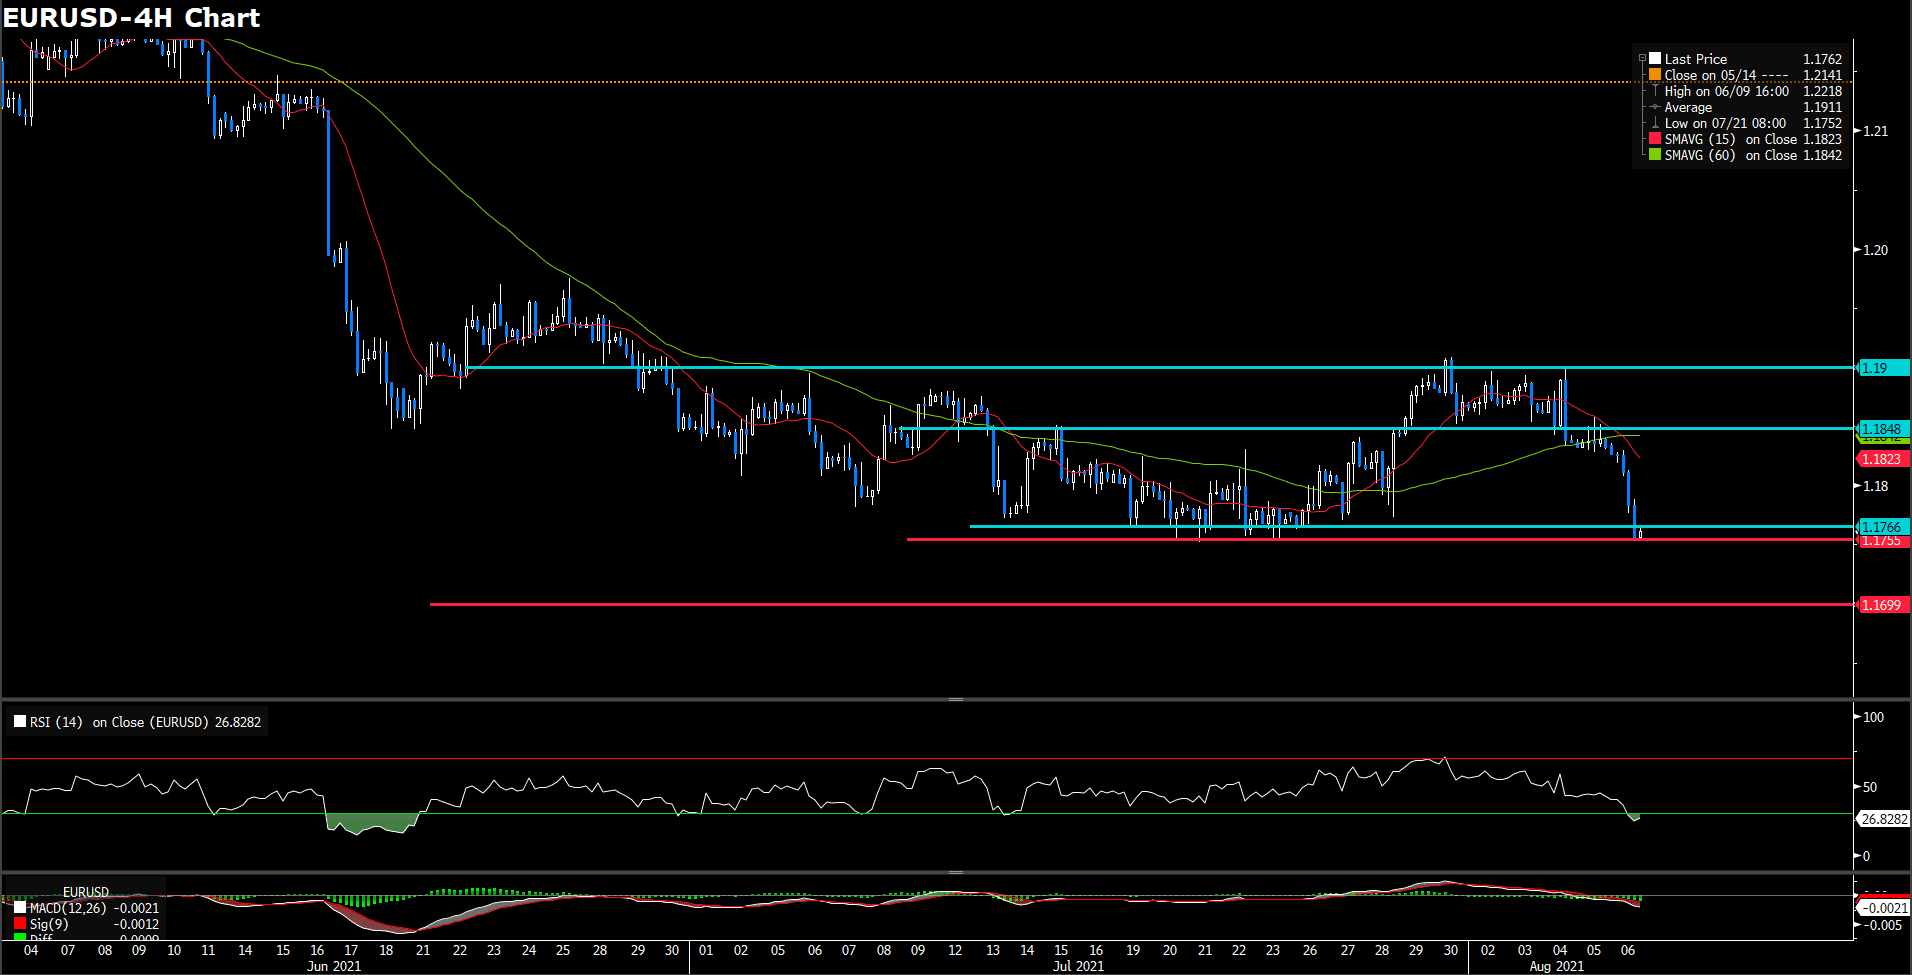
The euro dollar pair dropped further and hit the nearly 4-month bottomed at 1.1754 then pull up side way close to the end of the day, holding on 1.176 with 0.61 losses as of writing. The slide is being driven by a rally of the greenback across the G-10 currencies as the outerperformance on labor market data. From the technical perspective, RSI indicator has drop to 27 figures as of writing, suggesting over sought sentiment for a short term. For moving average side, 15 long SMA indicator retaining downward slope and 60 long SMA remaining flat. Moreover, 15 and 60 long SMAs indicator has death cross in the daily market.
In the lights of indicator shows, euro dollar has drop badly in short term with market momentum. however, price action give euor dollar a solid support level at 1.1755 which it rebounded after once touched. At current stage, we expect 1.1755 will be the strong short term support in terms of momentum. If price successive down, then price will see at lower lows and next support will be 1.17.
Resistance: 1.1766, 1.18, 1.1848, 1.19
Support: 1.1755, 1.17
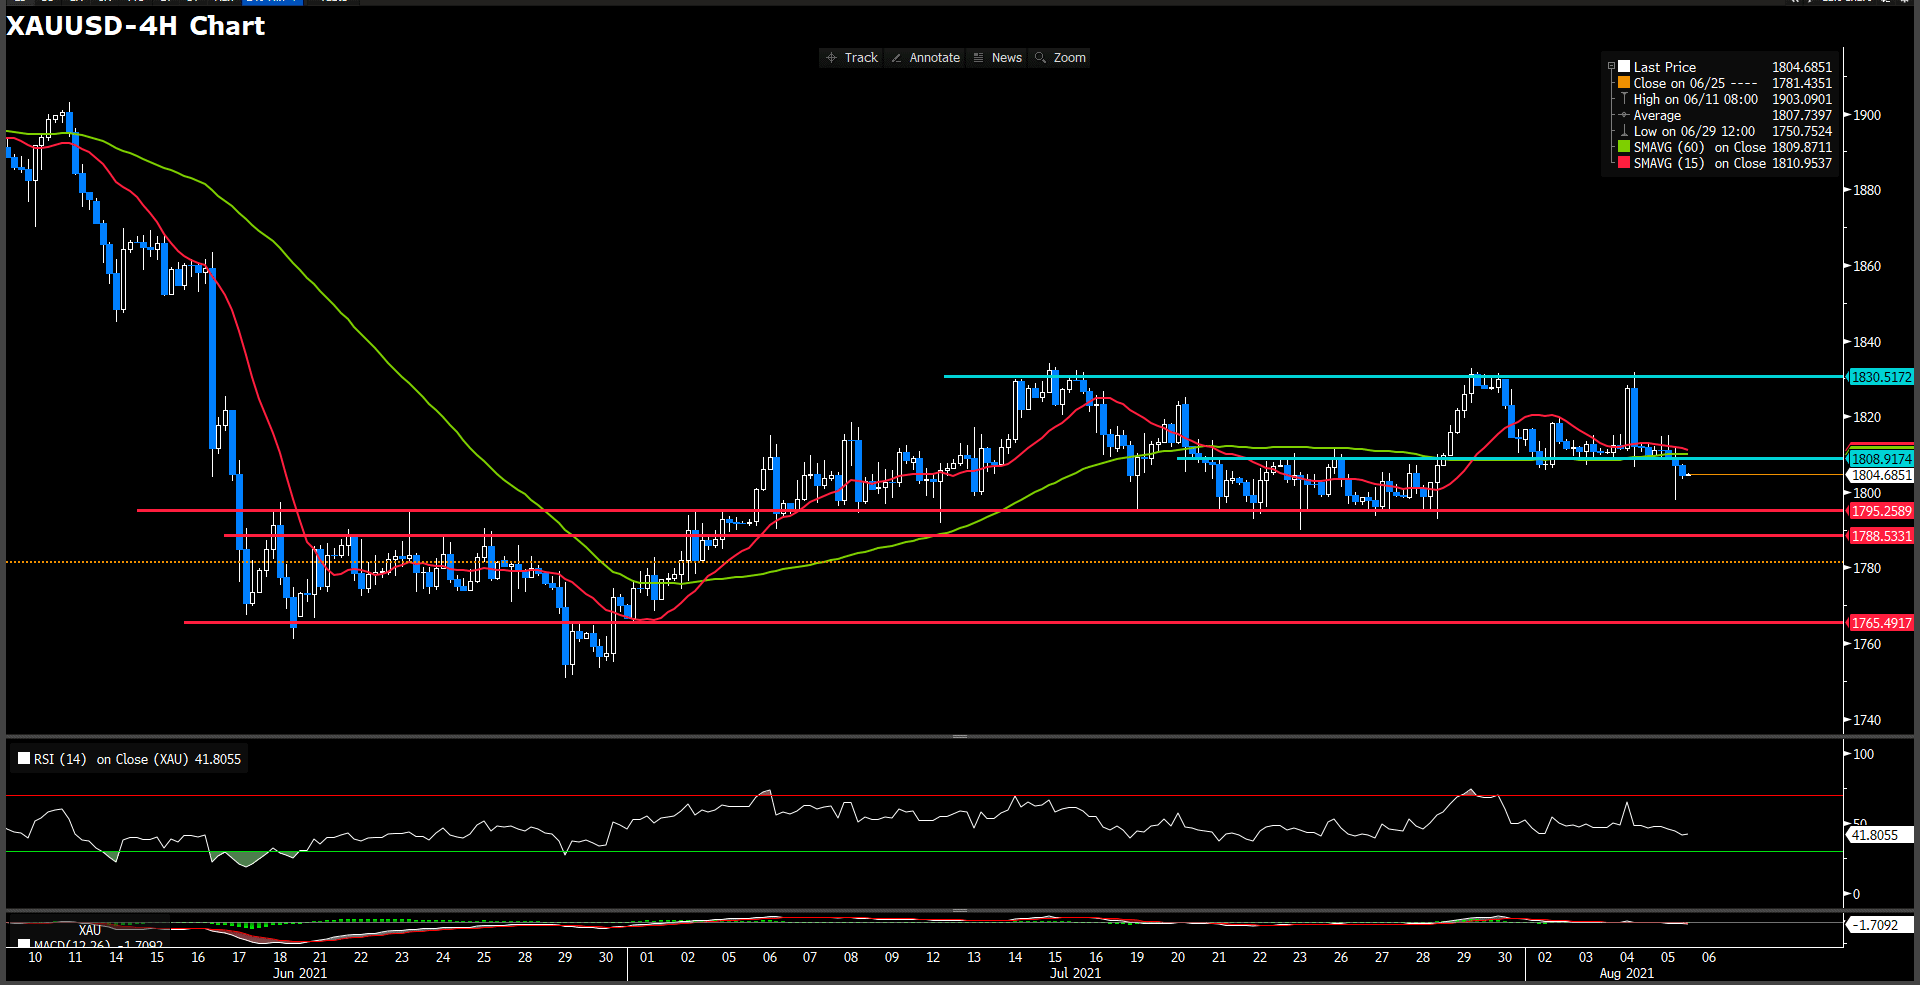
XAUUSD (4- Hour Chart)
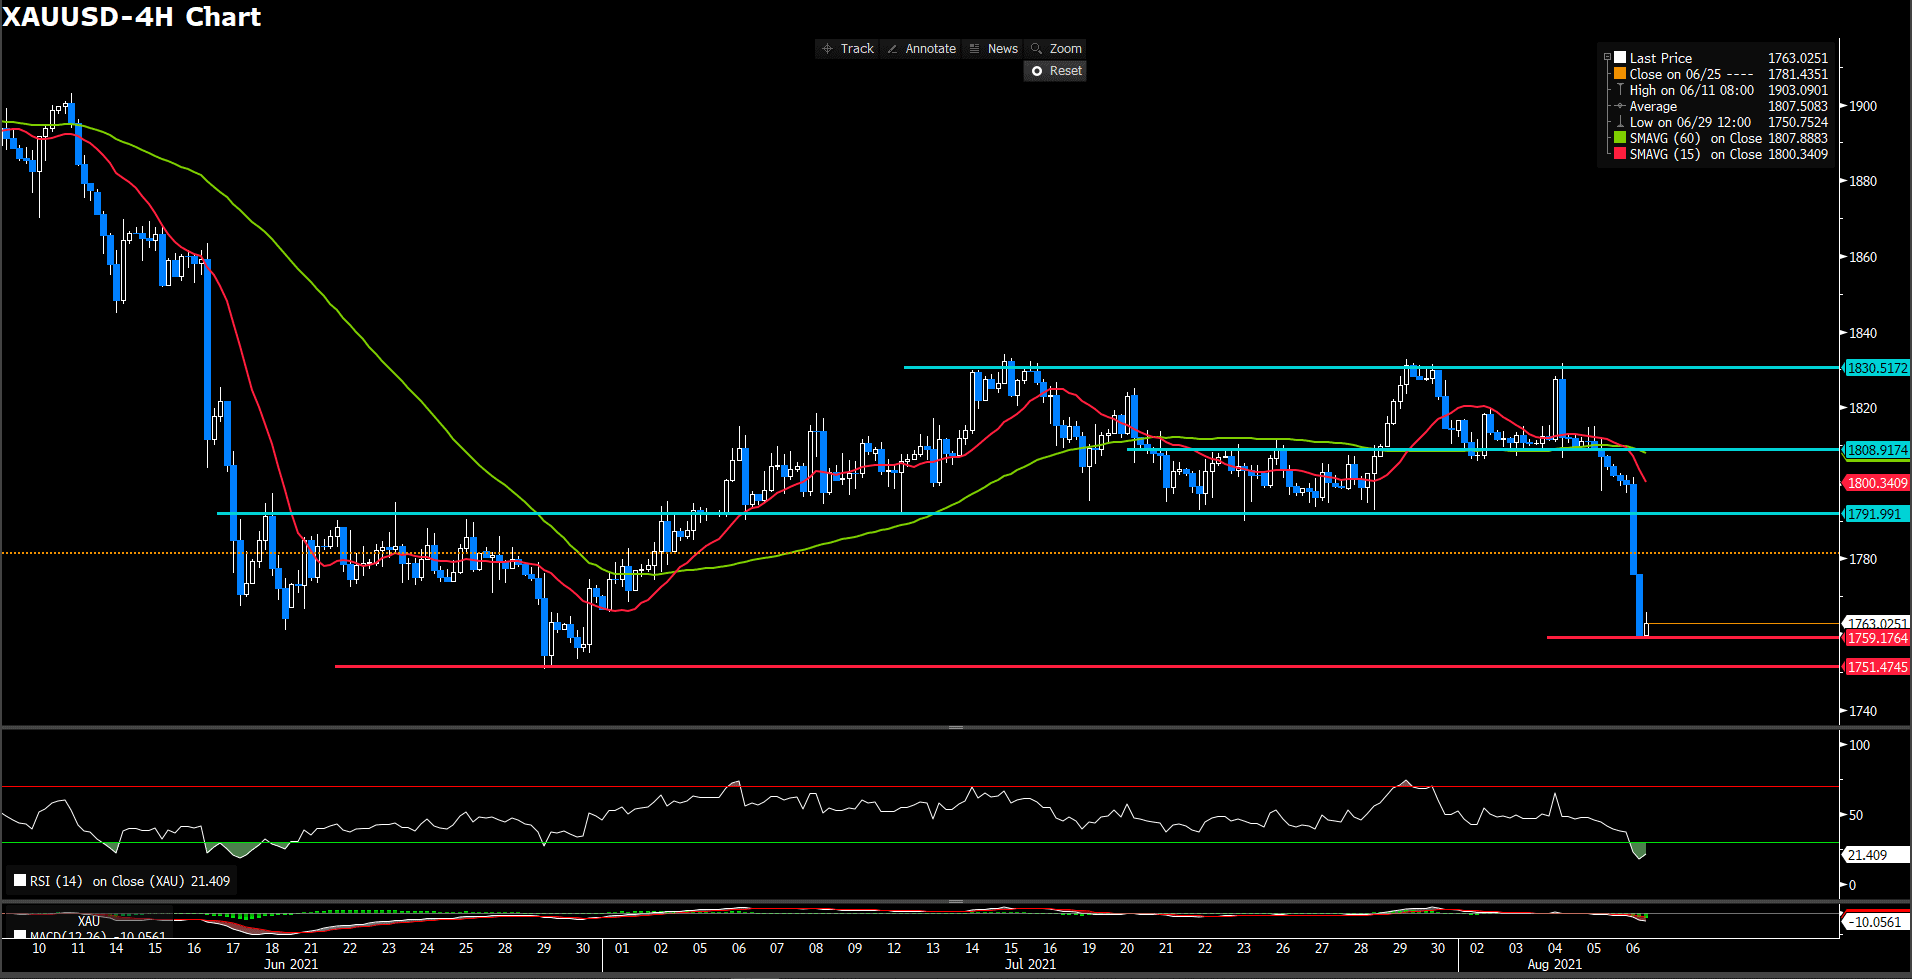
Gold price came under strong bearish pressure in U.S. session after latest NFP data beat the expectation in July, price linger $1762 as of writing once it hit rock-bottom at 1759. The DXY index edged up 0.6%, having the best day in weeks and trading at 2-week highs. Meanwhile, stocks are holding in positive position across U.S. market despite NAS100 was pared by 10 years U.S. treasuries yield bullish traction, recording 5.3% gains to 1.29% level. For technical side, RSI indicator slightly declined to 21 figure as of writing, suggesting over sought sentiment in short term. For moving average perspective, both 15 and 60 long SMAs indicator are turning to south side, two indicator has death cross.
For the market sentiment, we see indicator shows market is overly incling to selling moementum which fueled by market data. On the other hands, extremely dynamic movement impact the perspective of moving average. Therefore, we expect market will possibly rebound according to indicator suggestion. however, if momentum continue toward to downside, the next critical support will eye on 1751.5.
Resistance: 1792, 1809, 1830.5
Support: 1759.2, 1751.5
Economic Data
|
Currency |
Data |
Time (GMT + 8) |
Forecast |
|
USD |
JOLTS Job Opening (Jun) |
22:00 |
9.388 M |