Daily Market Analysis
Market Focus
Stocks climbed as dip buyers resurfaced at the end of a week marked by a surge in global volatility.
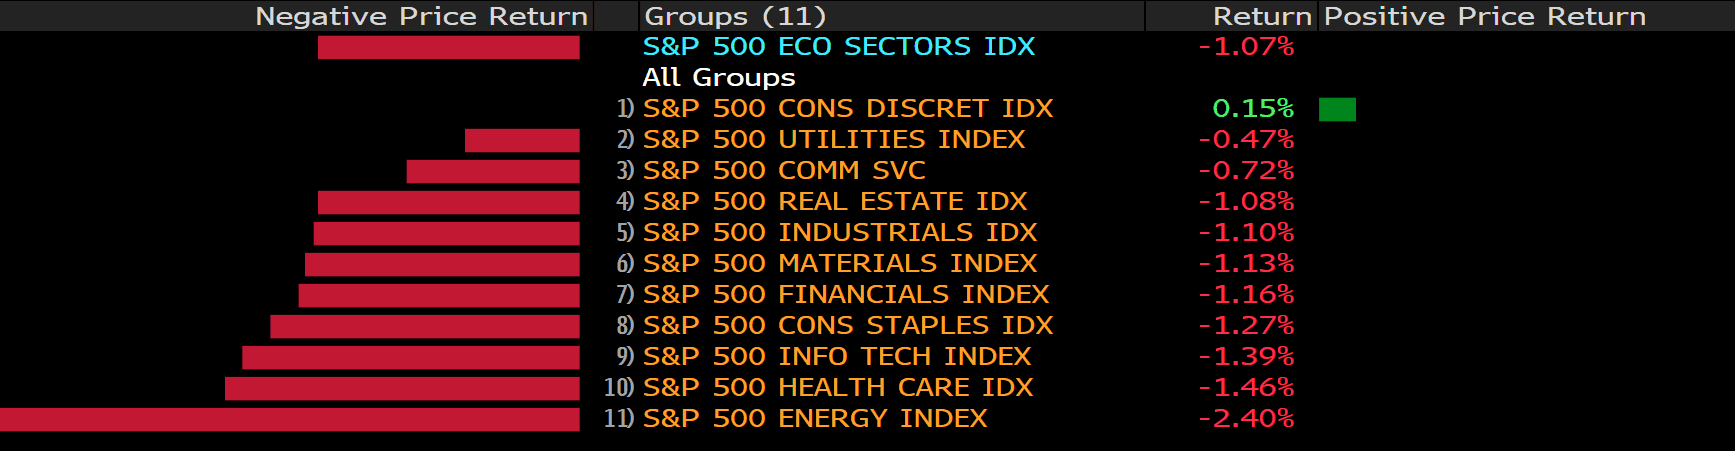
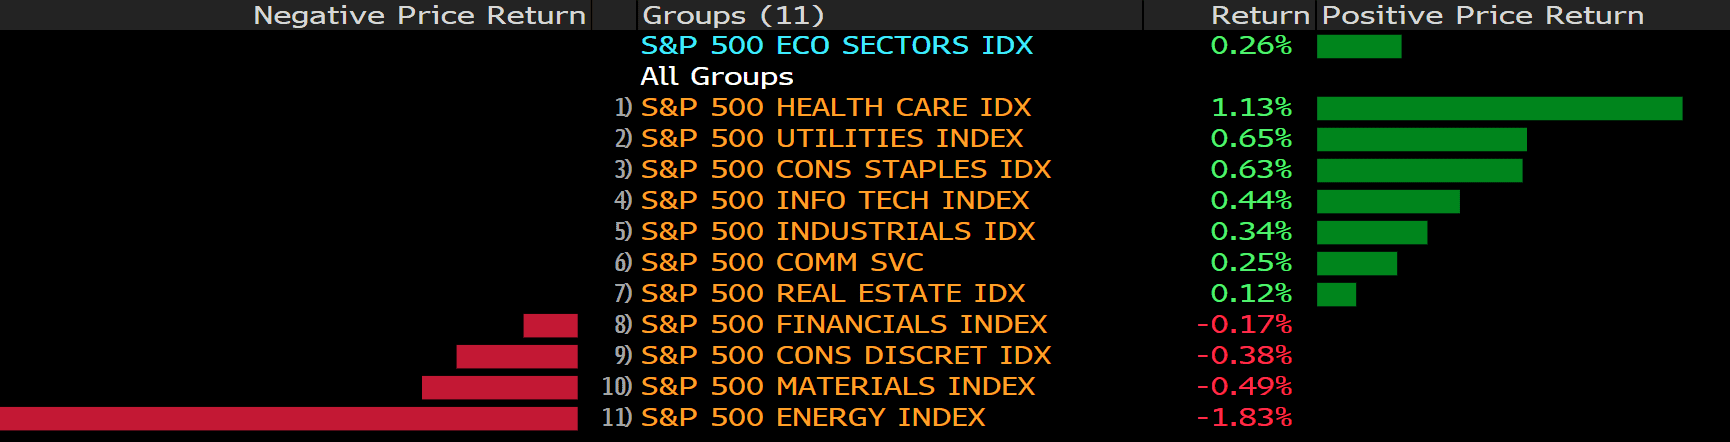
All major groups in the S&P 500 advanced, while the NYSE FANG+ Index of giants such as Apple Inc. and Facebook Inc. halted a five-day slide. Chinese shares listed in the U.S. rallied Friday, but were still on pace for their longest streak of weekly losses in a decade. The dollar rose for a fifth consecutive session. Treasuries fell.
Equities trimmed their decline for the week after being rattled by speculation the recovery could lose momentum just as central banks get ready to reduce support measures. Dallas Federal Reserve President Robert Kaplan said he’s open to adjusting his view that the Fed should start tapering its asset-purchase program sooner rather than later if the delta variant persists and hurts economic progress.
While risks to the global economy are mounting, money managers in search of returns are sticking to equities. U.S. stock-fund data collected before the Fed signaled it could potentially start tapering this year showed investors have confidence in policy support to buy the dip, according to Bank of America Corp. strategists.

Main Pairs Movement:
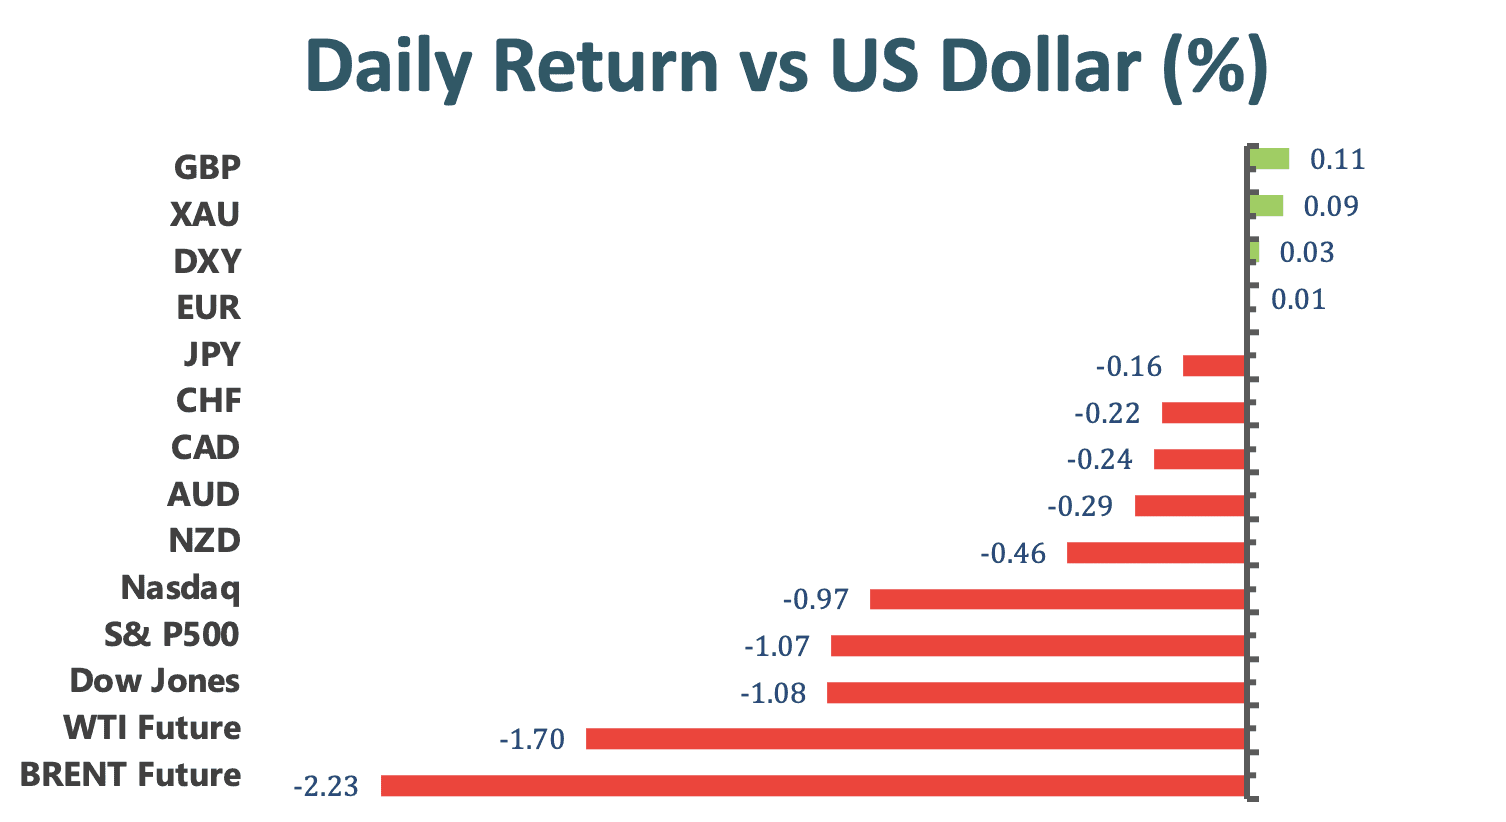
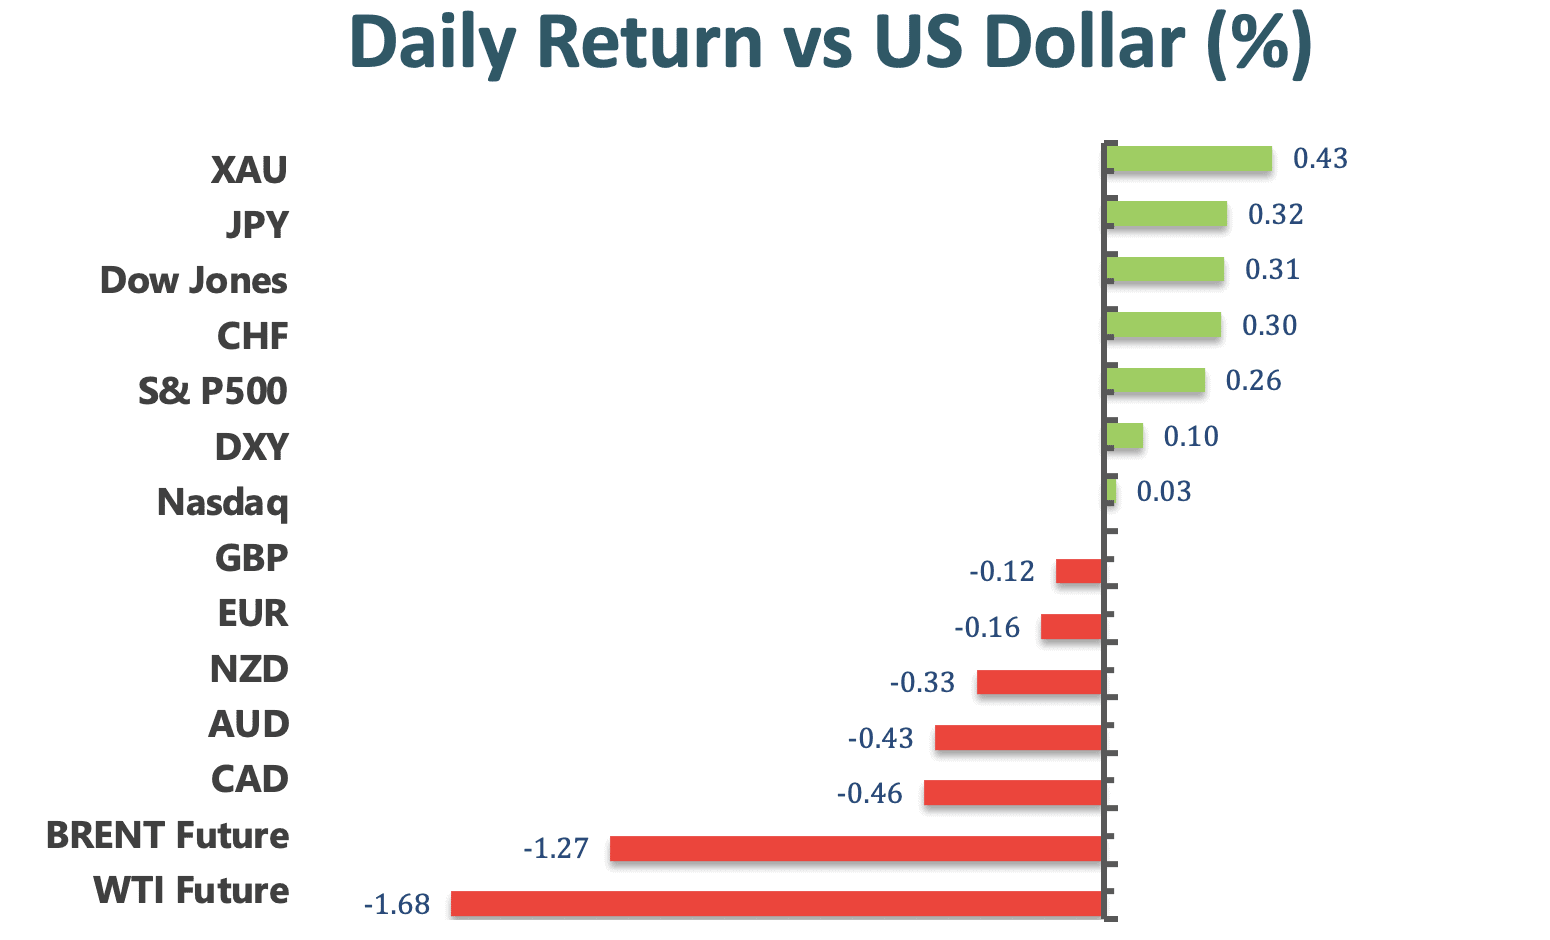
The US dollar failed to climb higher, starting to decline during American session on Friday. At the time of writing, the greenback is losing 0.07% on the day at 93.49. The fall is likely due to the downward correction in US dollar, this along with the market mood improved heading to the weekend, caused the dollar losing its strength. Investors now focus on next week’s Jackson Hole Symposium as more details about the timeline of US bond tapering expected to be released. A hawkish speech from Fed Chairman Jerome Powell can drive the US dollar up.
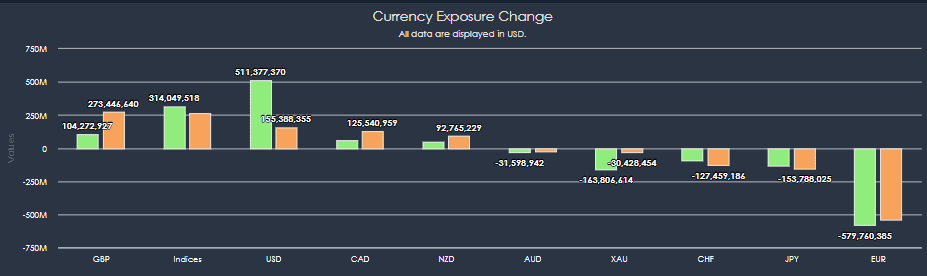
GBP/USD and AUD/USD both dropped on Friday, trading at 1.3621 and 0.7139, respectively. GBP/USD recorded a monthly low at 1.360 at the beginning of the American trading hours. As the UK Retail Sale released today disappointed, with a drop of 2.5% in the last month, against the market’s expected 0.4% growth. EUR/USD advanced today, now trading at 1.1698, a 0.2% gain for the day.
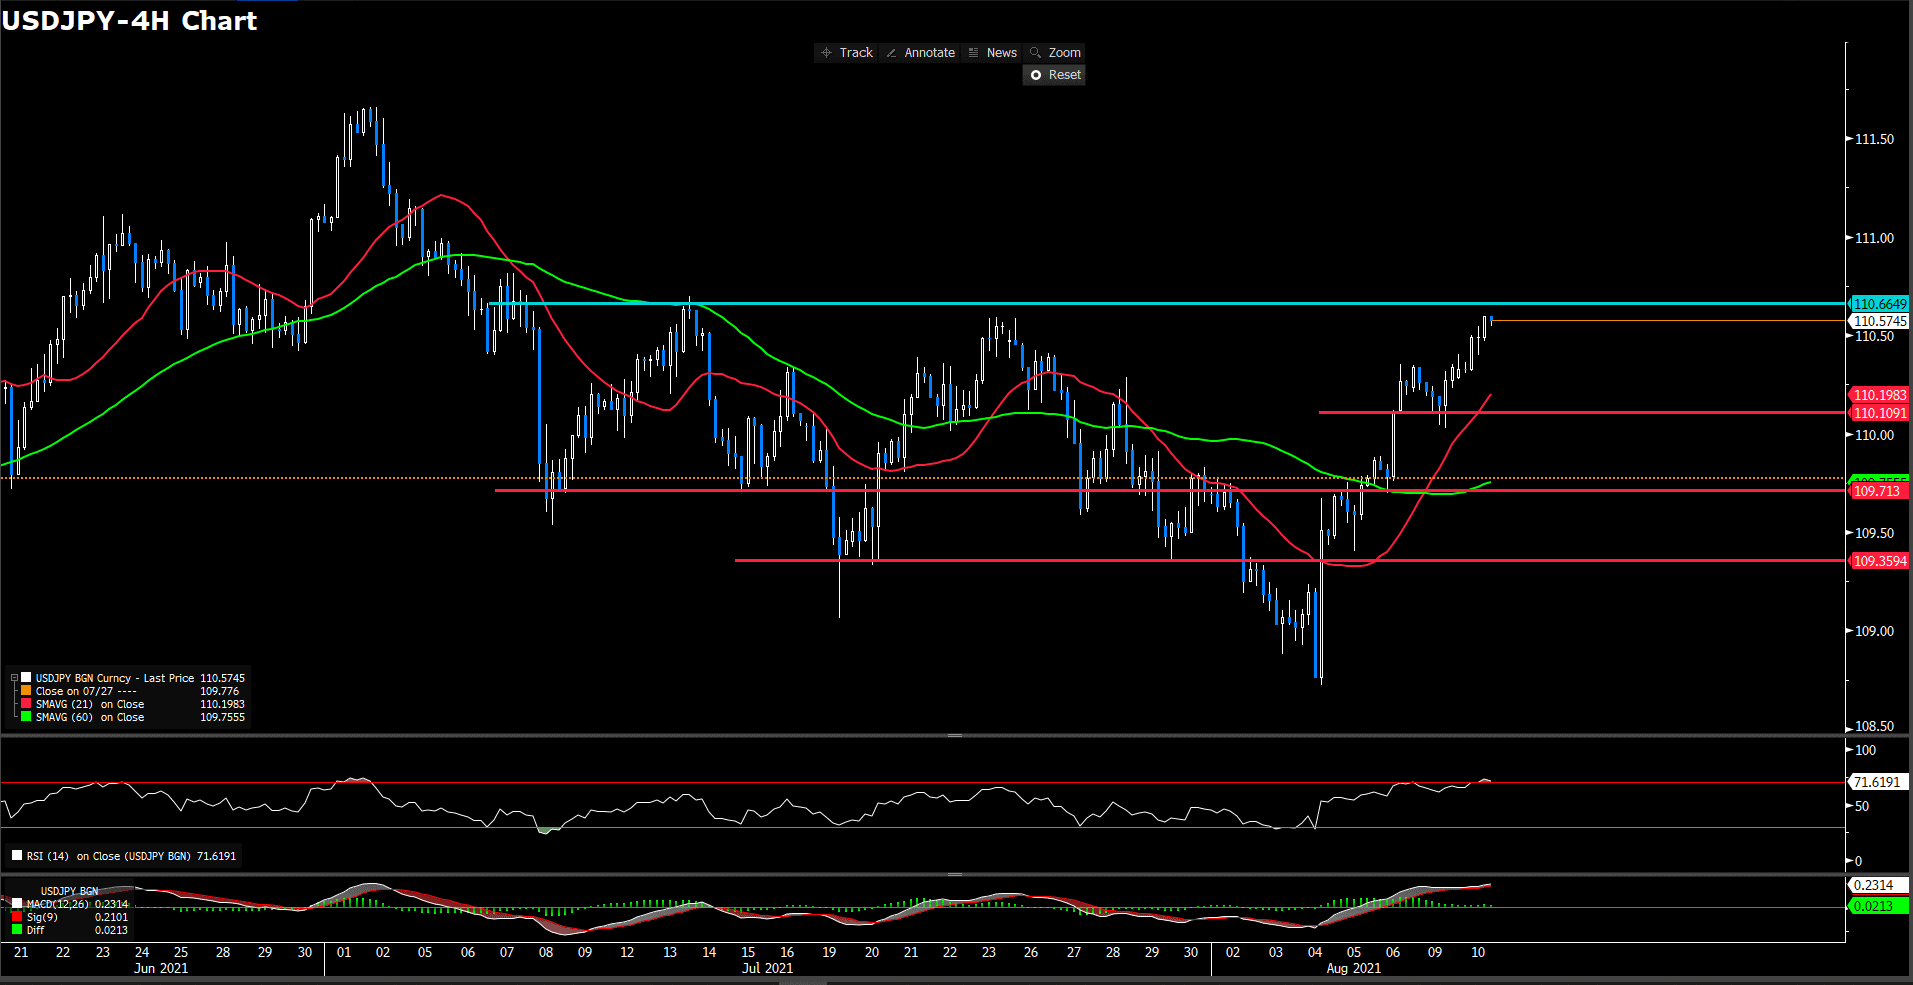
USD/JPY declined during Asia session, but then rebounded and recovered its losses from the day, now hovering around 109.81 at the time of writing.
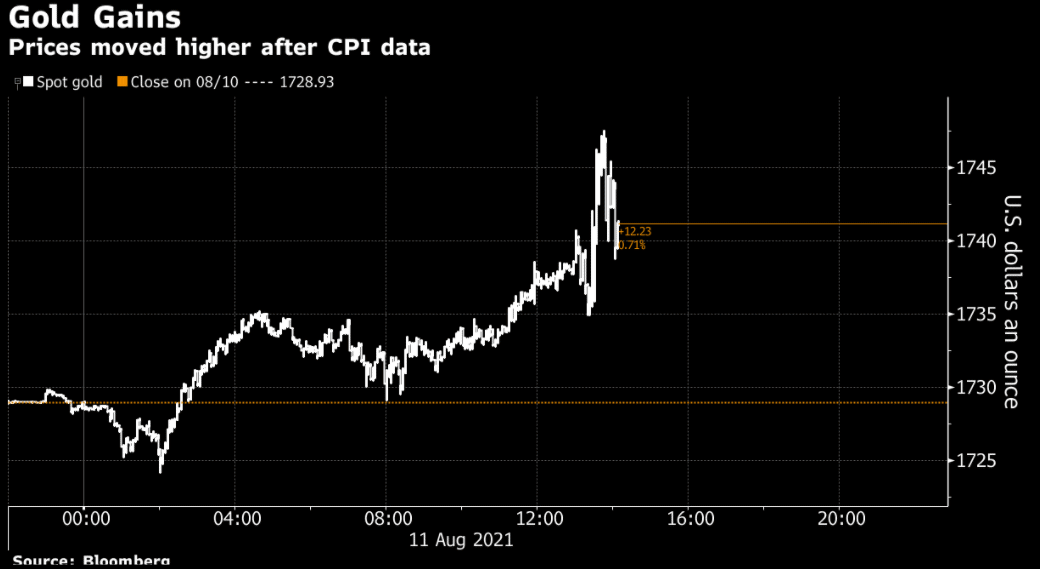
Gold priced edged up on Friday, now trading at 1782.47 at the time of writing. WTI keep falling for seven consecutive days, reaching a three-month low at 61.95. The crude oil slide is owing to the fears of slower demand due to increasing cases of Delta variant around the world.
Technical Analysis:
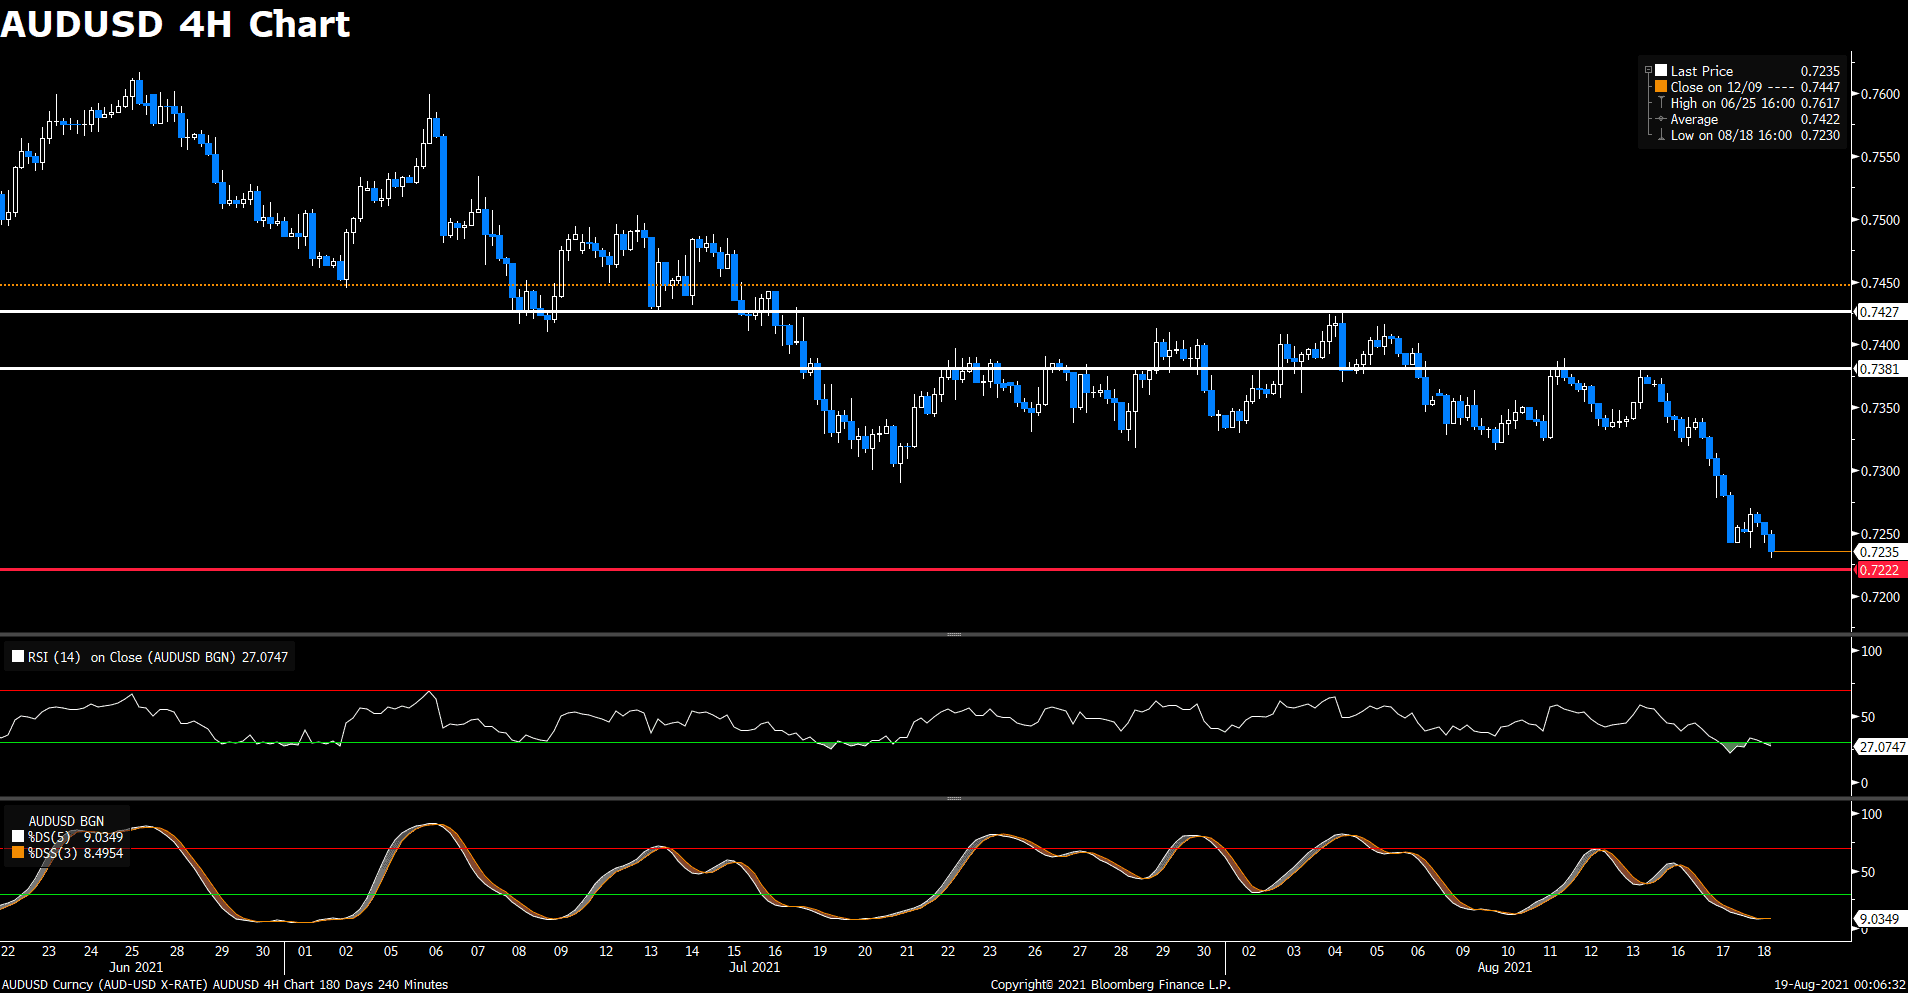
AUDUSD (4-hour Chart)

The AUD/USD pair dropped to the lowest level since November 2020 on Friday, then slightly picked up the losses during the North American session. The pair is trading around 0.7135 at the time of writing. For technical aspect, RSI indicator 27 figures as of writing, suggesting the market is oversold now and selling pressure is too high, traders should pay attention to whether the downward trend may reverse in the near future. If we take a look at Stochastic Oscillator, the fast line lied under 20 level which shows that the market is in a weak position.
In conclusion, we think market will be bearish as the pair failed to break the 0.7181 resistance line. If the price drops below the 0.7106 mark, it will open the door for additional near-term losses. The market focus now will be the Jackson Hole symposium next week as traders look for more clues about bond tapering.
Resistance: 0.7181, 0.7270, 0.7389
Support: 0.7106, 0.6991
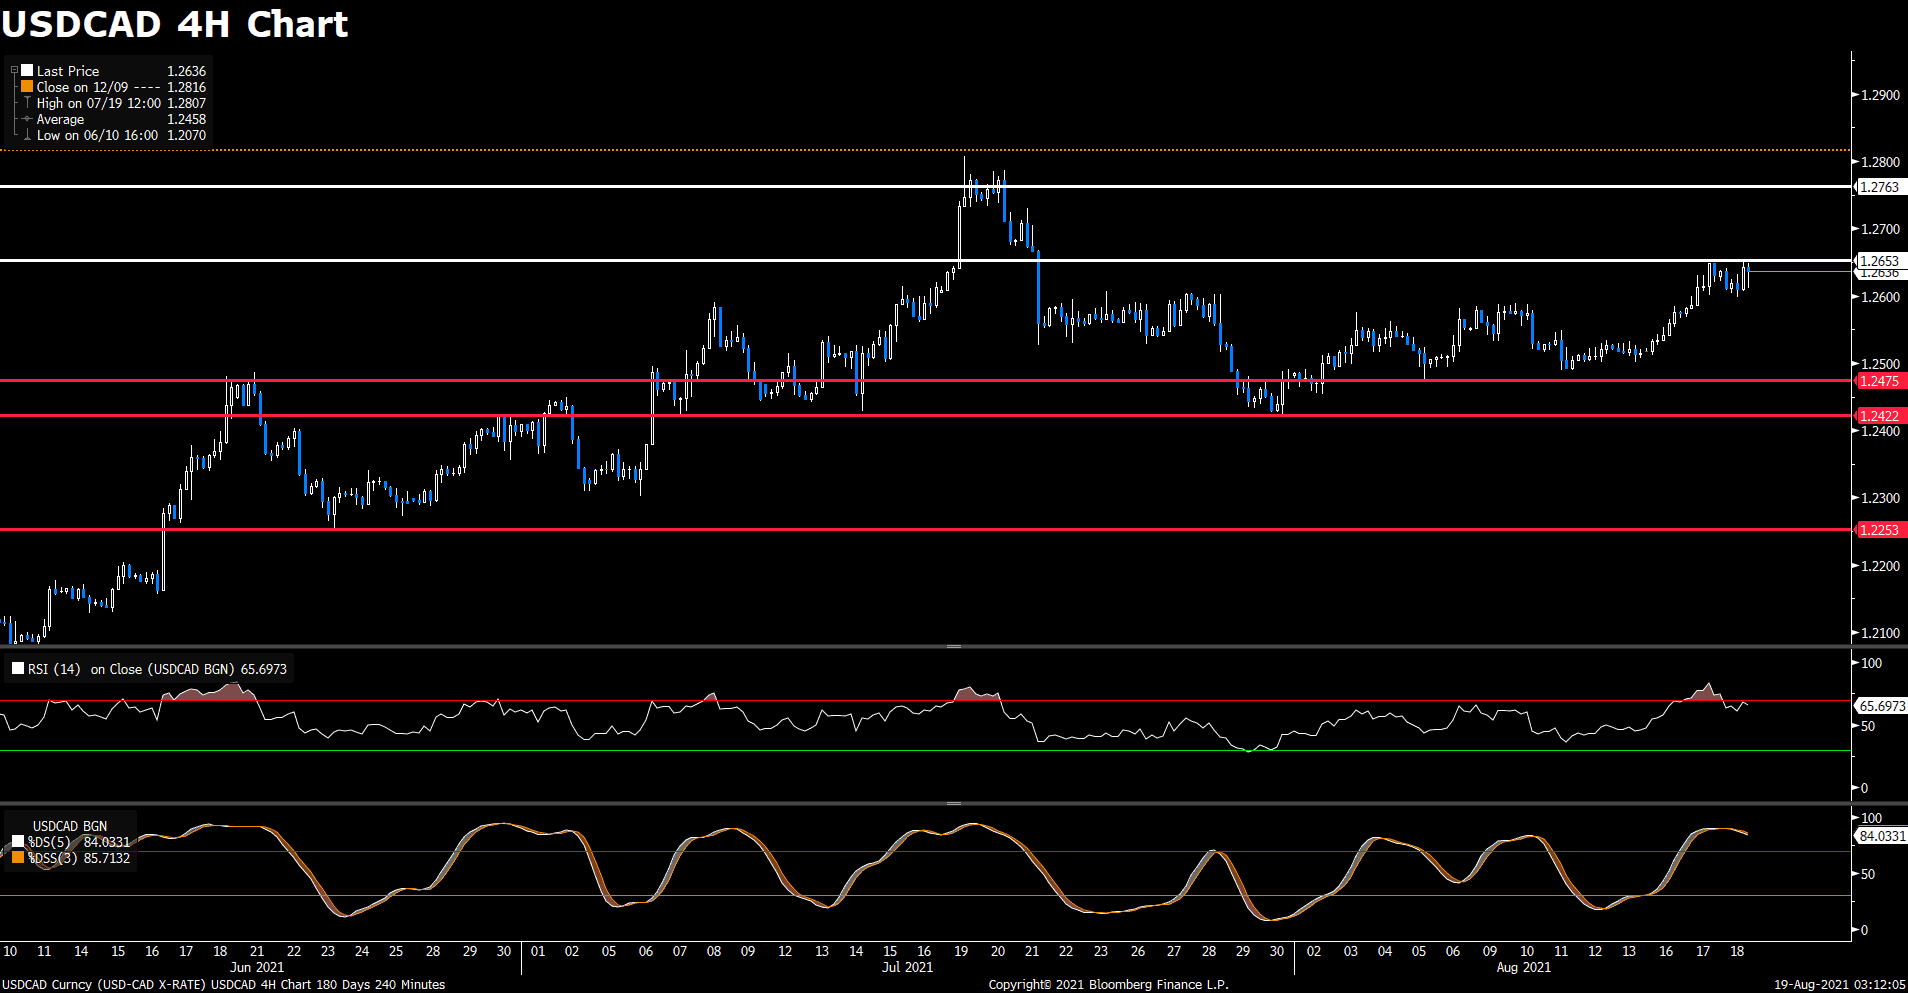
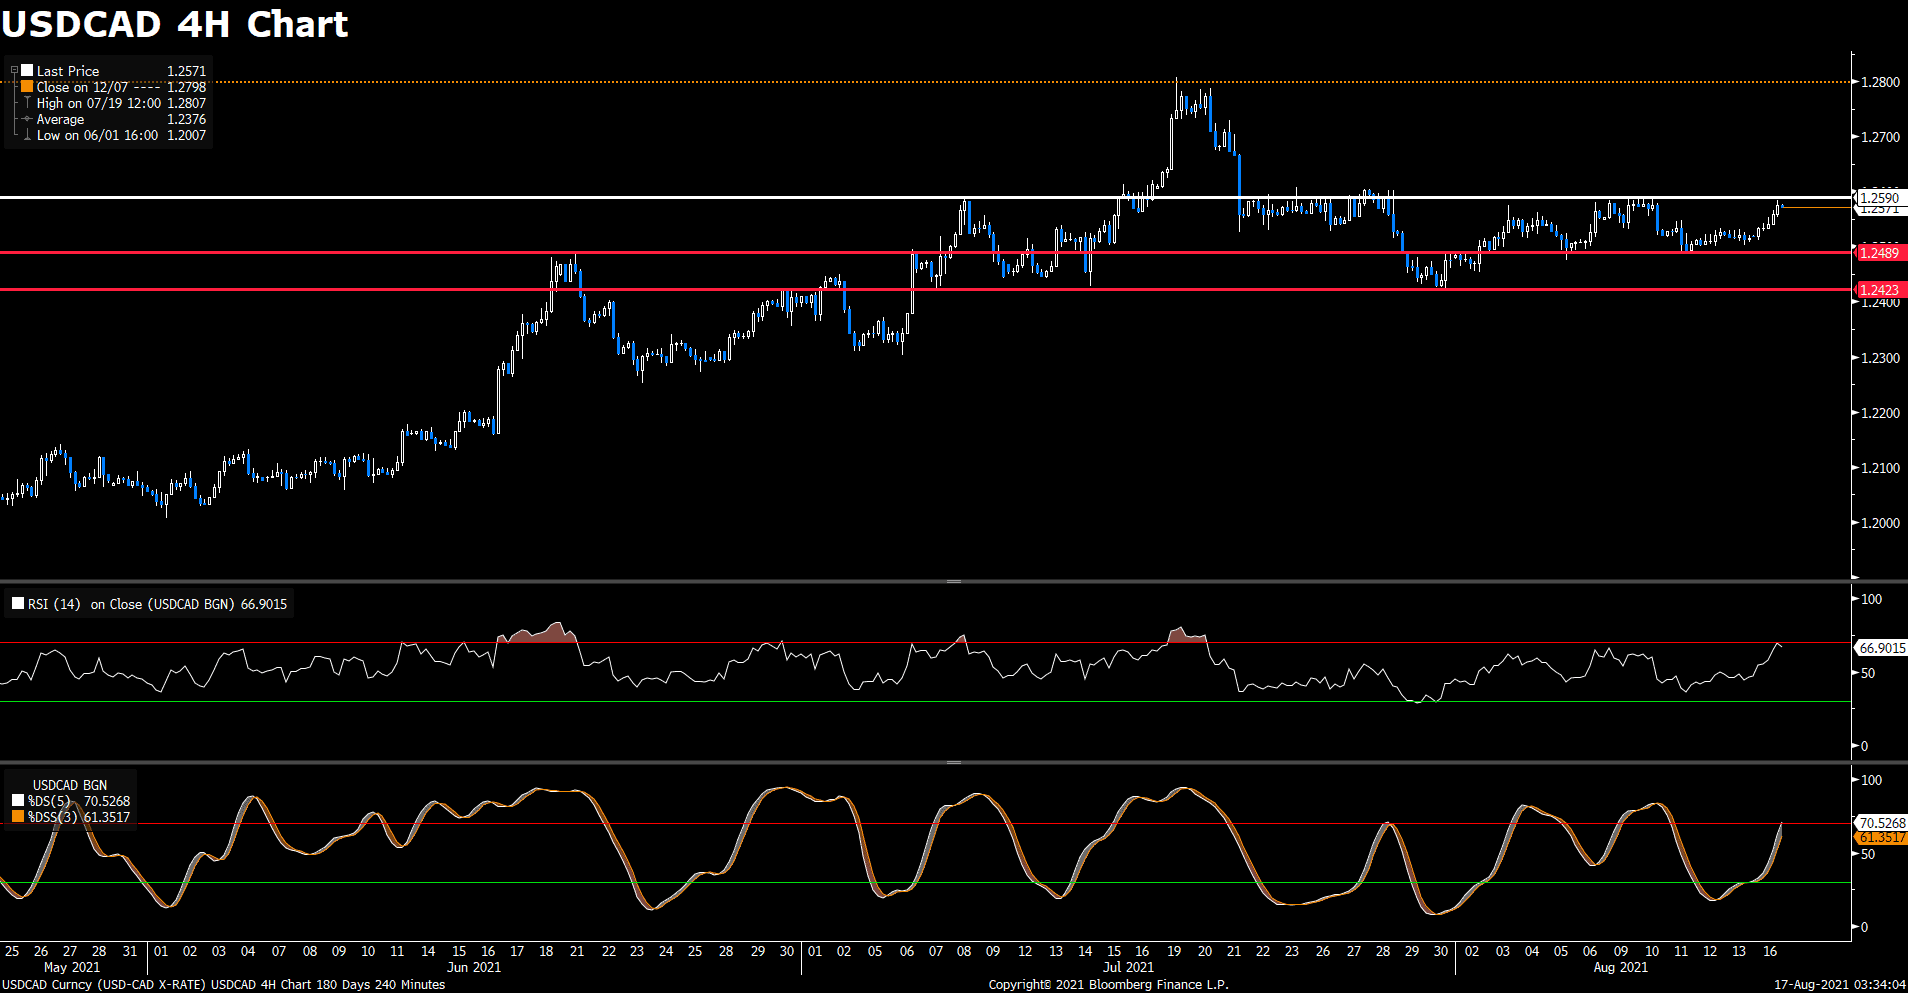
USDCAD (4- Hour Chart)

The USD/CAD pair was trading higher on Friday, but then pulled back during North American session. The pair is now trading at 1.2846 at the time of writing. For technical aspect, RSI indicator 70 figures as of writing, suggesting that the market is overbought now, and chances are high that the upward trend may reverse in the near future. If we take a look at Stochastic Oscillator, a fast line lied above 70 level, which shows that the market is in a strong position.
In conclusion, we think market will be tepid bearish, as the pair failed to break above the 1.2949 resistance line. The previous resistance now becomes support line at 1.2807. On Friday, Canada released its June Retail Sales, which rose by 4.2% on a monthly basis, less than what the market had expected of 4.4%. But the weaker-than-expected reading did not pushed the USD/CAD pair to a higher level.
Resistance: 1.2949, 1.3173
Support: 1.2807, 1.2649, 1.2475, 1.2422
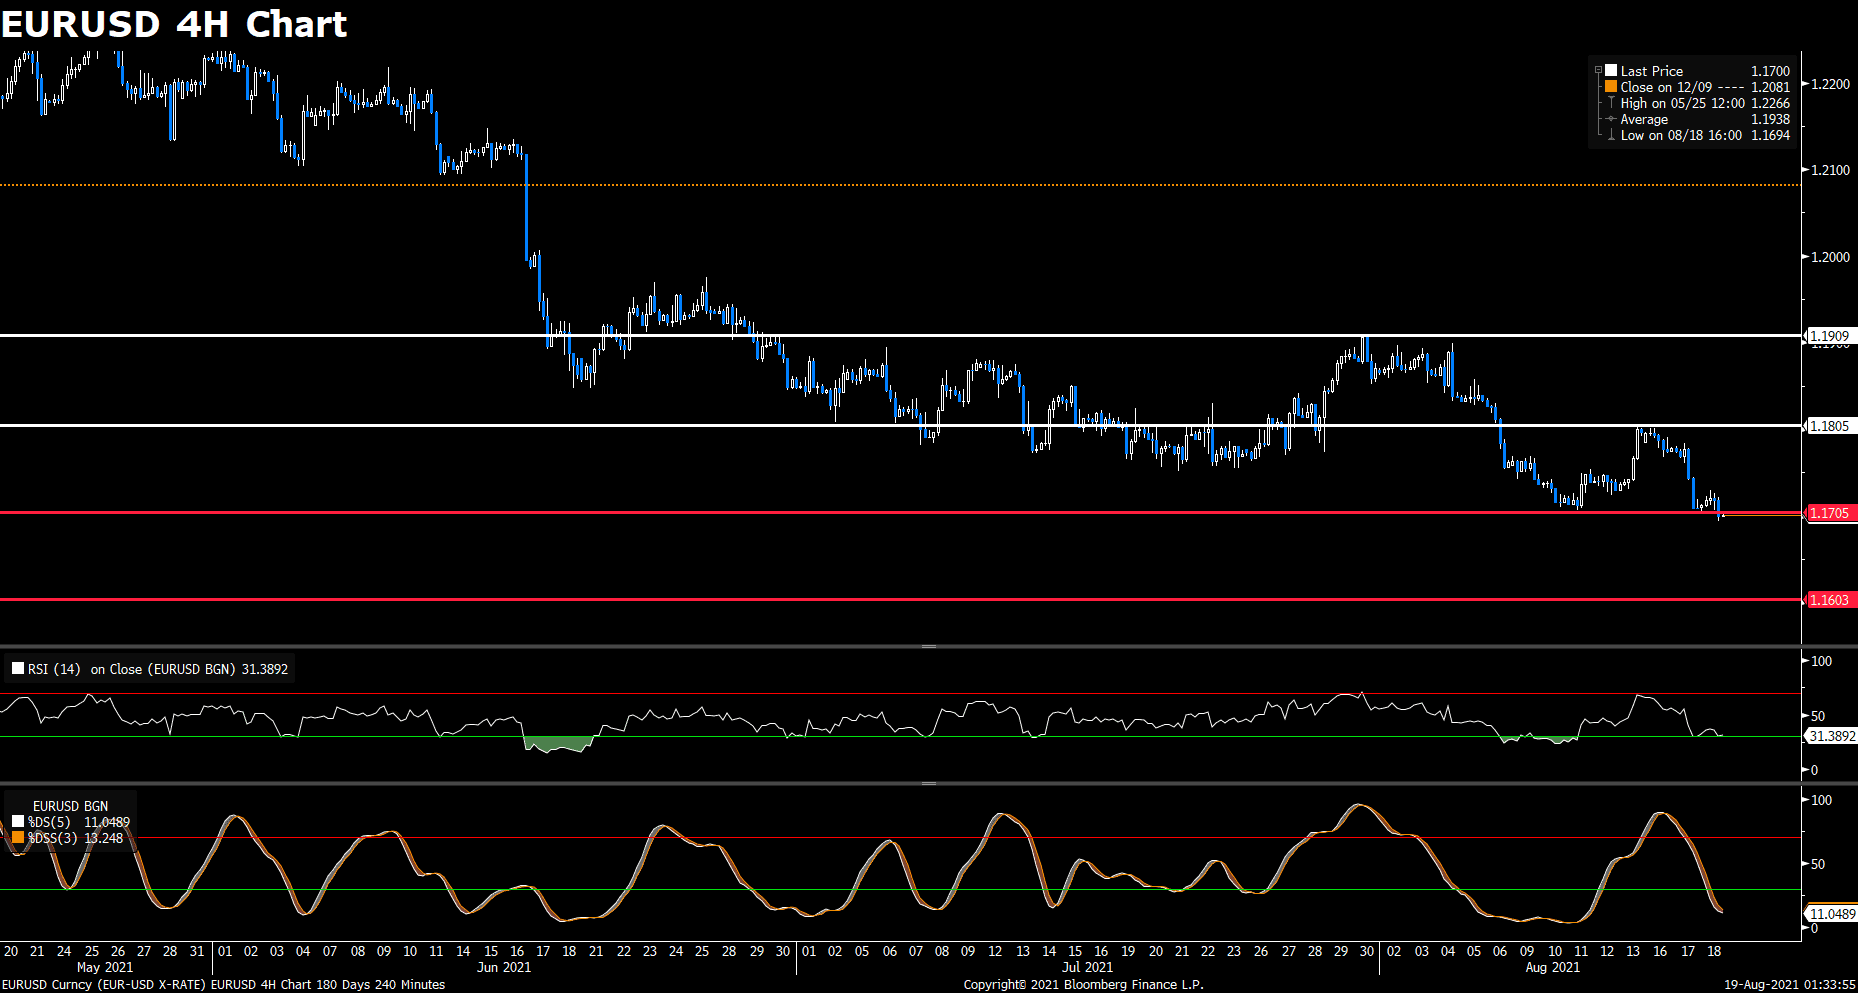
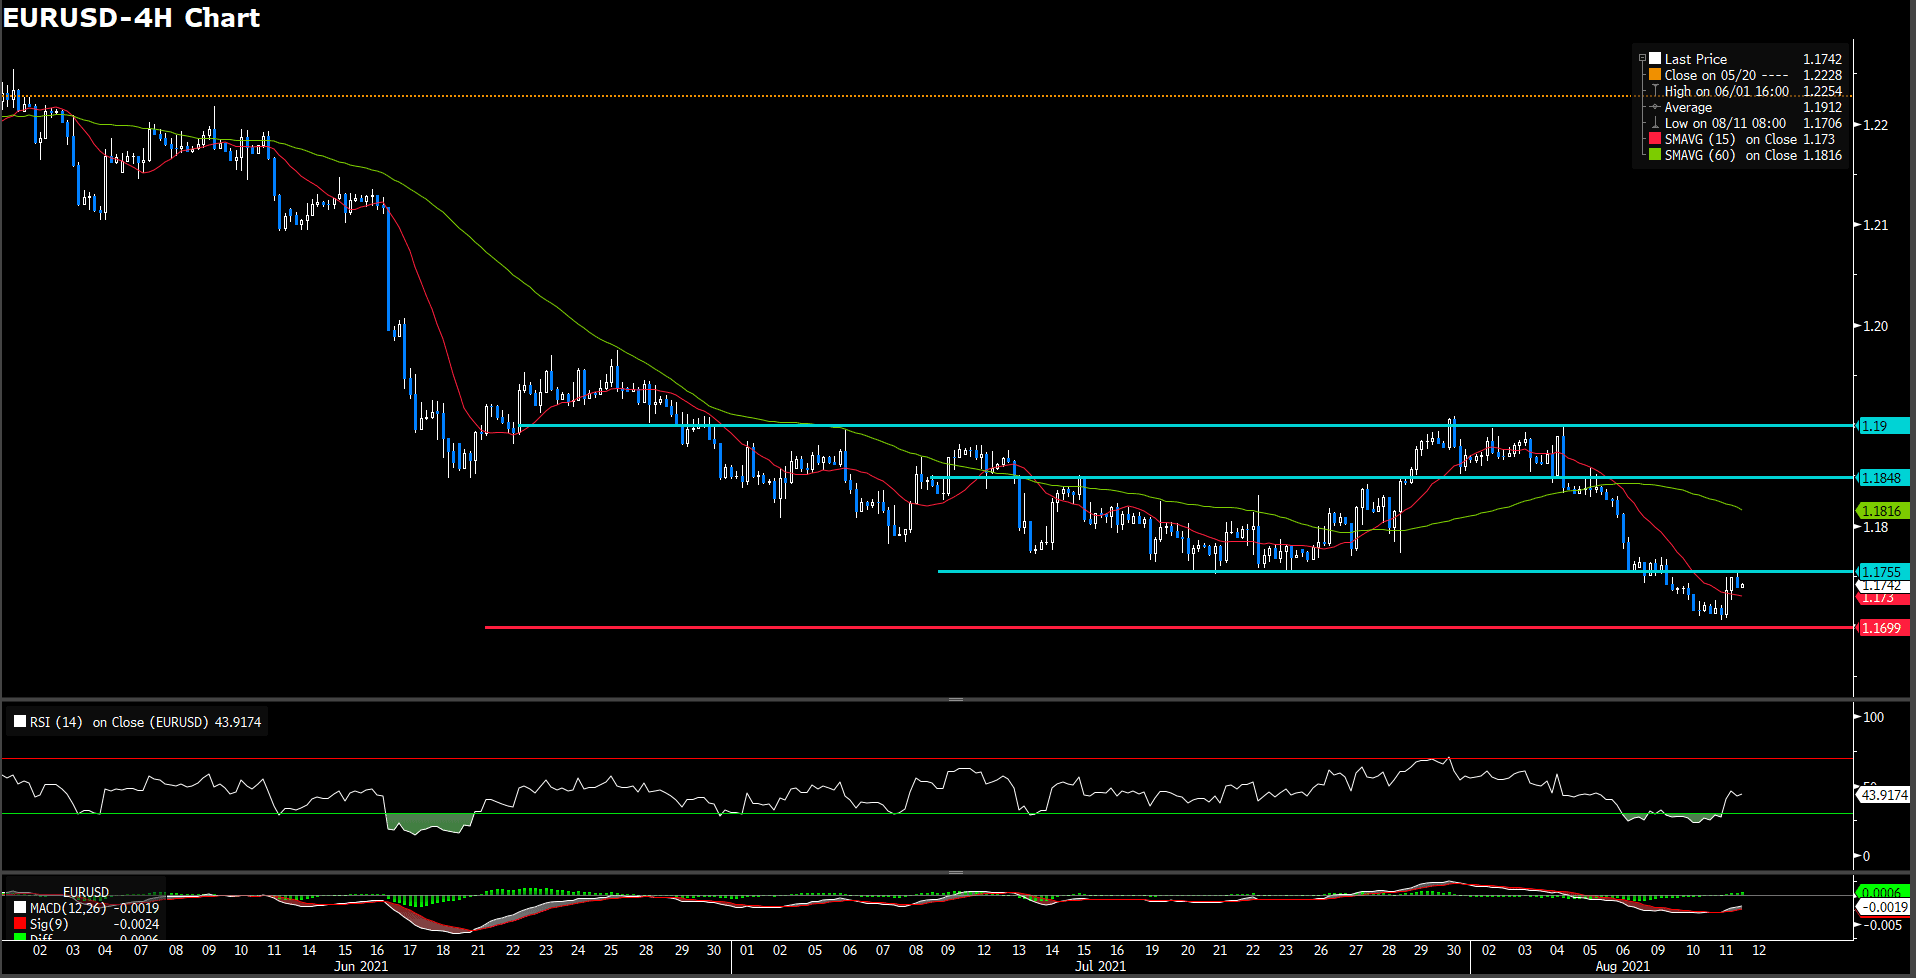
EURUSD (4- Hour Chart)

The EUR/USD pair took a surge in the middle of the American trading hours on Friday, then retreated modestly as the pair now trading at 1.1695. For technical aspect, RSI indicator 45 figures as of writing, suggesting there is no obvious trend for the pair now, the selling power is slightly stronger than the buying power. If we take a look at Stochastic Oscillator, a fast line lied under 30 level shows that the market is in a weak position.
In conclusion, we think market will be bullish as long as the 1.166 support line holds, as the pair is trying to test the 1.1753 resistance line. A break above that level could leads the pair to advance higher, and the next resistance line sits at 1.1805. For EUR/USD traders, the focus now shifts to the German Purchasing Managers Index releasing next Monday, as it will provide an update on Euro-zone macro conditions.
Resistance: 1.1753, 1.1805
Support: 1.1666, 1.1603
Economic Data
|
Currency |
Data |
Time (GMT + 8) |
Forecast |
||||
|
EUR |
German Manufacturing PMI (Aug) |
15:30 |
65.0 |
||||
|
GBP |
Composite PMI (Aug) |
16:30 |
|||||
|
GBP |
Manufacturing PMI (Aug) |
16:30 |
|||||
|
GBP |
Services PMI (Aug) |
16:30 |
|||||
|
USD |
Existing Home Sales (Jul) |
22:00 |
5.81M |
||||