Please note that the dividends of the following products will be adjusted accordingly. Index dividends will be executed separately through a balance statement directly to your trading account, and the comment will be in the following format “Div & Product Name & Net Volume”.
Please refer to the table below for more details:
The above data is for reference only, please refer to the MT4/MT5 software for specific data.
If you’d like more information, please don’t hesitate to contact info@vtmarkets.com.
The CLARITY Act debate in Washington is creating uncertainty across digital asset markets as lawmakers struggle to finalise a regulatory framework for crypto.
Banking opposition to stablecoin rewards highlights a growing battle between traditional finance and the emerging digital asset economy.
The Trump administration is pushing for faster crypto regulation, arguing delays could push innovation overseas.
Traders are also watching US CPI inflation data, which may influence Federal Reserve rate expectations and US dollar strength.
Key technical levels remain in focus across major markets, including gold near $4,996, Bitcoin defending $62,502 and USDX testing resistance near 99.631.
One of the biggest developments shaping market sentiment this week is the growing political battle around the Digital Asset Market Clarity Act of 2025, widely known as the CLARITY Act.
The legislation was originally designed to reset the regulatory framework for digital assets in the United States. After passing the House of Representatives with strong bipartisan support last year, the bill aimed to clearly divide regulatory authority between the Securities and Exchange Commission (SEC) and the Commodity Futures Trading Commission (CFTC).
However, progress has slowed dramatically in the Senate. What began as a technical attempt to define crypto market structure has evolved into a broader economic debate about the future of digital finance and the role of the traditional banking system.
Against the backdrop of a more accommodating regulatory tone from the Trump administration, the SEC is raising concern over increasingly aggressive fund structures. https://t.co/Hj4tH3TVbT
For traders, the outcome matters because regulatory clarity could unlock institutional participation in digital assets, while prolonged delays may continue to create volatility in crypto markets.
Why the Bill Has Stalled in Washington
The primary obstacle facing the CLARITY Act is a breakdown in negotiations over the revised Senate version of the bill.
While the House legislation moved quickly, Senate discussions encountered resistance early in 2026. A scheduled markup session in January was postponed indefinitely after several major industry participants withdrew their support for the latest draft.
Talks on landmark crypto legislation have hit a new impasse after banks said they could not back a compromise pushed by the White House, a development that cast doubt on whether the bill will pass this year and sparked criticism from President Trump who accused lenders of trying…
Crypto firms argued that the revised proposal introduced rules that were too restrictive and could limit innovation in the sector.
The White House attempted to force progress by setting a drafting deadline of March 1, 2026, but that date passed without an agreement. The delay has now become a focal point for markets watching how the United States intends to regulate the rapidly growing digital asset economy.
Banking Opposition and the Risk of Deposit Flight
Traditional banks have emerged as some of the most vocal opponents of the current version of the legislation.
Their concerns centre around a provision that would allow stablecoin issuers and crypto platforms to offer interest-like rewards on digital dollar tokens. Banks argue that this could create a powerful incentive for consumers to move deposits away from traditional savings accounts and into crypto wallets.
Industry estimates suggest that if stablecoins begin offering yields around 5%, while conventional savings accounts remain far lower, the shift could pull substantial liquidity out of the banking system.
For financial markets, the debate highlights a deeper conflict between legacy financial institutions and emerging digital asset platforms.
Trump Administration Pushes Crypto Agenda
President Trump has taken a more direct role in the debate, framing the CLARITY Act as a key pillar of his administration’s digital asset strategy.
In recent statements, the administration has criticised major banks for lobbying against the bill, accusing them of attempting to protect their profit margins by slowing regulatory reform.
The White House has also argued that delays could push digital asset innovation overseas, particularly toward countries that are already implementing clearer regulatory frameworks.
The Trump family’s flagship crypto project is once again facing questions. https://t.co/idy1IuXgI8
From the administration’s perspective, establishing the United States as a global centre for crypto innovation is both an economic and geopolitical objective.
For traders, this political backing increases the likelihood that some form of regulatory framework will eventually emerge, although the timeline remains uncertain. Read recent economic updates connected to Trump here.
Possible Paths Toward a Compromise
Despite the current stalemate, policymakers are exploring several potential compromises.
One proposal from the White House would allow stablecoin rewards only when tokens are actively used for payments, while preventing interest-style rewards on idle balances that resemble traditional savings accounts.
Another development gaining traction is the rise of federal trust bank charters for crypto companies. Several fintech and digital asset firms have recently applied for or received these charters through the Office of the Comptroller of the Currency, allowing them to operate with a degree of federal oversight while broader legislation remains unresolved.
While these measures do not replace the CLARITY Act itself, they may offer a temporary pathway for the industry as lawmakers continue negotiations.
Legislative Timeline Traders Should Watch
The political calendar is also becoming a critical factor.
With US midterm elections approaching in 2026, the window for passing the legislation is narrowing.
Current expectations suggest several key milestones:
March 2026: Closed-door negotiations continue after the missed drafting deadline.
April 2026: New rules around federal crypto charters could begin taking effect.
May 2026: Final opportunity for a Senate Banking Committee markup before election season dominates the agenda.
August 2026: Target window for a full Senate vote.
January 2027: Potential implementation date if the bill passes before year-end.
For markets, these milestones will shape expectations for regulatory clarity and could influence the trajectory of digital asset investment in the United States.
Markets watching signals for upcoming rate decisions
Mar 13
USD
GDP m/m
0.20%
0.10%
Growth data gauges economic momentum
Mar 13
USD
Core PCE Price Index
0.40%
0.40%
Fed’s preferred inflation gauge
Mar 13
USD
JOLTS Job Openings
6.84M
6.54M
Labour demand trends influence policy outlook
For a full view of upcoming economic events, check out VT Markets’ Economic Calendar.
Key Movements Of The Week
Gold (XAUUSD)
XAUUSD consolidates above $4,996 support.
Break below $4,842 may attract stronger sellers.
CPI inflation data could trigger volatility.
Bitcoin (BTCUSD)
BTCUSD rejected after breaking $70,969 swing high.
$62,502 now acts as the final defence for buyers.
Crypto regulation debate adds volatility risk.
US Dollar Index (USDX)
USDX gapped higher at the start of the week.
Break above 99.631 could trigger move toward 100.321.
CPI may decide the next direction.
SP500
SP500 failed near 6,902 resistance and printed a swing low.
6,517 now acts as the crucial support level.
Geopolitical tensions increase volatility.
Bottom Line
Markets are entering the week with several competing forces shaping price action. Inflation remains the central macro driver, with US CPI expected at 2.5% year on year. A stronger reading could reinforce US dollar strength and delay expectations for Federal Reserve rate cuts.
At the same time, geopolitical tensions and rising oil prices above $100 are adding risk premium to global markets. Technically, gold continues to consolidate above $4,996, Bitcoin is defending the $62,502 support level after a failed breakout above $70,969, and the US Dollar Index is testing resistance near 99.631.
These levels will likely determine the next directional move as traders react to inflation data, regulatory developments in crypto markets, and shifting global risk sentiment.
Create a live VT Markets account today to access our platform features, including market insights and educational content.
Trader FAQs
What is the outlook for gold prices this week? Gold (XAUUSD) is trading in consolidation while markets wait for US CPI data. The key level to watch is $4,996, which currently acts as support. If gold falls below this level, sellers may begin targeting $4,842, where stronger downside momentum could develop. Inflation data and US dollar strength will likely determine the next major move.
Why did Bitcoin fall after breaking above $70,000? Bitcoin briefly broke above the $70,969 swing high, but the move quickly reversed as traders took profit and risk sentiment weakened. The market is now defending $62,502, which has become the most important support level in the current structure. A sustained break below this level could open the door for a deeper correction.
How does the CLARITY Act affect Bitcoin and crypto markets? The Digital Asset Market Clarity Act aims to define regulatory oversight between the US Securities and Exchange Commission (SEC) and the Commodity Futures Trading Commission (CFTC). However, the bill has stalled in the Senate due to disagreements around stablecoin rewards and banking oversight. This regulatory uncertainty is contributing to volatility in Bitcoin and broader digital asset markets.
Why is the US CPI important for traders? US Consumer Price Index (CPI) data measures inflation and strongly influences expectations for Federal Reserve interest rate decisions. If inflation comes in higher than expected, the Federal Reserve may delay rate cuts, which could strengthen the US dollar and pressure assets such as gold and Bitcoin.
What levels should traders watch in the US Dollar Index (USDX)? The US Dollar Index recently gapped higher, with traders watching 99.631 as the immediate resistance level. If the dollar breaks above this level, it could move toward 100.321, strengthening the currency further and potentially weighing on commodities such as gold.
Please note that the dividends of the following products will be adjusted accordingly. Index dividends will be executed separately through a balance statement directly to your trading account, and the comment will be in the following format “Div & Product Name & Net Volume”.
Please refer to the table below for more details:
The above data is for reference only, please refer to the MT4/MT5 software for specific data.
If you’d like more information, please don’t hesitate to contact info@vtmarkets.com.
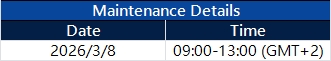
As part of our commitment to provide the most reliable service to our clients, there will be maintenance this weekend.
Please note that the following aspects might be affected during the maintenance:
1. The price quote and trading management will be temporarily disabled during the maintenance. You will not be able to open new positions, close open positions, or make any adjustments to the trades.
2. There might be a gap between the original price and the price after maintenance. The gaps between Pending Orders, Stop Loss, and Take Profit will be filled at the market price once the maintenance is completed. It is suggested that you manage the account properly.
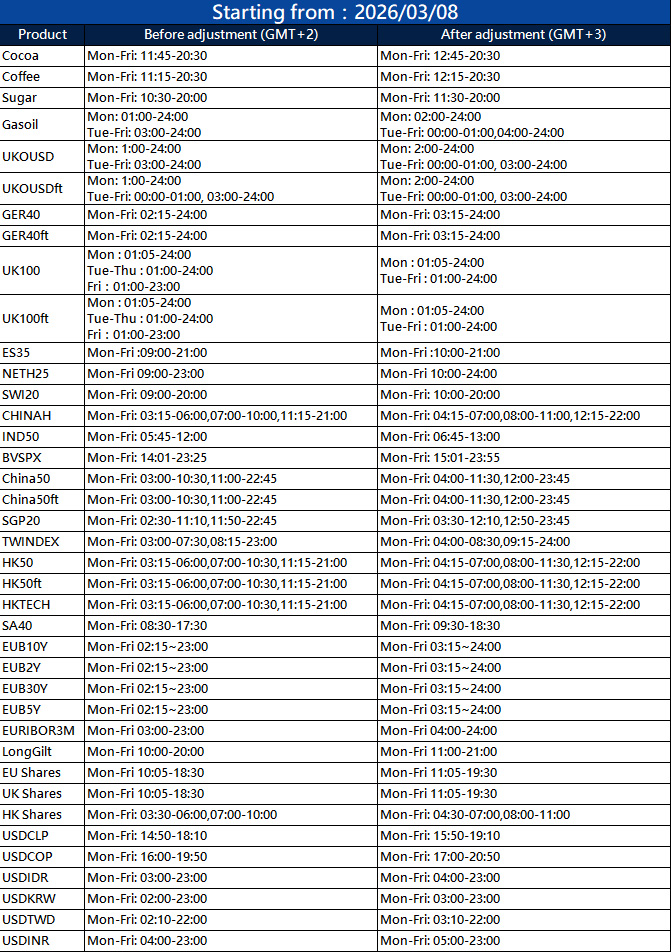
3. Due to the Daylight Saving Time (DST) adjustment, the server time zone will change from GMT+2 to GMT+3 after the server reopens on 08 March at 14:00 (GMT+3).
4. During the maintenance period, VT Markets APP will not be available. It is recommended that you avoid using it during the maintenance.
5. During the maintenance period, VT Markets APP Copy Trading will not be available. It is recommended that you avoid this service during this period. All the other services on the VT APP remain normal.
6. During the maintenance hours, the Client portal will be unavailable, including managing trades, Deposit/Withdrawal and all the other functions will be limited.
The above data is for reference only. Please refer to the MT4/MT5 software for the specific maintenance completion and marketing opening time.
Thank you for your patience and understanding about this important initiative.
If you’d like more information, please don’t hesitate to contact info@vtmarkets.com
Jakarta, Indonesia – 5 March 2026 – VT Markets has successfully concluded its Ramadan Community Outreach initiative in collaboration with YCAB Foundation, an Indonesia-based non-profit organisation focused on youth empowerment and community development, with programs spanning education, financial inclusion, and sustainable economic support.
Launched in observance of the holy month of Ramadan, the initiative was designed to ease the additional financial pressures faced by underserved families during this significant period. Through YCAB Foundation’s well-established grassroots network, beneficiaries were carefully identified, ensuring that assistance was delivered directly and responsibly to 100 families in need across East Jakarta.
“Through this collaboration, we hope to provide not just essential support, but also a reminder that no one stands alone, especially during Ramadan, a season rooted in compassion and shared responsibility. With partners like VT Markets, we’re able to reach vulnerable families in a timely way while continuing to strengthen their resilience and ability to move forward with greater stability,” said Samantha Susilo, Chief of Party at YCAB Foundation.
On 27 February 2026, a combined team of VT Markets volunteers and YCAB employees came together on the ground to distribute essential food staple packages. Families in need received essential food staple packages containing rice, cooking oil, sugar, and other daily necessities – practical essentials intended to relieve short-term financial strain while allowing families to observe Ramadan with greater peace of mind.
“During Ramadan, we are reminded that meaningful impact begins with shared responsibility,” said Dandelyn Koh, Head of Global Marketing at VT Markets. “Working together with YCAB Foundation has allowed us to extend support to families during this important season, and we are truly grateful for that opportunity. We would also like to thank our partners and clients for their continued trust, which makes initiatives like this possible.”
The successful completion of this programme reinforces VT Markets’ broader commitment to responsible corporate engagement in Indonesia. Beyond its role in the financial markets, the company continues to invest in community-focused initiatives that foster resilience, strengthen local relationships, and deliver measurable social value.
As VT Markets expands its regional footprint, purposeful outreach remains central to its long-term goal of transforming presence into partnership and commitment into meaningful action.
About VT Markets
VT Markets is a regulated multi-asset broker with a presence in over 160 countries as of today. It has earned numerous international accolades including Best Online Trading and Fastest Growing Broker. In line with its mission to make trading accessible to all, VT Markets offers comprehensive access to over 1,000 financial instruments and clients benefit from a seamless trading experience via its award-winning mobile application.
Founded in 1999, YCAB Foundation envisions breaking the cycle of poverty by utilizing financial inclusion as a tool to expand and strengthen education for adolescents from urban poor families. YCAB has impacted over 5 million youth and empowered more than 200,000 ultra-micro women entrepreneurs. In 2024, YCAB Foundation maintained its rank at #28 on the TOP 100 SGO/NGO list by TheDotGood, a global nonprofit rating organization based in Geneva, Switzerland.
Please note that the dividends of the following products will be adjusted accordingly. Index dividends will be executed separately through a balance statement directly to your trading account, and the comment will be in the following format “Div & Product Name & Net Volume”.
Please refer to the table below for more details:
The above data is for reference only, please refer to the MT4/MT5 software for specific data.
If you’d like more information, please don’t hesitate to contact info@vtmarkets.com.
The fintech ecosystem in Mexico continues to mature, reflected in 131 new jobs
Mexico is entering an economic landscape that reflects both strengths and challenges. Macroeconomic stability remains moderate, with GDP growth projections between 1.2% and 1.5%, low formal unemployment, and an exchange rate of less than 18 pesos per dollar. However, inflation has shown a slight acceleration, reaching 3.77% in the first half of January, which calls for greater vigilance in monetary policies.
Fintech sector dynamics
Mexico’s fintech ecosystem continues to mature, focusing on digital payments, crypto assets, and innovative Defi solutions that respond to the demand for financial inclusion. In 2025, 131 new ventures were registered, contributing to growing revenues and an expanding market, in which regulation and technology adoption play a key role. This growth positions Mexico as a regional hub, attracting investment and specialized talent in a predictable but cautious economic environment.
Money Expo Mexico 2026
This event is celebrating its fourth edition on February 18 and 19 at the Banamex Center, establishing itself as the most important financial event for trading, investment, fintech, and blockchain in the country. In a context of regional fintech growth, it offers workshops, market analysis, and B2B opportunities for professionals and institutions.
VT Markets returns after participating in the inaugural edition in 2023, highlighting its commitment to the global financial community. This year, it intensified its presence with two activities led by Eduardo Romero, senior market analyst, on the first day, with a round table discussion entitled “Preparing for the future: what will really change the markets in 2026?”; and a presentation on the second day of the event, entitled “The new trading game: how professionals operate in highly uncertain markets.”
“Since last year, with Donald Trump’s presidency, we’ve seen a series of aggressive trade measures that have increased market volatility and kept investors and traders on constant alert. High-profile issues like the political situation between Iran and the United States trigger market movements,” says Eduardo Ramos, Senior Market Analyst at VT Market.
As an investor, navigating market uncertainty can be a constant challenge. Therefore, Eduardo Ramos, drawing on his expertise, emphasizes that “stability coexists with periods of uncertainty; the difference lies not in predicting the market, but in operating with a solid method for reading and analyzing data.”
This participation underscores the collaboration with industry professionals in a rising fintech hub such as Mexico.


