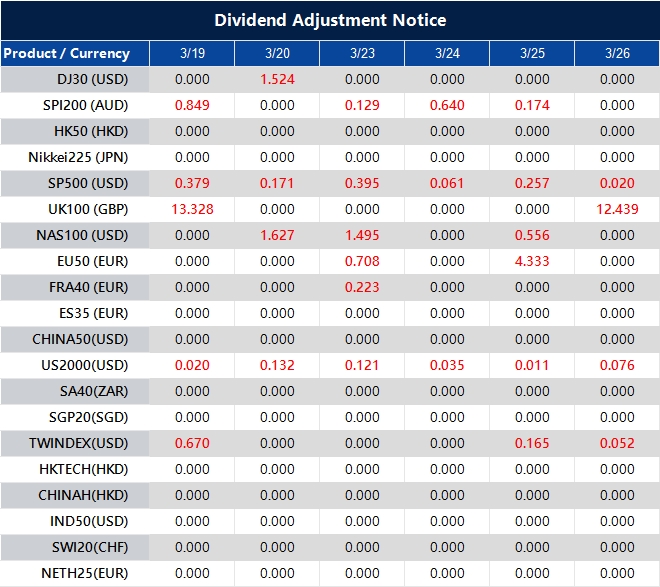
Please note that the dividends of the following products will be adjusted accordingly. Index dividends will be executed separately through a balance statement directly to your trading account, and the comment will be in the following format “Div & Product Name & Net Volume”.
Please refer to the table below for more details:
The above data is for reference only, please refer to the MT4/MT5 software for specific data.
If you’d like more information, please don’t hesitate to contact info@vtmarkets.com.
Middle East conflict keeps USOil elevated and may delay Fed rate cut expectations.
XAUUSD tests downside liquidity near 4,996 as USDX consolidates.
BOJ policy decision could move USDJPY as price approaches 160.
FOMC press conference may reset Fed rate expectations.
Markets are now reacting to a geopolitical confrontation that began with Operation Epic Fury on 28 February 2026. What initially started as targeted US strikes has expanded into a broader regional conflict with no clear timeline for resolution.
Bloomberg's Jeff Mason, Joumanna Bercetche and Ethan Bronner discuss US, Israel launch of 'Operation Epic Fury' in Iran on Bloomberg This Weekend.
The conflict has quickly moved beyond military headlines and into macroeconomics. Traders are now focused on how long the US economy can absorb the shock of rising energy prices and geopolitical risk.
Brent crude surged from roughly $70 to above $110 per barrel, signalling a sharp repricing of geopolitical risk. Analysts warn that if oil prices remain above $130, global GDP growth could fall by about 0.6% in the first half of 2026.
If oil prices continue to rise, inflation expectations could climb again and delay Fed rate cuts.
The Market “Crack” Point
Energy markets influence consumer spending faster than most macro variables.
Historically, US gasoline prices approaching $4.00 per gallon have triggered sharp declines in consumer spending. That level is often where the broader economy begins to feel the full impact of rising oil prices.
If consumer demand slows while inflation remains elevated, the Federal Reserve faces a difficult choice between supporting growth and controlling prices.
For traders, this creates a two-sided risk environment.
Equities and crypto tend to weaken if economic growth slows, while gold can benefit from uncertainty and geopolitical demand.
Consumer stress from energy prices can drive volatility across XAUUSD, BTCUSD and SP500.
The Strait of Hormuz and Global Oil Supply
Energy supply risk has become another major concern.
Roughly 20% of the world’s oil supply passes through the Strait of Hormuz, making it one of the most important energy chokepoints in global trade.
Any threat to shipping routes or tanker traffic in that region can immediately push oil prices higher.
The US Navy can attempt to secure shipping lanes, but maintaining that protection requires a large and sustained military presence. Strategic petroleum reserves can cushion short-term disruptions, but they cannot fully offset a prolonged supply shock.
President Donald Trump said he is “demanding” that other countries contribute to the defense of Strait of Hormuz as it remains effectively closed to oil tankers https://t.co/ARQXPCyWw2
Continued threats to the Strait of Hormuz could keep oil elevated and sustain inflation pressure.
If you’d like to read more about how wars affect oil prices, check out our Opinion article here.
The Stagflation Risk
The most dangerous scenario for markets is stagflation.
Rising oil prices increase inflation while also reducing consumer spending and corporate profitability. That combination slows economic growth while keeping prices elevated.
This creates a policy dilemma for the Federal Reserve. Under normal circumstances, the Fed would keep rates high to control inflation. However, a sharp slowdown or market sell-off could increase pressure on policymakers to ease financial conditions.
The geopolitical context adds another layer to the debate. Some analysts believe that a severe market downturn during a national security crisis could push political pressure on the Fed to cut rates aggressively.
Stagflation would create volatility across currencies, commodities and equities.
Strategic Endurance and Market Psychology
The conflict also introduces a strategic endurance element that markets must consider.
Iran has built a decentralised defence structure designed to withstand sustained attacks. Instead of relying on a single command centre, the country operates through multiple regional zones that can continue functioning even if leadership structures are disrupted.
This strategy is designed to prolong the conflict and increase the economic cost for its opponents.
The longer the conflict continues, the greater the pressure on oil prices, inflation and financial markets.
A prolonged conflict increases the probability of persistent oil volatility and macro instability.
Key Symbols to Watch
XAUUSD | BTCUSD | USDX | SP500 | USDJPY
Upcoming Events
Date
Currency
Event
Forecast
Previous
Analyst Remarks
Mar 17
AUD
RBA Press Conference
—
—
RBA tone may affect risk sentiment across Asia
Mar 18
CAD
BOC Press Conference
—
—
Guidance on inflation outlook may influence oil-linked currencies
USDJPY near 160 increases intervention sensitivity
Mar 19
GBP
Official Bank Rate
—
—
UK policy outlook may influence GBP volatility
Mar 19
EUR
ECB Press Conference
—
—
ECB commentary may affect EURUSD and USDX direction
For a full view of upcoming economic events, check out VT Markets’ Economic Calendar.
Key Movements Of The Week
Gold (XAUUSD)
XAUUSD continues drifting lower with 4,996.04 acting as the key downside trigger.
Buyers may reappear near 4,842 if geopolitical risk increases.
Bitcoin (BTCUSD)
BTCUSD consolidating below 74,041 resistance.
62,502 remains the last structural defence for bullish momentum.
US Dollar Index (USDX)
USDX completed a five-wave advance.
100.321 remains the next upside target if dollar strength continues.
S&P 500 (SP500)
SP500 erased more than 50% of weekly gains during Friday’s session.
6,517 becomes the key downside trigger for sellers.
USDJPY
USDJPY broke above the 159.45 high, signalling continued yen weakness.
Traders now watch 160.00 as the next psychological level ahead of the BOJ press conference.
Bottom Line
The central market theme this week revolves around the interaction between geopolitics, oil prices and monetary policy. Rising energy prices from the Middle East conflict increase inflation risk just as traders anticipate potential Fed easing.
That tension creates a volatile backdrop for XAUUSD, BTCUSD and SP500, while USDJPY approaches the psychologically important 160 level ahead of the BOJ decision.
Central bank communication from the FOMC and BOJ may therefore determine whether markets stabilise or enter another phase of macro-driven volatility.
Create a live VT Markets account today to access our platform features, including market insights and educational content.
Trader FAQs
Why are oil prices driving markets this week?
Oil sits at the centre of the macro story because the Middle East conflict has turned energy supply risk into an inflation risk. If crude stays elevated, traders may push Fed rate cut expectations further out, which can ripple through XAUUSD, USDX, BTCUSD and SP500.
Why does the Strait of Hormuz matter so much to traders?
The Strait of Hormuz handles a large share of global oil flows, so any threat there can keep crude prices bid. For traders, that means higher inflation pressure, more uncertainty around central bank policy, and wider volatility across commodities, currencies and equities.
How do higher oil prices affect Fed rate cut expectations?
Higher oil prices can keep headline inflation sticky even if broader growth begins to soften. That makes it harder for the Fed to sound dovish, because cutting too soon could risk another inflation push.
Why is XAUUSD under pressure if geopolitical risk is rising?
Gold usually benefits from fear, but it also reacts to the dollar and interest rate expectations. If traders respond to war-driven inflation by buying USDX and pushing back Fed rate cut expectations, XAUUSD can struggle even in a tense geopolitical backdrop.
What is the key level to watch on XAUUSD this week?
The first downside level is 4,996.04. If that gives way, traders may start looking for a deeper move, while 4,842 remains the area where buyers could step back in.
18 March, Sydney, Australia – VT Markets, a leading global multi-asset broker, has been honoured with the prestigious “Best Global Football Sponsor – Newcastle United F.C” and “Best Commercial Spot – Together, Into Tomorrow” awards at the Forex Sports Awards 2026. The double accolades recognise the brand’s high-impact partnership with Newcastle United, celebrating excellence in global brand alignment and fan engagement.
The Forex Sports Awards, organised by Sports Media Gaming Limited, recognise outstanding sports sponsorships within the financial industry. Winners are determined through a comprehensive process involving public voting and an independent panel of industry experts from the sports and media sectors.
The second year of VT Markets’ partnership with Newcastle United as its Official Financial Trading Partner has been marked by the “Together, Into Tomorrow” brand film and a series of successful community initiatives across Asia, including football equipment donations for youth development in Indonesia, Vietnam, and Thailand.” Seeing our synergy with Newcastle United recognised on a global stage is a testament to the strength of our partnership,” said Dandelyn Koh, Head of Global Marketing at VT Markets.”. This recognition belongs to the fans and our clients who have joined us on this journey. We look forward to continuing our mission of empowering the community and bringing the excitement of the game to our audiences worldwide.”
Tis milestone marks a new chapter for VT Markets as the company continues to push the boundaries of what a sports partnership can achieve by delivering tangible value and excitement to sports fans and a wider a global audience.
About VT Markets
VT Markets is a regulated multi-asset broker with a presence in over 160 countries as of today. It has earned numerous international accolades including Best Online Trading and Fastest Growing Broker. In line with its mission to make trading accessible to all, VT Markets offers comprehensive access to over 1,000 financial instruments and clients benefit from a seamless trading experience via its award-winning mobile application.
Please note that the dividends of the following products will be adjusted accordingly. Index dividends will be executed separately through a balance statement directly to your trading account, and the comment will be in the following format “Div & Product Name & Net Volume”.
Please refer to the table below for more details:
The above data is for reference only, please refer to the MT4/MT5 software for specific data.
If you’d like more information, please don’t hesitate to contact info@vtmarkets.com.
To ensure fair trading conditions and manage market volatility during major economic announcements, VT Markets will apply temporary leverage adjustments on certain trading products during specific news periods and market opening/closing.
This mechanism will be introduced in phases starting from 19 March 2026, with full implementation across all servers and clients by 20 March 2026.
These adjustments are designed to protect clients from abnormal market fluctuations, sudden liquidity changes, and extreme price movements that may occur during high-impact news releases.
1. Products Affected
The temporary leverage adjustment may apply to the following products:
• Forex
• Gold
• Silver
• Oil
• Indices
• Commodities (including XPT and XPD)
2. Adjusted Leverage During News Releases and Market Opening/Closing
During the specified news period, maximum leverage will be adjusted as follows:
Forex: 200
Gold: 200
Silver: 50
Oil: 20
Indices: 50
Commodities: 5
Please note that each product with leverage already below the above will not be affected.
3. News Events That Can Trigger the Adjustment
Leverage adjustments may be applied during major economic announcements including:
• FOMC Interest Rate Decisions
• CPI (Consumer Price Index)
• GDP
• PMI / NMI
• PPI
• Retail Sales
• Non-Farm Payroll (NFP)
• ADP Employment Data
• Crude Oil Inventories
The above data is for reference only. Other significant macroeconomic releases from major economies may also be included.
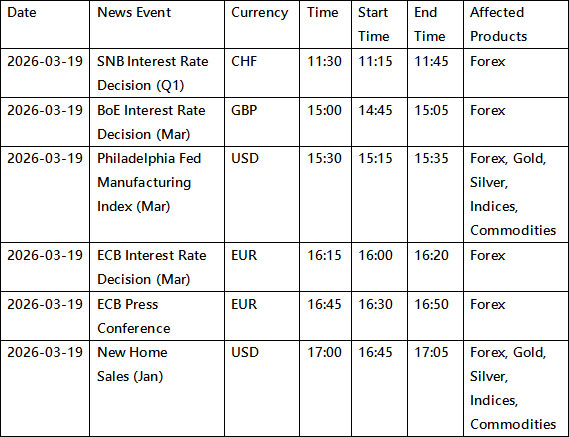
Please refer to the table below for details of the upcoming events and affected instruments:
All dates and times are stated in GMT+3 (MT4/MT5 server time).
4. Affected Period of News Releases and Market Opening/Closing
Temporary leverage adjustments apply during the following periods: Economic News Period
• 15 minutes before the announcement
• 5 minutes after the announcement Market Opening / Closing Period
• 3 hours before the weekly market closing (Friday)
• 30 minutes after market reopening (Monday)
• 30 minutes before daily market closing (Monday – Thursday)
After the above period ends, leverage will automatically return to the original leverage.
5. Important Rules
• The adjustment only affects new positions open during the adjustment period.
• Positions opened before the adjustment period will not be affected.
• Once the adjustment period ends, original leverage will resume automatically.
6. Example Scenarios
Example 1 – Position Opened Before the Adjustment Period
A client opens a Gold position at $3,000 before the news period.
Account leverage: 1:500
Margin required:
3000 × 100 ÷ 500 = $600
Since the position was opened before the news period, the leverage remains unchanged.
Example 2 – Position Opened During the News Period
A client opens a Gold position during the news period.
Leverage is temporarily reduced from 1:500 to 1:200
Margin required:
3000 × 100 ÷ 200 = $1500
Once the news period ends, the leverage setting will revert to the original level.
Example 3 – Product With Lower Default Leverage
A client trades an index product with leverage 1:20.
Since the leverage is already below 1:50, the news-period adjustment does not apply, and margin requirements remain unchanged.
We strongly encourage clients to take these temporary leverage adjustments into account when planning trading strategies during high-impact economic events.
If you have any questions, please contact our support team: info@vtmarkets.com
Please note that the dividends of the following products will be adjusted accordingly. Index dividends will be executed separately through a balance statement directly to your trading account, and the comment will be in the following format “Div & Product Name & Net Volume”.
Please refer to the table below for more details:
The above data is for reference only, please refer to the MT4/MT5 software for specific data.
If you’d like more information, please don’t hesitate to contact info@vtmarkets.com.
To provide you with more diverse trading options, VT Markets will launch 20 new products on 16 March 2026.
You can trade the world’s popular products on MetaTrader 5 with the following specifications:
Friendly reminders:
Please note that following the launch of 24/5 U.S. stock trading, the pre-market trading session for the following 20 stocks will be suspended. This change will take effect on March 16, 2026.
The affected stocks are listed below:
Please refer to the MT5 platforms for the specific swap rate.
The above data is for reference only. Please refer to the MT5 platforms for the latest information.
If you’d like more information, please don’t hesitate to contact info@vtmarkets.com.