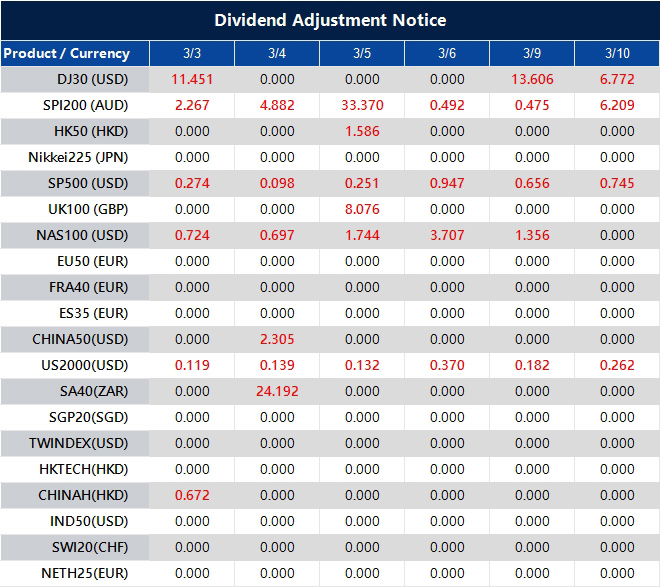
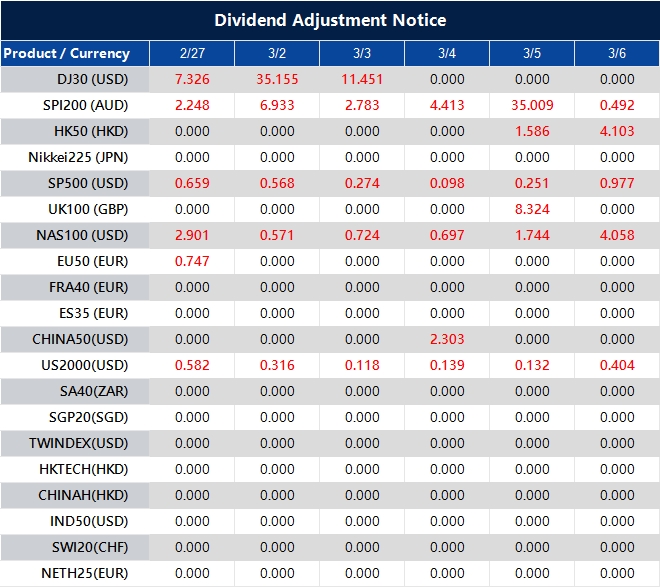
Please note that the dividends of the following products will be adjusted accordingly. Index dividends will be executed separately through a balance statement directly to your trading account, and the comment will be in the following format “Div & Product Name & Net Volume”.
Please refer to the table below for more details:
The above data is for reference only, please refer to the MT4/MT5 software for specific data.
If you’d like more information, please don’t hesitate to contact info@vtmarkets.com.
XAUUSD, USOil, USDX and SP500 enter the week driven by Fed rate cut expectations, with geopolitics adding an inflation shock channel through energy.
Crude oil is holding a massive risk premium at $72–$79/bbl; a breach of $80 could trigger a fast move toward $100 if the Strait of Hormuz remains restricted.
Friday’s Nonfarm Payrolls (NFP) forecast of 58K–60K (down from 130K) creates a dilemma: cooling jobs favour rate cuts, but sticky 0.4% wage growth plus surging oil could force the Fed to stay hawkish.
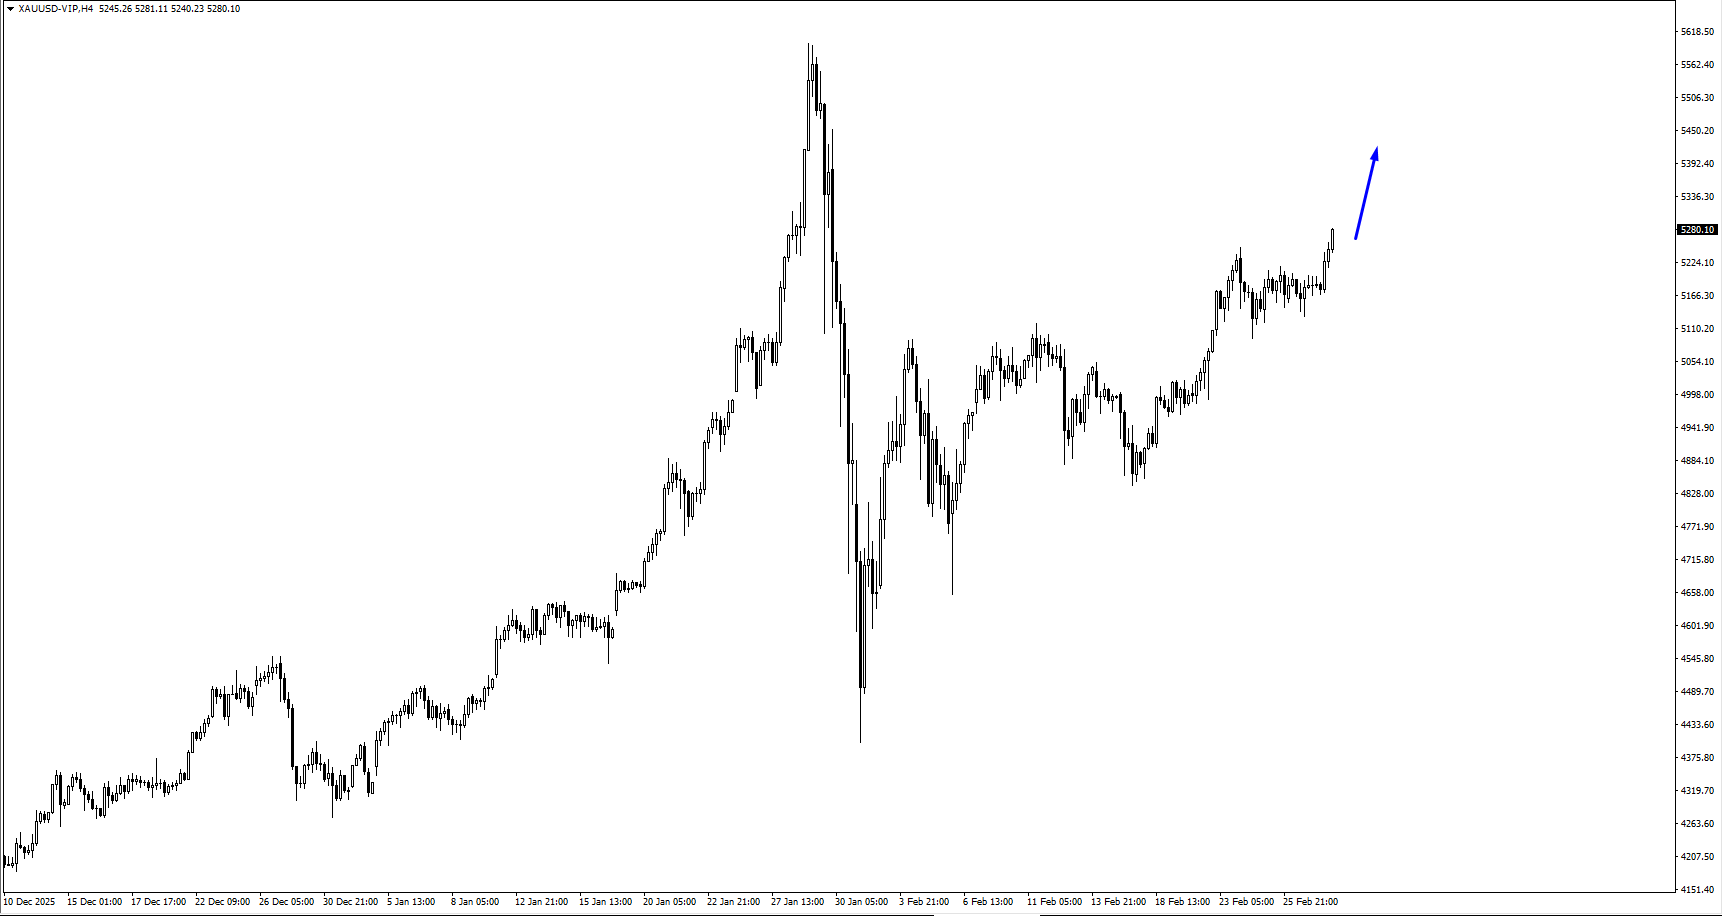
Gold Above $5,300 Amidst Sticky US Data and Safe Haven Demands
The macro backdrop is simple, but it is not comfortable. Traders want weaker labour demand without a fresh inflation pulse. This week’s releases decide whether Fed rate cut expectations gain conviction or drift back into doubt.
The labour market has already shown signs of cooling at the margin. US job openings fell to a more than five-year low in December, which supports the idea that demand for workers has softened. That puts extra weight on Friday’s payrolls and wages mix.
US job openings unexpectedly fell in December to the lowest level since 2020 and layoffs edged up https://t.co/hq05MuUTxp
Markets also keep one eye on inflation timing. Even when CPI is a week away, traders often position early if the jobs report gives them a directional push.
Why it matters: Fed rate cut expectations set the tone for USDX, and USDX tends to steer XAUUSD and risk appetite.
Oil Jumps Over $80 as Hormuz Blockade Fear Escalates
This is the part of the week when the market can feel jumpy. Oil does not need a confirmed supply hit to move. Traders only need to believe disruption risk has risen, and that belief can keep USOil supported for longer than the headlines feel “new”.
Rising oil prices risk delivering a fresh inflation shock to Japan, complicating Prime Minister Sanae Takaichi’s efforts to ease cost-of-living pressures, according to Monex Group’s Jesper Koll https://t.co/1yZ4fMrtHG
A firmer oil price matters because it leaks into inflation expectations and financial conditions. It can also change how traders price Fed rate cut expectations, even if the labour data softens.
Gold reacts differently. XAUUSD trades as insurance. When uncertainty rises, gold often attracts flow even before the data lands. If the dollar stays contained, that support can persist.
The most immediate impact from the escalating Middle East conflict is through market reaction as investors take flight to safe havens such as the dollar and gold, while stocks slump https://t.co/1wMSxKx47N
XAUUSD bid on geopolitics, with 5455 defining extension risk.
XAUUSD may pause if USDX breaks above 98.651 after wages surprise.
XAUUSD reacts hardest to NFP as Fed rate cut expectations reset into next week.
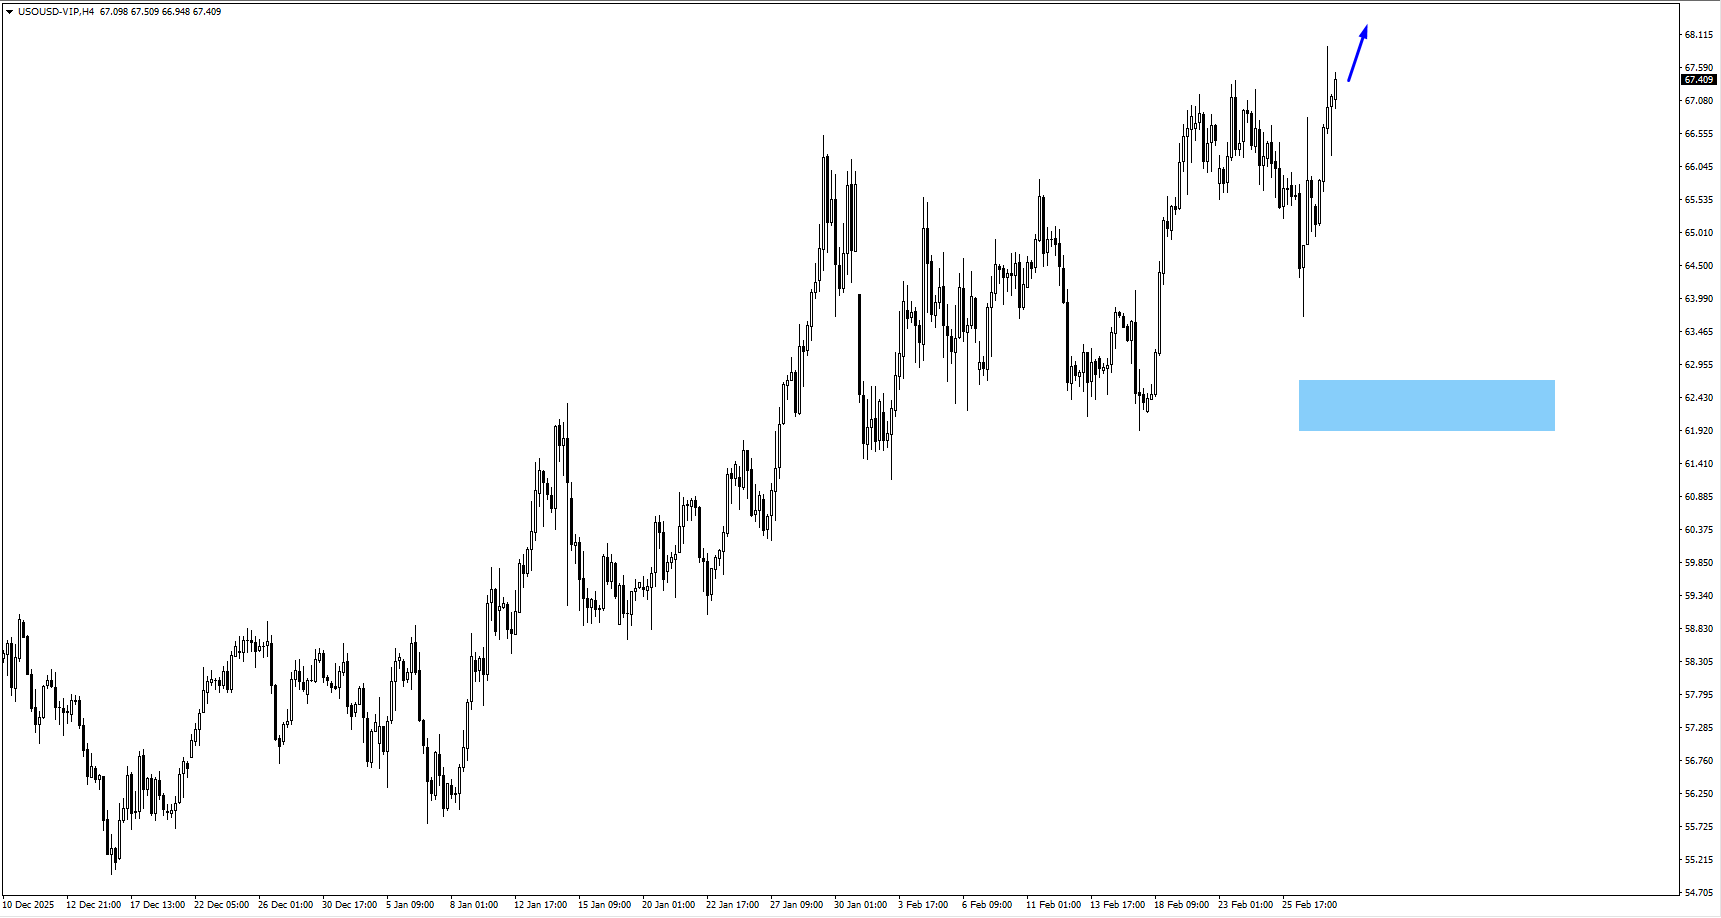
Oil (USOUSD)
USOUSD holds a risk premium, with 71.181 the breakout level on Iran headlines.
USOUSD volatility stays elevated while traders price disruption risk through the Strait of Hormuz.
USOUSD strength can tighten conditions and complicate Fed rate cut expectations into payrolls.
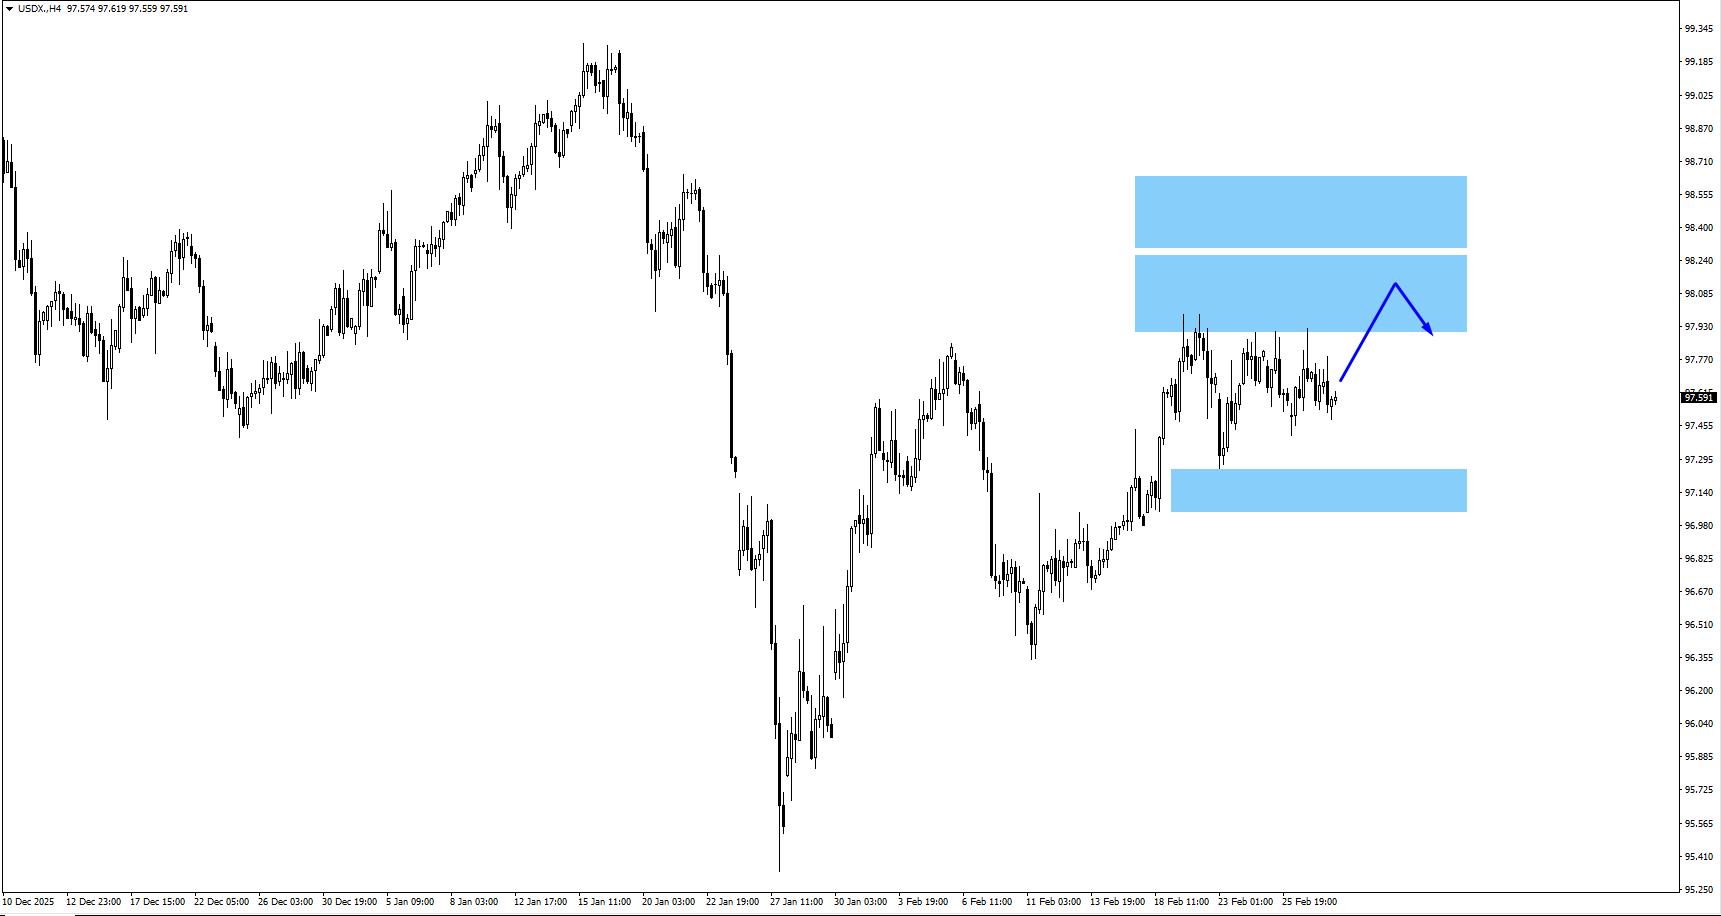
US Dollar Index (USDX)
USDX rejected 98.10 and now ranges, with 98.50 the next area on a push higher.
USDX above 98.651 invalidates bearish setups and can pressure XAUUSD intraday.
USDX direction will follow payrolls and wages as Fed rate cut expectations stay sensitive.
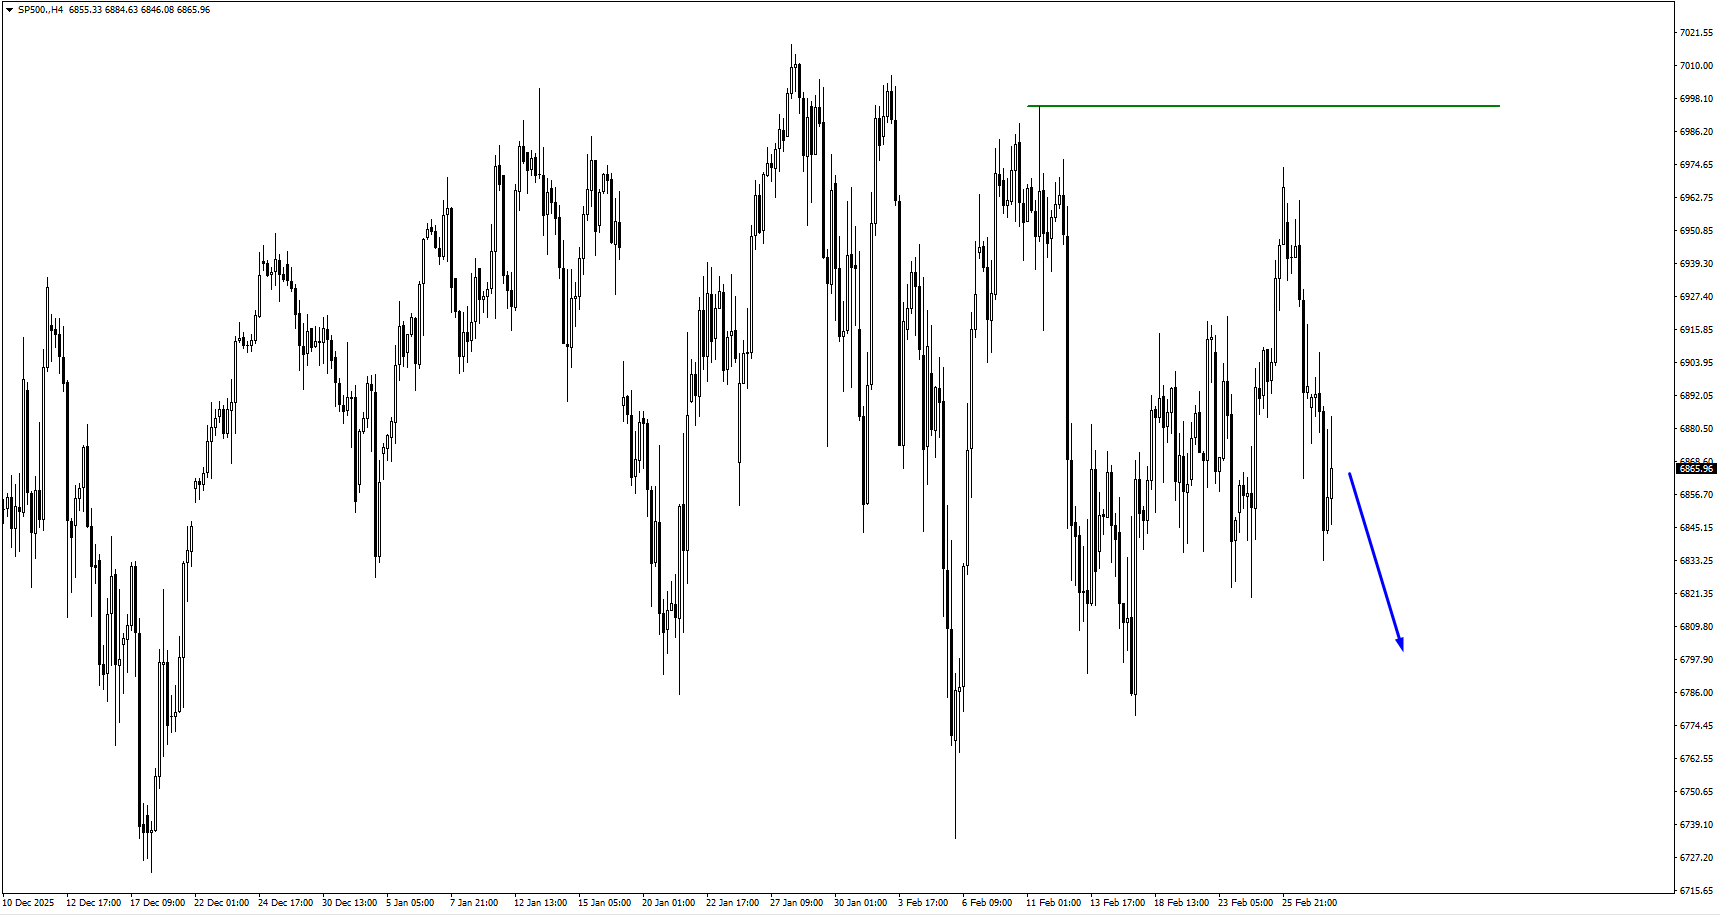
S&P 500 (SP500)
SP500 downside opens if 6777.90 breaks during NFP volatility.
SP500 can struggle if USOil stays bid and the market trims Fed rate cut expectations.
SP500 weakness can keep XAUUSD supported through hedge demand.
Bottom Line
XAUUSD starts the week supported by geopolitics and a market that still wants protection. The next pte cut expectations strengthen after the US jobs report, or whether wages keep the Fed cautious.
Oil is the swing factor. If USOUSD holds a premium, it can keep inflation pressure alive and make the ma timing of the first cut, even if payrolls slow.
Create a live VT Markets account today to access our platform features, including market insights and educational content.
Frequently Asked Questions
1. How does the Iran–US–Israel situation affect gold prices? Rising geopolitical tension usually lifts safe-haven demand, which can support XAUUSD, especially if the US dollar does not surge at the same time.
2. Why is oil so important for Fed rate cut expectations right now? Higher oil prices can feed into inflation expectations, making the Fed more cautious and slowing the path toward rate cuts.
3. Can US Non-Farm Payrolls move gold and the dollar this week? Yes. A softer jobs report and cooler wages can weaken USDX and support XAUUSD, while stronger data can do the opposite.
4. What should traders watch on XAUUSD in the current environment? Traders are watching whether XAUUSD can hold above key support and challenge the 5,455 region, while tracking USDX and US data for confirmation.
5. How does VT Markets’ Week Ahead help traders? VT Markets’ Week Ahead gives a concise view of macro themes, key technical levels, and upcoming events, helping traders plan their positions for the week.
Please note that the dividends of the following products will be adjusted accordingly. Index dividends will be executed separately through a balance statement directly to your trading account, and the comment will be in the following format “Div & Product Name & Net Volume”.
Please refer to the table below for more details:
The above data is for reference only, please refer to the MT4/MT5 software for specific data.
If you’d like more information, please don’t hesitate to contact info@vtmarkets.com.
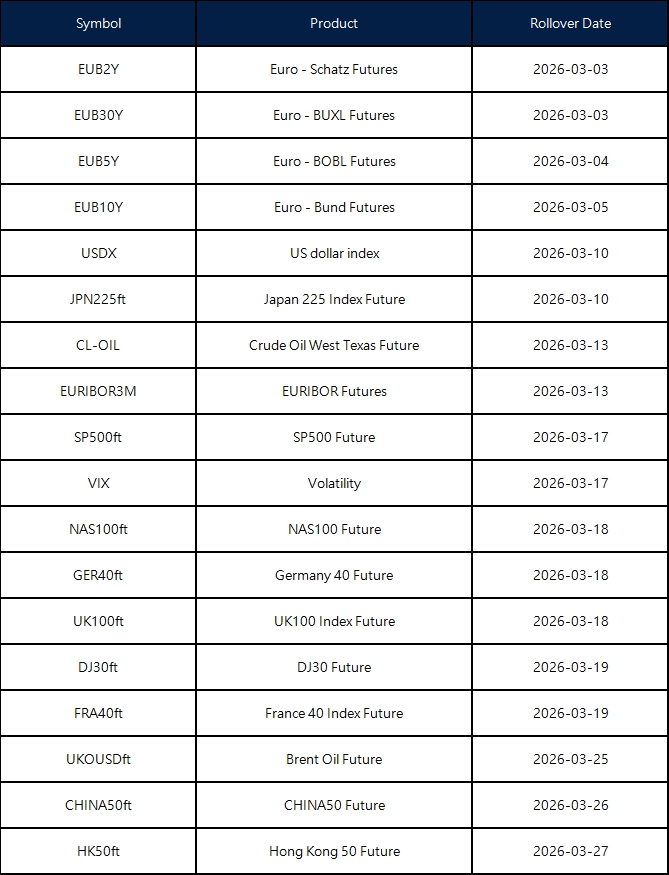
New contracts will automatically be rolled over as follows:
Please note:
• The rollover will be automatic, and any existing open positions will remain open.
• Positions that are open on the expiration date will be adjusted via a rollover charge or credit to reflect the price difference between the expiring and new contracts.
• To avoid CFD rollovers, clients can choose to close any open CFD positions prior to the expiration date.
• Please ensure that all take-profit and stop-loss settings are adjusted before the rollover occurs.
• All internal transfers for accounts under the same name will be prohibited during the first and last 30 minutes of the trading hours on the rollover dates.
The above data is for reference only. The actual rollover date shall be subject to the Liquidity Provider’s determination.
If you’d like more information, please don’t hesitate to contact info@vtmarkets.com.
Written on February 28, 2026 at 3:13 am, by anakin
As part of our commitment to provide the most reliable service to our clients, there will be maintenance this weekend.
Maintenance Details:
Please note that the following aspects might be affected during the maintenance:
1. The price quote and trading management will be temporarily disabled during the maintenance. You will not be able to open new positions, close open positions, or make any adjustments to the trades.
2. There might be a gap between the original price and the price after maintenance. The gaps between Pending Orders, Stop Loss, and Take Profit will be filled at the market price once the maintenance is completed. It is suggested that you manage the account properly.
3. During the maintenance period, VT Markets APP will not be available. It is recommended that you avoid using it during the maintenance.
The above data is for reference only. Please refer to the MT4/MT5 software for the specific maintenance completion and marketing opening time.
Thank you for your patience and understanding about this important initiative.
If you’d like more information, please don’t hesitate to contact info@vtmarkets.com.
Written on February 27, 2026 at 10:03 am, by anakin
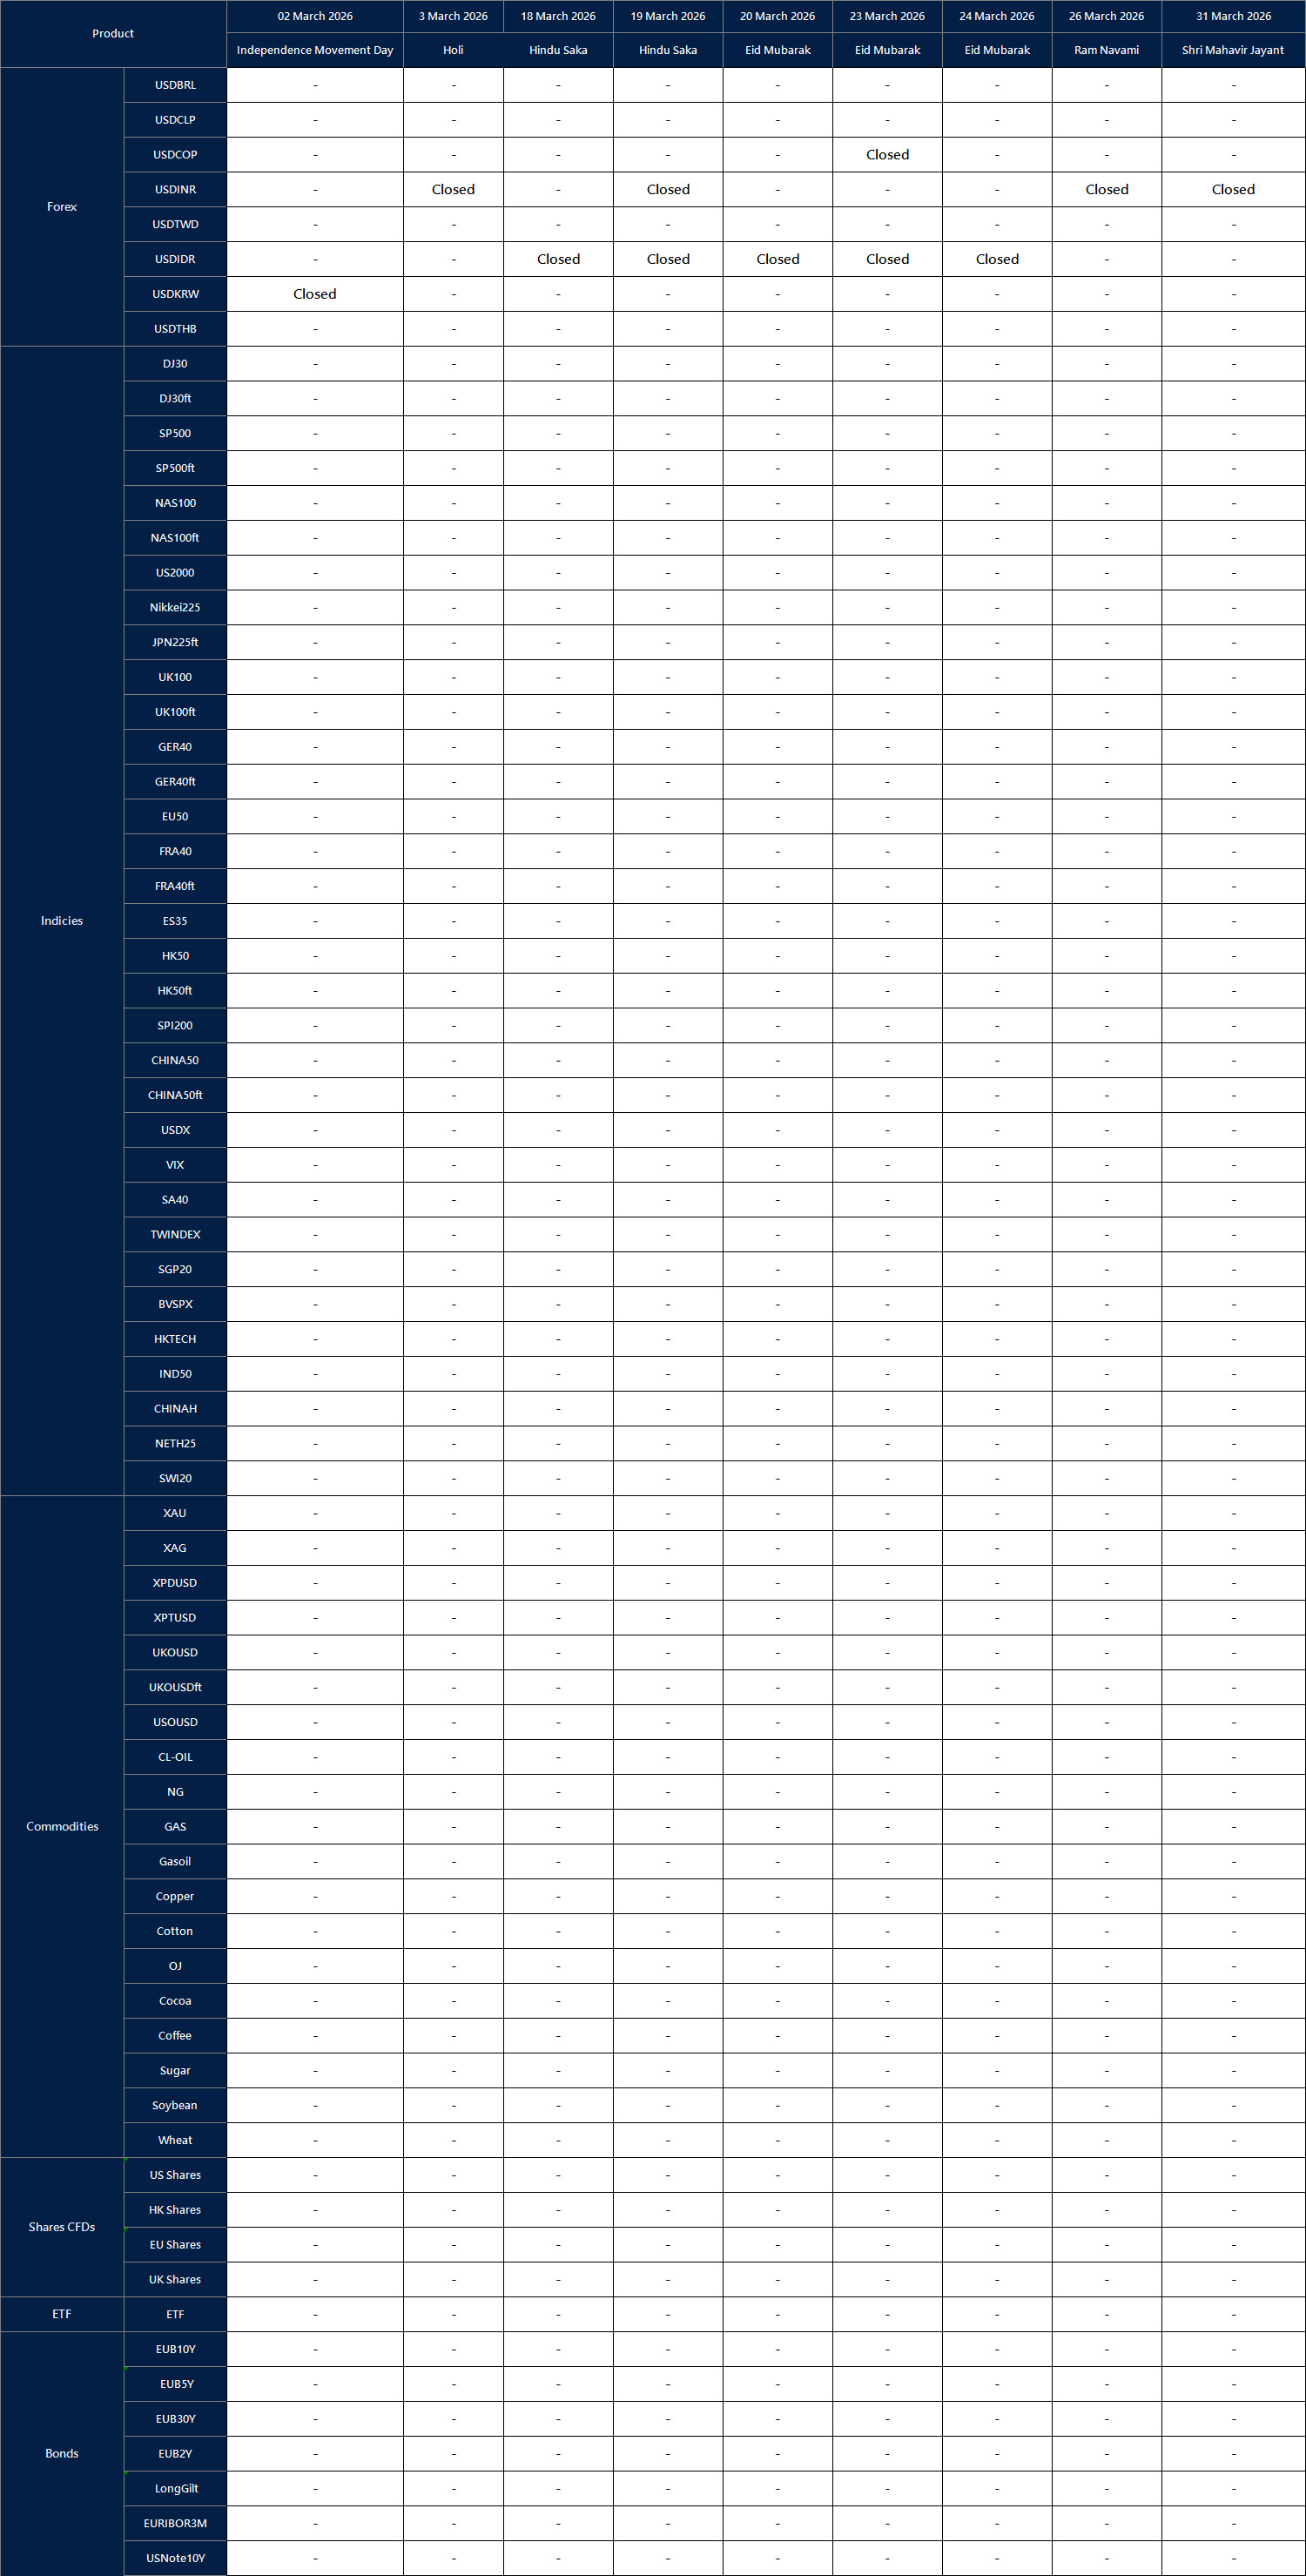
Affected by international holidays, the trading hours of some VT Markets products will be adjusted. Please check the following link for the affected products:
Please note that the dividends of the following products will be adjusted accordingly. Index dividends will be executed separately through a balance statement directly to your trading account, and the comment will be in the following format “Div & Product Name & Net Volume”.
Please refer to the table below for more details:
The above data is for reference only, please refer to the MT4/MT5 software for specific data.
If you’d like more information, please don’t hesitate to contact info@vtmarkets.com.
Written on February 27, 2026 at 8:57 am, by anakin
Ho Chi Minh City, Vietnam – 26 February 2026 – VT Markets has successfully completed a community initiative in Vietnam, donating 100 official Newcastle United Football Club (NUFC) footballs to local youth groups in partnership with a youth-focused non-profit organisation named Liên Đoàn Hướng Đạo Nguyễn Trãi.
The initiative reflects the company’s expanding commitment to community development across Asia and forms part of a broader CSR line-up unveiled during its July 2025 event.
Designed to strengthen youth engagement, the donation provides students with quality equipment to support physical education and grassroots football development, helping create a more inspiring and inclusive sporting environment.
In collaboration with Liên Đoàn Hướng Đạo Nguyễn Trãi, footballs were distributed directly to selected communities, ensuring access to students who stand to benefit most from enhanced sporting resources. By supporting grassroots participation, the programme aims to create a more inclusive environment where young people can develop confidence, build friendships, and stay actively engaged in their communities.
“Sport has the power to inspire discipline, teamwork, and resilience – values that extend far beyond the pitch. Through this initiative, we hope to contribute meaningfully to youth development and community growth in Vietnam”, Dandelyn Koh, Head of Global Marketing at VT Markets said.
In recent months, the company has intensified its regional engagement through a series of on-the-ground initiatives, including beach clean-up campaigns and flood relief pack donations aimed at supporting vulnerable communities. With programmes already planned for the new year, VT Markets remains dedicated to deepening its local footprint, reinforcing its role not only as a global financial partner but also as a responsible and proactive community stakeholder.
About VT Markets
VT Markets is a regulated multi-asset broker with a presence in over 160 countries as of today. It has earned numerous international accolades including Best Online Trading and Fastest Growing Broker. In line with its mission to make trading accessible to all, VT Markets offers comprehensive access to over 1,000 financial instruments and clients benefit from a seamless trading experience via its award-winning mobile application.
Please note that the dividends of the following products will be adjusted accordingly. Index dividends will be executed separately through a balance statement directly to your trading account, and the comment will be in the following format “Div & Product Name & Net Volume”.
Please refer to the table below for more details:
The above data is for reference only, please refer to the MT4/MT5 software for specific data.
If you’d like more information, please don’t hesitate to contact info@vtmarkets.com.
Written on February 26, 2026 at 7:51 am, by anakin
Please note that the dividends of the following products will be adjusted accordingly. Index dividends will be executed separately through a balance statement directly to your trading account, and the comment will be in the following format “Div & Product Name & Net Volume”.
Please refer to the table below for more details:
The above data is for reference only, please refer to the MT4/MT5 software for specific data.
If you’d like more information, please don’t hesitate to contact info@vtmarkets.com.
Written on February 25, 2026 at 9:36 am, by anakin


