To provide our valued clients with an enhanced trading environment, VT Markets will adjust certain trading conditions for STP account on February 26, 2024:
STP Account
Original
Adjusted
Stop-Out Margin Level
50%
20%
Margin Call Level
80%
50%
Friendly reminder:
1. All account settings stay the same except for the above adjustments.
If you’d like more information, please don’t hesitate to contact info@vtmarkets.com.
Written on February 20, 2024 at 9:36 am, by anakin
Disclaimer: This article is for informational purposes only and should not be considered as financial advice. Investment decisions should be made based on your own research and risk assessment.
A Complete Review For Adobe Inc. in 2024
Adobe Inc. (ADBE) is a leading software company that has been a staple in the tech industry for decades. With its innovative products and strong financials, Adobe is a stock that investors should keep an eye on in 2024.
Company Snapshot:
Adobe Inc. is a renowned software company specializing in digital media and marketing software. With its establishment in 1982, Adobe has emerged as one of the largest and most diversified software companies worldwide.
Over the years, Adobe has made significant progress by expanding its product offerings and enhancing its customer experience.
In 2023, Adobe achieved a record revenue of $19.41 billion, representing 10% year-on-year growth. Adobe’s recent acquisition of Figma is expected to further strengthen its position in the market.
Financial Performance:
Adobe has demonstrated impressive financial performance in recent years. In the fourth quarter of 2023, the company achieved a remarkable revenue of $5.05 billion, indicating a 12% year-on-year growth.
Additionally, Adobe’s net income stood at $1.96 billion, while its cash flows from operations amounted to $1.60 billion. These robust financials underscore Adobe’s capacity to innovate and adapt to evolving market conditions.
Investment Potential:
Investing in Adobe presents a compelling opportunity for several reasons.
Firstly, the company boasts a diverse product portfolio encompassing digital media and marketing software. This diversification is a risk mitigation strategy against market volatility and industry-specific challenges.
Secondly, Adobe enjoys a strong competitive advantage derived from its innovative products and well-established brand recognition. These factors contribute to its continued success and market leadership.
Lastly, Adobe’s recent acquisition of Figma is poised to further enhance its market position. This strategic move fortifies Adobe’s competitive edge, making it an attractive investment option for those seeking to invest in the dynamic tech industry.
Risks and Considerations:
While Adobe is a strong investment opportunity, there are some risks and considerations that investors should be aware of.
First, Adobe operates in a highly competitive market, which could impact its market share and profitability.
Second, Adobe’s financial performance is subject to market volatility and other macroeconomic factors.
Finally, investors should consider diversifying their portfolio to mitigate risks associated with investing in a single stock.
Adobe Inc. is a strong investment opportunity for investors looking to invest in the tech industry. With its diverse product portfolio, strong financials, and innovative products, Adobe is well-positioned to continue its growth trajectory in 2024 and beyond.
However, investors should be aware of the risks associated with investing in a single stock and should consider diversifying their portfolio accordingly.
Trade Adobe with VT Markets
To explore Adobe Inc.’s potential further and consider diversifying your investment portfolio, VT Markets offers an innovative platform for trading Shares CFDs. With VT Markets, you can leverage Adobe’s market movements and gain exposure to a wide array of other stocks, offering a strategic blend of opportunities in the tech industry and beyond.
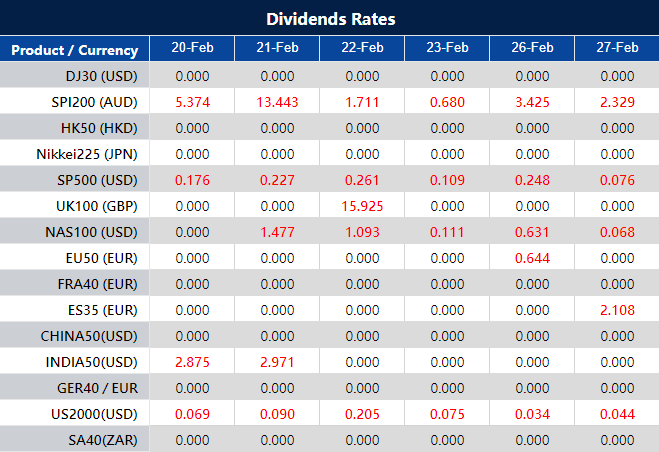
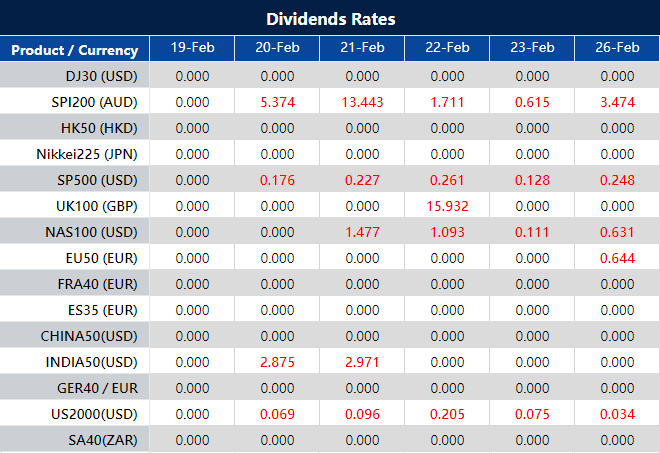
Please note that the dividends of the following products will be adjusted accordingly. Index dividends will be executed separately through a balance statement directly to your trading account, and the comment will be in the following format “Div & Product Name & Net Volume ”.
Please refer to the table below for more details:
The above data is for reference only, please refer to the MT4/MT5 software for specific data.
If you’d like more information, please don’t hesitate to contact info@vtmarkets.com.
Written on February 20, 2024 at 7:19 am, by anakin
With U.S. markets closed in observance of Presidents Day, global financial markets took center stage, showcasing mixed sentiments across different regions and sectors. Europe’s Stoxx 600 index saw a modest rebound, while Asian markets presented a mixed picture, influenced by the People’s Bank of China’s policy decisions and optimistic travel data from China. Meanwhile, the currency and commodity markets remained relatively stable, with minor movements in major currency pairs and commodities like gold seeing a slight rise. Key economic events, including policy decisions from the Reserve Bank of Australia and the People’s Bank of China, along with Canada’s CPI report, are highly anticipated by investors, potentially setting the tone for future market movements.
Stock Market Updates
The U.S. markets were closed on Monday in observance of Presidents Day, leading to a day where international markets garnered more attention. In Europe, the Stoxx 600 index managed a modest recovery, ending the day by 0.17%, a slight rebound from its negative performance in the morning session. Sector-wise, there was a mixed picture; mining stocks experienced a downturn, dropping by 1%, whereas healthcare stocks moved in the opposite direction, recording a gain of 0.95%. This divergence highlights the varied investor sentiments across different sectors within the European stock market landscape.
In company-specific news, shares of the Swiss software firm Temenos saw an impressive jump of 8.8%, bouncing back from the significant losses it suffered following a negative report from Hindenburg Research. On the other side of the globe, in the Asia-Pacific region, the stock market outcomes were mixed. Chinese markets showed optimism as traders returned from the Lunar New Year holidays, encouraged by promising travel data, while the Hong Kong stock market faced a downturn. The monetary policy stance of the People’s Bank of China, which held a key policy rate steady, also played a crucial role in shaping market expectations, especially in a global context where the timing of the U.S. Federal Reserve’s policy easing remains a focal point of speculation.
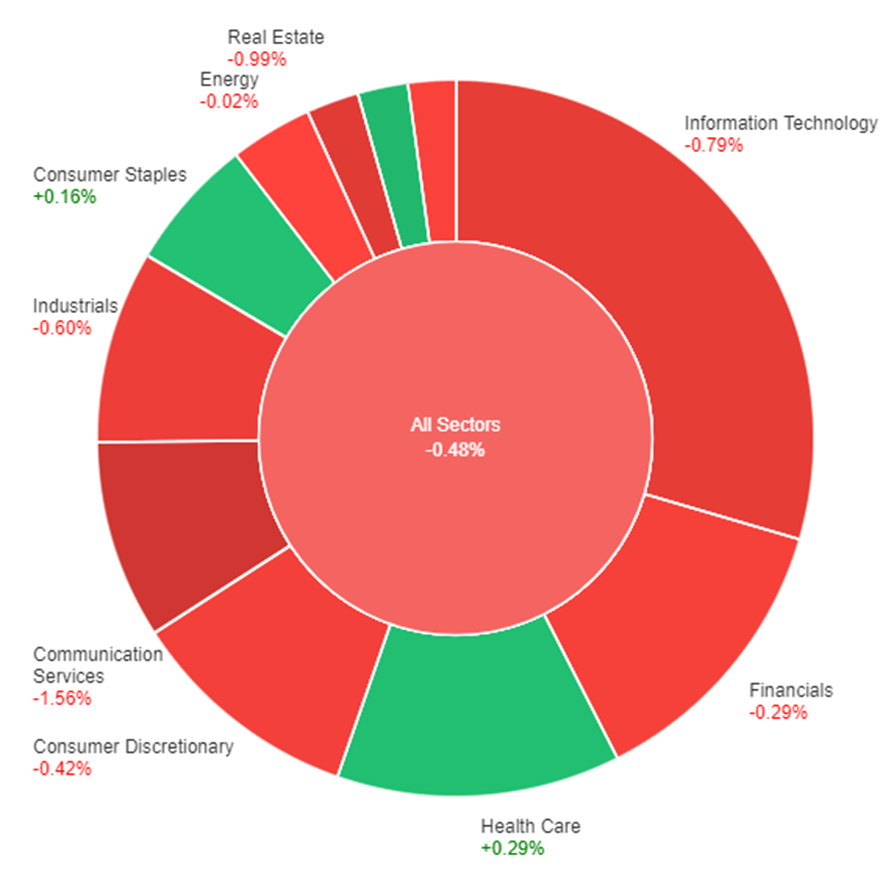
On Friday, the overall market saw a slight downturn, closing down by 0.48%. Despite the general negative sentiment, some sectors managed to post gains, with Materials leading the way with a 0.51% increase, followed by Health Care and Consumer Staples, which rose by 0.29% and 0.16%, respectively. On the flip side, the Communication Services sector faced the steepest decline at -1.56%, and Real Estate and Information Technology also experienced significant losses, dropping by -0.99% and -0.79% respectively. Other sectors such as Energy and Utilities saw marginal decreases, while Financials, Consumer Discretionary, and Industrials also ended the day in the red, highlighting a mixed but overall bearish performance across the market. Adding to the context, the US market was closed on Monday, suggesting that these movements were the last recorded before a day of inactivity in the trading sessions.
Currency Market Updates
In the recent currency market updates, major currency pairs have shown minimal movement, adhering to their familiar trading ranges, influenced by the holiday closures in the United States and Canada. Despite this lull, a cautious optimism permeated the financial markets, reflected in the performance of some European and Japanese stock indexes as they neared record highs. The Euro to US Dollar (EUR/USD) exchange rate remained just below the 1.0800 mark, while the British Pound to US Dollar (GBP/USD) hovered around 1.2600. The GBP gained momentum during the European trading session, although it saw a slight retreat before the day’s end. Meanwhile, the US Dollar saw modest gains against traditionally safe-haven currencies such as the Swiss Franc (CHF) and the Japanese Yen (JPY), hinting at a buoyant mood within the financial markets.
On the commodity front, the Australian Dollar recorded a slight increase against the US Dollar, with the AUD/USD pair trading near 0.6540. In contrast, the Canadian Dollar depreciated against its US counterpart, approaching the 1.3500 level. These movements come ahead of significant macroeconomic events slated for early this week. The Reserve Bank of Australia (RBA) is expected to release its Meeting Minutes, which market participants will scrutinize for indications on future monetary policy, especially concerning inflation control and rate adjustments. Additionally, the People’s Bank of China (PBoC) is set to announce its decision on interest rates, specifically the Loan Prime Rate (LPR), which could influence global financial sentiments. Meanwhile, Canada’s upcoming Consumer Price Index (CPI) report for January is anticipated to show a 0.4% month-over-month increase, potentially impacting the CAD’s performance. Furthermore, spot Gold has seen a rise for three consecutive days, briefly surpassing the $2,020.00 mark, adding another layer of complexity to the market dynamics as investors await these critical economic updates.
Picks of the Day Analysis
EUR/USD (4 Hours)
EUR/USD Sees Limited Movement Amid Quiet Macro Calendar and Mixed Market Sentiment
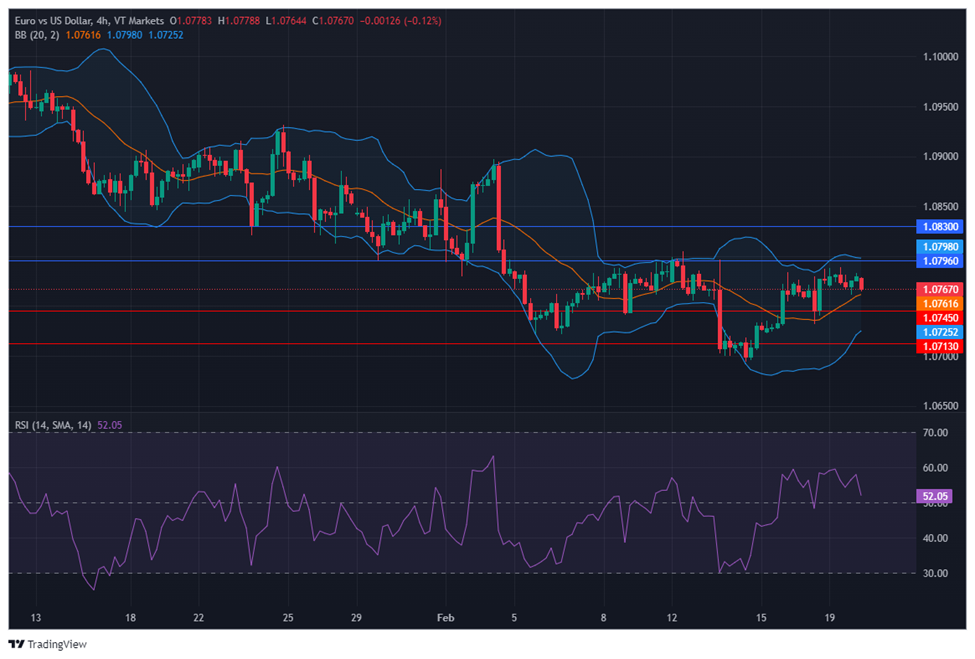
On Monday, the EUR/USD pair experienced limited investor engagement, ending the day with slight gains in the 1.0780 area, amidst a narrow trading range. The lack of significant macroeconomic data and the closure of US and Canadian markets contributed to the subdued activity. While the US dollar showed general weakness against a backdrop of mixed stock market performances, optimism in some Asian and European stock indexes did not translate into a clear direction for FX traders. The Euro’s muted response followed the Deutsche Bundesbank’s report suggesting a recession in Germany, attributed to weak demand and cautious investment. Looking ahead, a light macroeconomic calendar and anticipation for the Federal Open Market Committee (FOMC) meeting minutes release are likely to influence future trading dynamics, with the market seeking clues on monetary policy amidst recent inflation developments.
On Monday, the EUR/USD moved in consolidation, fluctuating between the middle and upper bands of the Bollinger Bands. Currently, the price is moving slightly above the middle band, suggesting a potential slight upward movement to reach above the upper band. Notably, the Relative Strength Index (RSI) maintains its position at 52, signaling a neutral outlook for this currency pair.
Resistance: 1.0796, 1.0830
Support: 1.0745, 1.0713
XAU/USD (4 Hours)
XAU/USD Gains Amidst Dollar Weakness and Mixed Market Sentiments
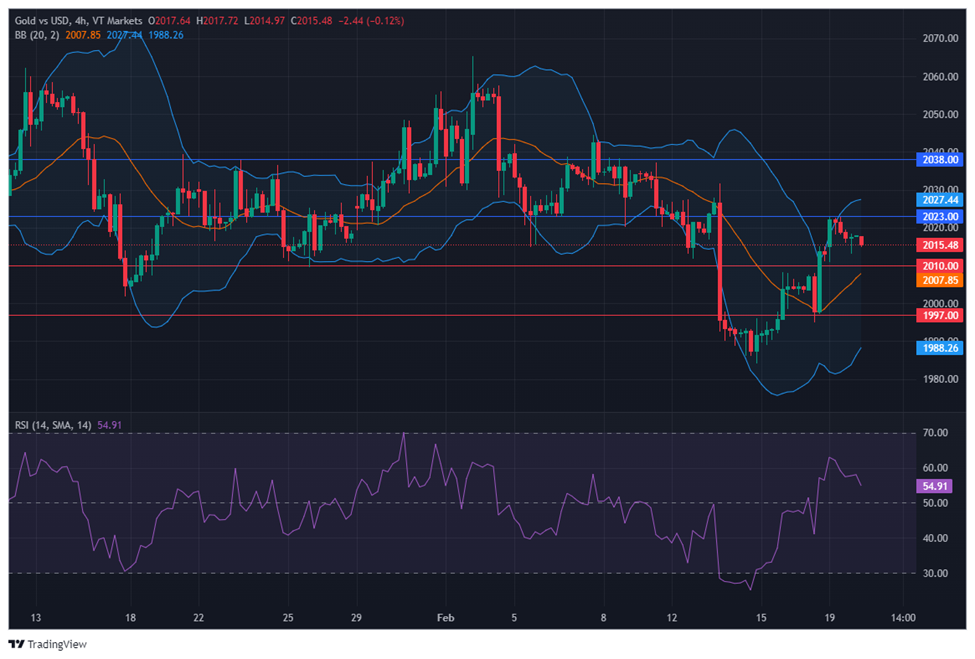
In Monday’s trading session, Gold (XAU/USD) saw an uptick, advancing to $2,023.04 a troy ounce in the first half, driven by a diminishing demand for the US Dollar before settling around $2,016 after the Dollar regained some strength. The broader financial markets experienced subdued volatility, attributed to holidays in Canada and the US, and a light macroeconomic calendar. Despite this, Asian and European markets offered mixed signals, with Chinese stocks gaining post-holiday and the Nikkei 225 nearing record highs before closing lower. European markets ended mixed but close to record levels. The financial landscape is currently absorbing recent US inflation data, which exceeded expectations, reducing the likelihood of an imminent rate cut by the Fed, with markets eagerly awaiting the upcoming FOMC Meeting Minutes for further direction.
On Monday, XAU/USD moved lower after reaching the upper band of the Bollinger Bands. Currently, the price is moving between the upper and middle bands, suggesting a potential downward movement toward the middle band. The Relative Strength Index (RSI) stands at 54, signaling a neutral outlook for this pair.
Resistance: $2,023, $2,038
Support: $2,010, $1,997
Economic Data
Currency
Data
Time (GMT + 8)
Forecast
AUD
Monetary Policy Meeting Minutes
08:30
CAD
Consumer Price Index m/m
21:30
0.4%
Written on February 20, 2024 at 1:25 am, by anakin
In gold trading, managing risk is as crucial as seeking profit. For newcomers and seasoned traders alike, understanding and effectively utilizing risk management tools can be the difference between success and setbacks.
Today, let’s explore some key techniques and tools, particularly focusing on stop-loss and stop-limit orders, providing clear examples to enhance your trading strategy.
Understanding Stop-Loss and Stop-Limit Orders
At its core, gold trading involves navigating a market that can be as volatile as it is lucrative. This is where risk management tools like stop-loss and stop-limit orders come into play, acting as essential safeguards to protect your investments.
Stop-Loss Orders: Your Safety Net
A stop-loss order is an order placed with a broker to buy or sell once the gold reaches a certain price. It’s designed to limit an investor’s loss on a position.
For instance, let’s say you buy gold at $1,800 per ounce. You could set a stop-loss order at $1,750. If the price dips to this level, the stop-loss order becomes a market order, and your position is sold at the next available price, thus preventing further loss.
Stop-Limit Orders: Precision in Exiting
A stop-limit order combines the features of a stop-loss order with those of a limit order. It has two prices: the stop price, which converts the order into a sell order, and the limit price, which specifies the lowest price you’re willing to accept.
For example, if you set a stop price at $1,750 and a limit price at $1,740 for your gold, once the price falls to $1,750, the order becomes active, but it will only execute at $1,740 or better.
Understanding the Difference
While both stop-loss and stop-limit orders are pivotal in managing risks, they function differently under market conditions.
A stop-loss order ensures the execution of the order, albeit without guaranteeing the price. Conversely, a stop-limit order guarantees the price but not the execution.
Example of Stop-Loss Order:
Imagine you own gold that you purchased at $1,800 per ounce. You place a stop-loss order at $1,760. If the gold price falls to $1,760, your order is automatically executed at the prevailing market price, which could be slightly less than $1,760, depending on market conditions.
Example of Stop-Limit Order:
In contrast, suppose you set a stop-limit order with a stop price at $1,760 and a limit price at $1,750. If the gold price falls to $1,760, your order is activated, but it will only be executed if the price stays above $1,750. If the gold price plummets below $1,750 before your order can be filled, it may not be executed at all.
Best Practices for Using Stop-Loss and Stop-Limit Orders
Understanding how these orders work and employing them correctly can significantly enhance trading outcomes and provide greater control over investment portfolios. Here’s how they work:
Evaluate Market Conditions:
Before setting these orders, assess the market’s volatility. In highly volatile markets, a stop-loss order might be more suitable to ensure execution.
Regularly Update Orders:
As market conditions change, adjust your stop-loss and stop-limit orders accordingly to protect profits or limit losses.
Understand Your Risk Tolerance:
Decide how much you are willing to lose and set your orders based on your personal risk tolerance.
Ready to put these tools to the test without any financial risk? Sign up for a risk-free gold trading demo account today!
It’s the perfect opportunity to experiment with stop-loss and stop-limit orders, get a feel for the market, and build your confidence.
Enhance Your Gold Trading with VT Markets
Ready to put these risk management tools into practice? Open a VT Markets demo account today and start trading without any financial risk. Experiment with stop-loss and stop-limit orders, understand market dynamics, and build your confidence. Join VT Markets now and take the first step towards mastering gold trading!
Written on February 19, 2024 at 8:44 am, by anakin
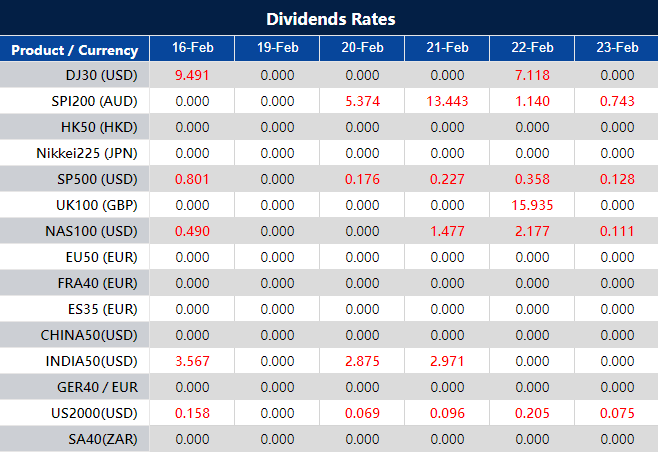
Please note that the dividends of the following products will be adjusted accordingly. Index dividends will be executed separately through a balance statement directly to your trading account, and the comment will be in the following format “Div & Product Name & Net Volume ”.
Please refer to the table below for more details:
The above data is for reference only, please refer to the MT4/MT5 software for specific data.
If you’d like more information, please don’t hesitate to contact info@vtmarkets.com.
Written on February 19, 2024 at 7:15 am, by anakin
As we delve into the economic calendar for the upcoming week, several pivotal events and data releases promise to provide insight into the global economic landscape. From inflation figures to central bank deliberations and purchasing managers’ indices (PMIs), market participants will keenly watch these developments for signals regarding the direction of key economies. Here’s what to expect in the week ahead:
February 20, 2024: Canadian Inflation Rate
Canada’s annual inflation rate surged to 3.4% in December 2023, surpassing expectations and underscoring the persistent pressures on prices. The Bank of Canada had anticipated such an uptick, aligning with its outlook on inflation. Analysts now await the release of January 2024 data, scheduled for February 20, with expectations of a slight moderation to 3.2%.
February 21, 2024: Australia Wage Price Index
In Australia, the wage price index witnessed robust growth, reaching 4.0% year-on-year in Q3 2023, the highest level since Q1 2009. As data for Q4 2023 is set for release on February 21, analysts anticipate another uptick to 4.1%, indicative of sustained wage pressures.
February 22, 2024: FOMC Meeting Minutes
The minutes from the Federal Open Market Committee (FOMC) meeting in January 2024 will be scrutinized for insights into the Federal Reserve’s monetary policy stance. Despite maintaining the Fed funds rate at a 23-year peak of 5.25%-5.5% for the fourth consecutive meeting, Chair Powell hinted at the possibility of a rate reduction later in the year. However, the decision remains contingent upon evolving economic conditions, suggesting a cautious approach to policy adjustments.
February 22, 2024: Flash Manufacturing PMI
On the same day, flash manufacturing PMI figures for Germany, the UK, and the US will provide a snapshot of industrial activity. In January 2024, while Germany recorded a PMI of 45.5, the UK and the US posted figures of 47 and 50.7, respectively. Analysts anticipate slight improvements in the January 24, 2024, readings, with forecasts at 46.1 for Germany, 47.5 for the UK, and 50.1 for the US.
February 22, 2024: Flash Services PMI
Simultaneously, attention will be on the flash services PMI for the same countries. In January 2024, Germany witnessed a decline to 47.7, while the UK and the US saw expansions to 54.3 and 52.5, respectively. Projections for February 22, 2024, point to readings of 48 for Germany, 54.5 for the UK, and 52 for the US.
As markets await these critical releases and events, investors and analysts alike remain vigilant, poised to interpret the data and its implications for economic trajectories and financial markets. The week ahead promises to offer valuable insights into the ongoing dynamics shaping the global economy.
Written on February 19, 2024 at 1:49 am, by anakin
Navigating Inflation with Effective Forex Trading Strategies
Hyper-inflation source: The Wall Street Journal
Imagine a time when a loaf of bread cost just a few cents, and a gallon of gas was a pocket-change purchase. Now, fast forward to today, where those same items can often dent our wallets significantly.
This gradual increase in the price of goods and services over time is what economists term as inflation. It is a phenomenon that has been shaping economies and markets for centuries, and understanding its nuances is crucial for anyone looking to thrive in the world of forex trading.
Understanding inflation
Inflation, often dubbed the silent thief of purchasing power, is a widespread economic phenomenon impacting individuals, businesses, and entire nations.
At its core, it denotes a sustained increase in the general price level of goods and services over time, resulting in a gradual rise in the cost of living and a decrease in the purchasing power of currency.
While moderate inflation is deemed a natural aspect of healthy economic growth, excessive inflation can undermine purchasing power, disrupt economic stability, and impede long-term prosperity.
Understanding the drivers behind inflation is crucial. They include:
Demand-pull inflation: results from demand exceeding supply due to factors like consumer spending and policy changes.
Cost-push inflation: arises from increased production costs passed on to consumers.
Monetary factors: central bank actions, such as interest rate adjustments, impacting inflation.
Supply chain disruptions: global issues causing shortages and price hikes.
Expectations and psychology: influence behaviour, affecting inflation outcomes.
Types of inflation source: Oscar Education
Types of inflation
Inflation manifests in various forms, each with distinct characteristics and underlying causes:
1. Creeping inflation: Characterised by a slow and gradual rise in prices, creeping inflation is typically associated with stable economic conditions and moderate inflation rates.
2. Walking inflation: Walking inflation refers to a slightly faster pace of price increases compared to creeping inflation but remains manageable and does not pose significant economic risks.
3. Galloping inflation: Galloping inflation represents a rapid acceleration in price levels, often reaching double-digit or triple-digit inflation rates. It can erode purchasing power rapidly, disrupt economic stability, and undermine confidence in the currency.
4. Hyperinflation: Hyperinflation is the most extreme form of inflation, characterised by astronomical inflation rates, often exceeding 50% per month. It results in the complete breakdown of the monetary system, rendering the currency worthless and causing severe social and economic upheaval.
How inflation affects currency values
Understanding how inflation affects currency values is essential for forex traders.
Purchasing power of the US Dollar source: Visual Capitalist
As inflation rises, a currency’s value typically decreases due to the erosion of its purchasing power. This decreased attractiveness prompts investors to seek higher returns, leading to a decline in the currency’s value.
Conversely, currencies from nations with low inflation or stable prices often see increased demand, which strengthens their value against others.
However, this relationship is not always straightforward, as a range of factors like interest rates, economic growth prospects, geopolitical events, and market sentiment can also influence exchange rates.
Role of Central Banks in managing inflation
Central banks play a vital role in managing inflation through monetary policy tools like interest rates, open market operations, and forward guidance.
Inflation targeting frameworks, where central banks set explicit targets, are widespread in many countries.
US Fed inflation targeting vs real inflation rate source: The Real Economy Blog
For forex traders, monitoring central bank decisions is crucial; using tools like the Economic calendar helps anticipate and react to actions swiftly.
Hawkish policies, like interest rate hikes, strengthen a currency, while dovish measures, aiming to stimulate growth, may lead to depreciation as investors seek higher returns elsewhere.
Indicators and metrics to monitor inflation
Inflation serves as a vital gauge of economic health, influencing policy decisions and investment strategies.
US inflation indicators source: Euromonitor
Consumer Price Index (CPI)
CPI tracks changes in household goods and services prices, indicating consumer inflation. Higher CPI signals rising inflationary pressures, potentially leading to currency depreciation.
Producer Price Index (PPI)
PPI tracks changes in producer prices, reflecting upstream inflation trends. Rising production costs may translate into consumer price hikes and inflationary pressures.
Core vs Headline Inflation
Core inflation excludes volatile items like food and energy, offering a stable measure of underlying inflation trends. Comparing core to headline inflation helps filter out temporary fluctuations.
Other Economic Indicators
Monitoring unemployment rates and GDP (Gross Domestic Product) growth provides insights into inflationary pressures and broader economic conditions. High unemployment may dampen wage pressures and inflation, while strong GDP growth may signal inflationary tendencies.
By analysing these indicators, forex traders gain a comprehensive view of inflation trends and their impact on currency values.
Strategies for Trading in an Inflationary Environment
Adapting to inflationary shifts in the forex market requires strategic manoeuvres. Here are concise strategies for traders:
Stay informed about inflation across economies, analysing data releases and central bank announcements for accurate trend anticipation.
Incorporate CPI, PPI, and core inflation into fundamental analysis for insights into economic health and currency values.
Mitigate risks by adapting strategies: adjust position sizes, set stop-loss levels, and diversify portfolios for effective risk management.
Hedge against inflation by strategically positioning in currencies and assets poised to appreciate, such as those from countries with strong inflation-fighting policies or inflation-resistant currencies like gold.
Implementing these streamlined strategies enables forex traders to navigate the complexities of an inflationary market with precision and confidence.
In conclusion, navigating forex trading in an inflationary landscape requires a nuanced understanding of how inflation impacts currency values.
By recognising the relationship between inflation and currency dynamics, utilising key indicators, and implementing strategic approaches, traders can effectively navigate the challenges and opportunities presented by inflation in the forex market.
Stay informed, stay adaptable, and integrate inflation analysis into your trading strategies to enhance your chances of success in the dynamic world of forex trading.
Written on February 16, 2024 at 9:54 am, by anakin
Please note that the dividends of the following products will be adjusted accordingly. Index dividends will be executed separately through a balance statement directly to your trading account, and the comment will be in the following format “Div & Product Name & Net Volume ”.
Please refer to the table below for more details:
The above data is for reference only, please refer to the MT4/MT5 software for specific data.
If you’d like more information, please don’t hesitate to contact info@vtmarkets.com.
Written on February 16, 2024 at 7:38 am, by anakin