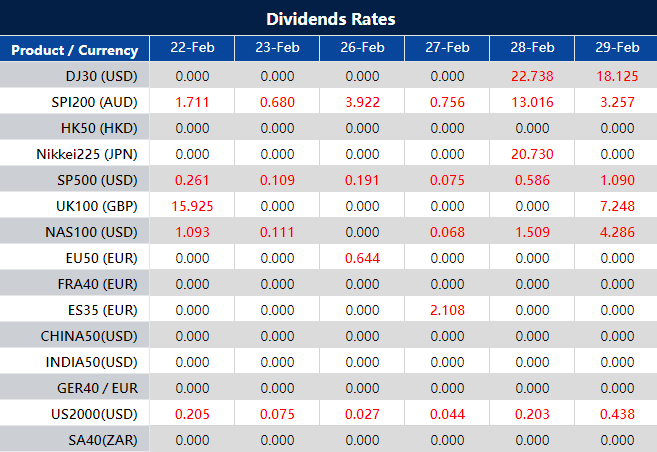
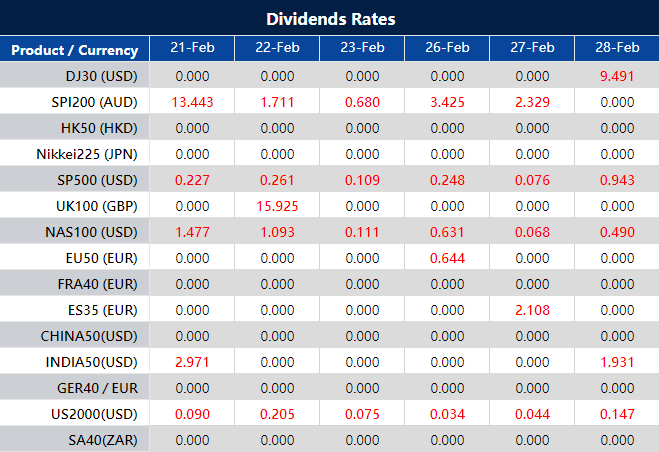
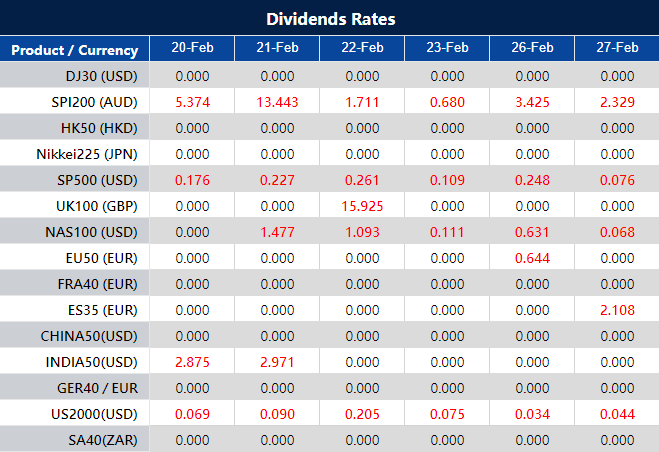
Please note that the dividends of the following products will be adjusted accordingly. Index dividends will be executed separately through a balance statement directly to your trading account, and the comment will be in the following format “Div & Product Name & Net Volume ”.
Please refer to the table below for more details:
The above data is for reference only, please refer to the MT4/MT5 software for specific data.
If you’d like more information, please don’t hesitate to contact info@vtmarkets.com.
Written on February 22, 2024 at 6:58 am, by anakin
On Wednesday, the stock market showed mixed outcomes, with the Dow Jones and S&P 500 making slight gains, while the Nasdaq Composite faced a decline, influenced by anxiously awaited Nvidia earnings and Federal Reserve insights. Nvidia’s stock dipped ahead of its fiscal report, reflecting investor concerns over its valuation after a significant year-long surge. The market also reacted to Palo Alto Networks’ and SolarEdge Technologies’ disappointing forecasts, alongside the Fed’s minutes indicating a cautious stance on interest rate cuts, emphasizing inflation control. Currency markets saw fluctuations, with the dollar index falling amidst complex global yield dynamics and central bank policies, highlighting the intricate interplay between economic signals, corporate earnings, and monetary policy expectations.
Stock Market Updates
The stock market experienced mixed results on Wednesday, with the Dow Jones Industrial Average slightly gaining by 48.44 points to close at 38,612.24 and the S&P 500 also up by 0.13% at 4,981.80. In contrast, the tech-heavy Nasdaq Composite fell by 0.32%, continuing its downward trend for the third consecutive session, to end at 15,580.87. The market’s attention was particularly focused on Nvidia, ahead of its fiscal fourth-quarter earnings report, amidst growing concerns over the chipmaker’s valuation after its shares surged nearly 230% over the past year. On the day, Nvidia’s stock declined by 2.85%, reflecting investor apprehension about whether it could continue to buoy the market amidst a backdrop of uncertain catalysts for growth.
Market sentiment was further influenced by a combination of corporate news and insights from the Federal Reserve. Palo Alto Networks saw a significant drop of 28.4% after revising its full-year revenue forecast downwards, while SolarEdge Technologies also faced a setback, with its shares falling approximately 12.2% due to weak first-quarter guidance. Adding to the cautious market outlook, minutes from the Federal Reserve’s January meeting revealed a reluctance to cut interest rates anytime soon, emphasizing that any decisions on rate cuts would require greater confidence in the slowing down of inflation. This stance underscores the central bank’s cautious approach to navigating economic signals, leaving the market to look towards corporate earnings and guidance as potential catalysts for future growth.
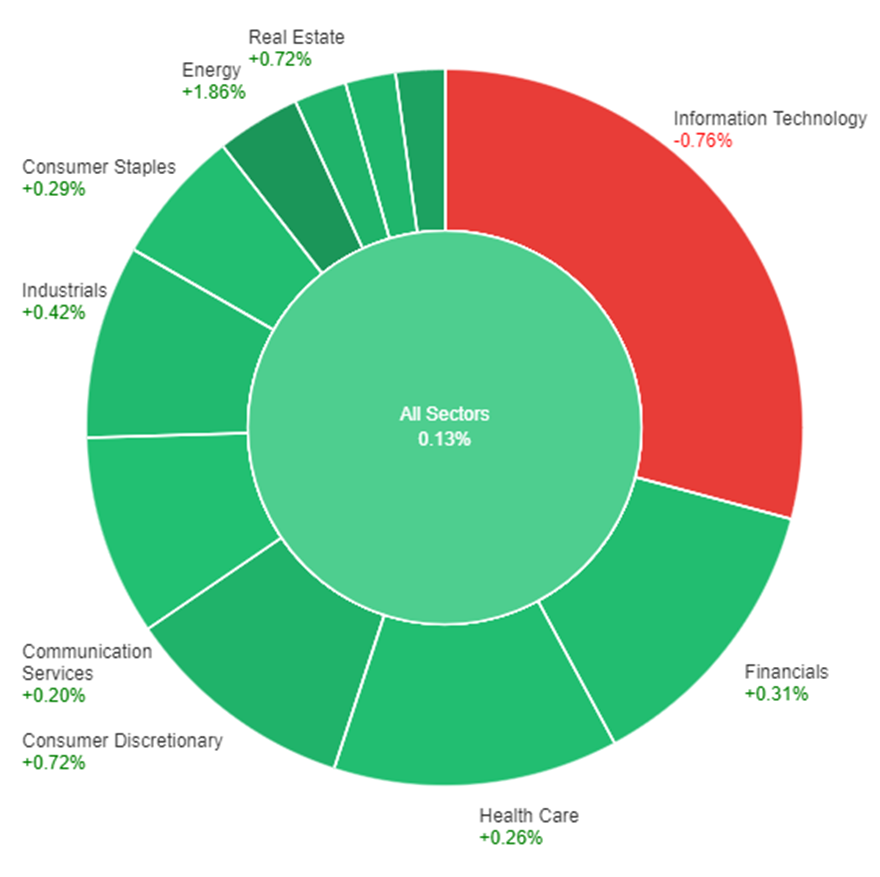
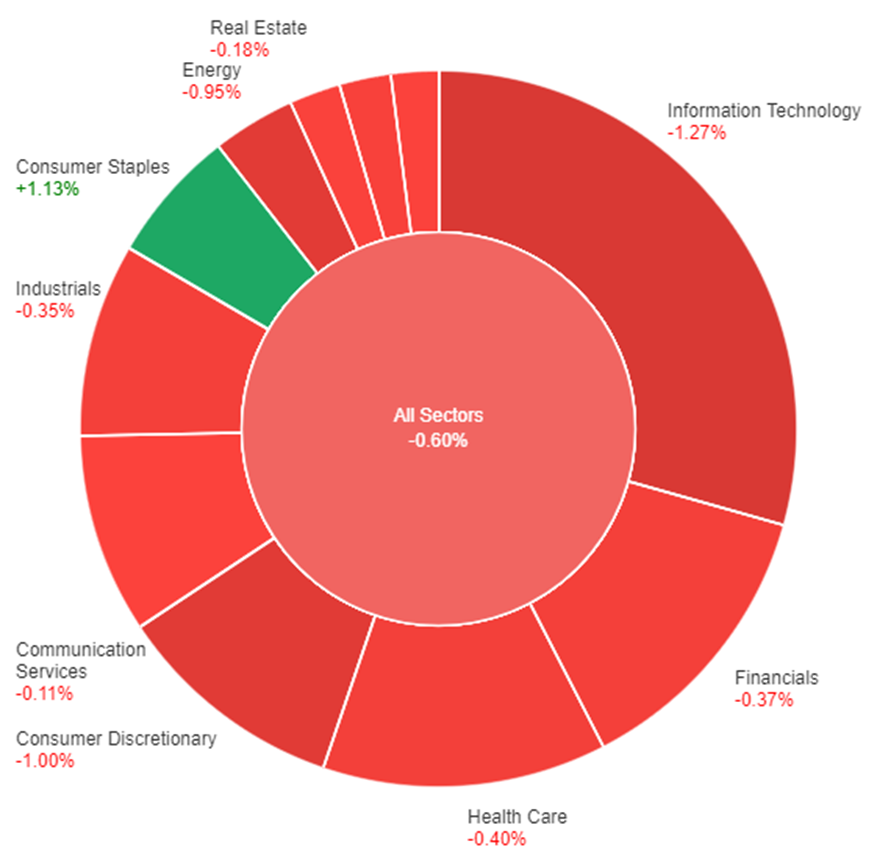
On Wednesday, the market witnessed modest gains across most sectors, with the overall sectors index up by 0.13%. The energy sector led the charge, recording a significant increase of 1.86%, followed closely by utilities, which saw a 1.36% rise. Consumer discretionary and real estate sectors both enjoyed gains of 0.72%, demonstrating a healthy appetite for risk among investors. Other sectors such as materials, industrials, financials, consumer staples, health care, and communication services also experienced growth, albeit at a more moderate pace. However, the information technology sector bucked the positive trend, facing a downturn of 0.76%, indicating sector-specific challenges or profit-taking by investors.
Currency Market Updates
The currency market experienced notable fluctuations, with the dollar index declining by 0.9% amid a complex interplay of treasury yields and central bank policies. The increase in Treasury yields, although outpaced by European yields, failed to keep up with the steadiness of Japanese Government Bond (JGB) yields. This dynamic, alongside the diminishing likelihood of interest rate cuts by major central banks such as the Federal Reserve (Fed), the European Central Bank (ECB), and the Bank of England (BoE), exerted pressure on risk appetite. The anticipation surrounding the Federal Reserve’s minutes and Nvidia’s report further influenced market sentiments. Despite the anticipation, the Fed minutes merely echoed previous statements and comments, offering no new impetus for dollar strength. Meanwhile, the USD/JPY pair saw a slight increase, attributed to the static nature of JGB yields which made the yen less attractive compared to its higher-yielding counterparts.
In Europe, the ECB’s stance, as articulated by Pierre Wunsch, suggested a prolonged period of tight monetary policy, given the persistent wage pressures and tight labor markets. This position was mirrored by the market’s adjustment in expectations for rate cuts, with the first ECB rate reduction now fully priced in for June. The euro found some support against the dollar, benefiting from a tightening in the 2-year bund-Treasury yield spreads. However, the recovery of the EUR/USD pair was tempered by technical resistance and a cautious outlook for the BoE’s policy direction, which also impacted the GBP/USD pair. The British pound struggled against the backdrop of rising Gilts-Treasury yield spreads and comments from BoE officials emphasizing the cost of delayed rate adjustments. These developments underscore the intricate balance of yield dynamics, central bank policies, and economic indicators shaping the currency markets, with implications for the path of the dollar and its major counterparts.
Picks of the Day Analysis
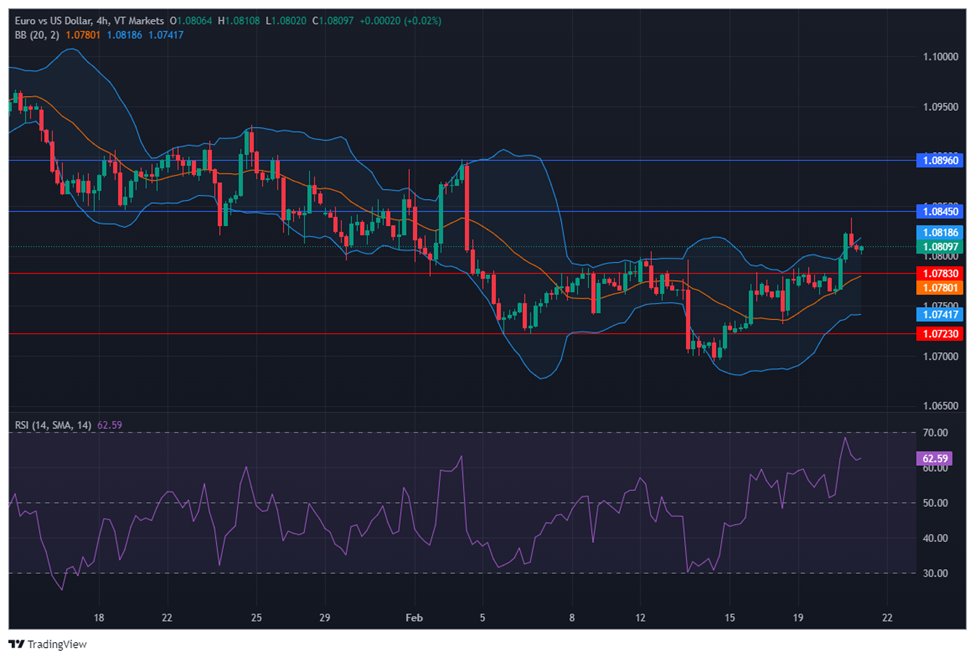
EUR/USD (4 Hours)
EUR/USD Stabilizes Amid Speculations of Fed Rate Cuts
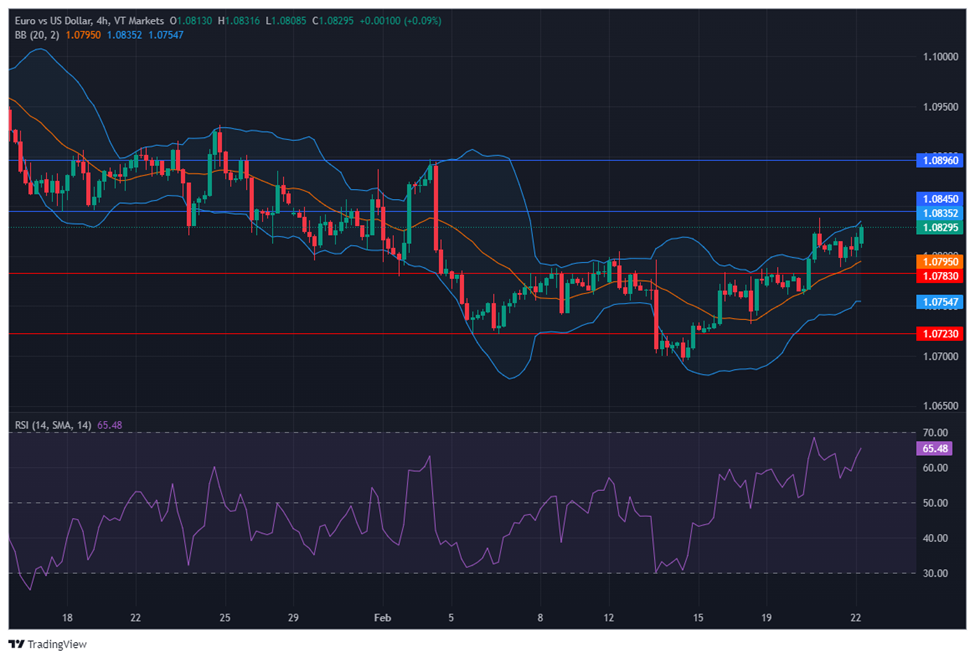
The EUR/USD pair exhibited slight fluctuations, stabilizing around the 1.0800 mark, amidst a backdrop of uncertain US dollar movements and anticipations of Federal Reserve interest rate adjustments. This period of inconclusive price action follows a recent surge to 1.0840, driven by speculations and marginal gains in US bond yields, hinting at possible Fed rate cuts later in the year. Market probabilities lean towards a rate reduction by the Fed, with a 30% chance in May, escalating to 53% in June. Concurrently, the European Central Bank (ECB) faces its rate decision pressures, amidst improved consumer confidence in the Eurozone and ongoing discussions on monetary easing, setting a complex stage for the EUR/USD dynamics as both regions navigate through inflationary pressures and economic forecasts.
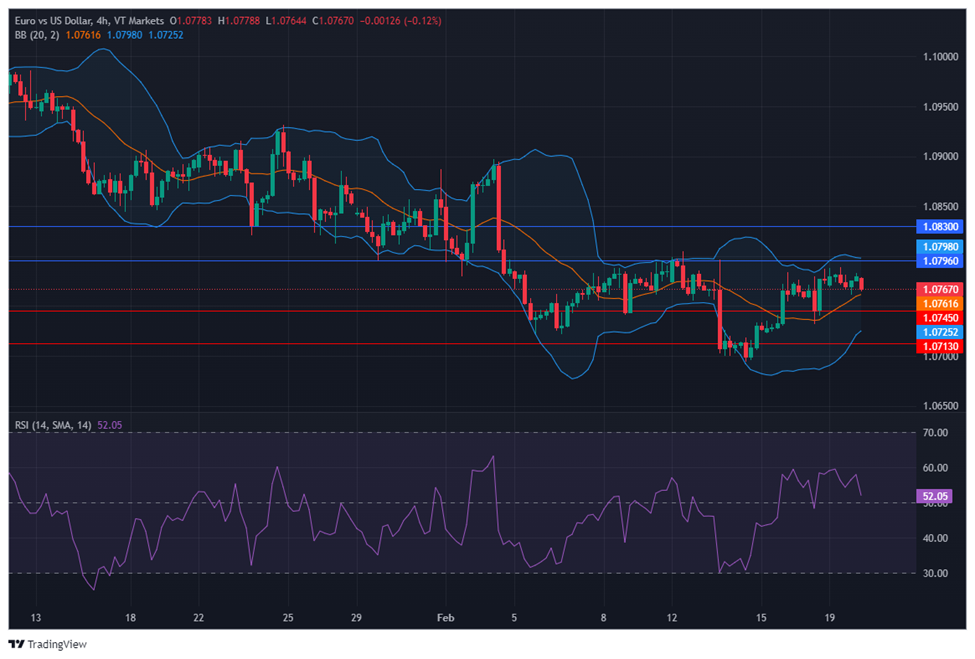
On Wednesday, the EUR/USD moved higher and was able to reach near the upper band of the Bollinger Bands. Currently, the price is moving just below the upper band, suggesting a potential upward movement to reach the upper band. Notably, the Relative Strength Index (RSI) maintains its position at 65, signaling a bullish outlook for this currency pair.
Resistance: 1.0845, 1.0896
Support: 1.0783, 1.0723
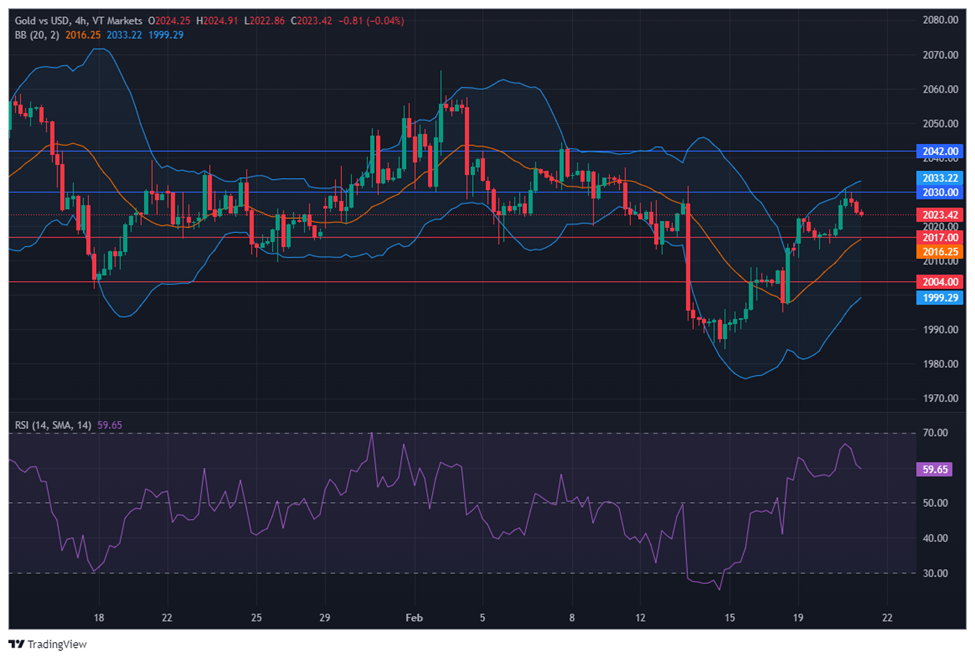
XAU/USD (4 Hours)
XAU/USD Trajectory Amidst Dollar Strength and Anticipation of FOMC Minutes
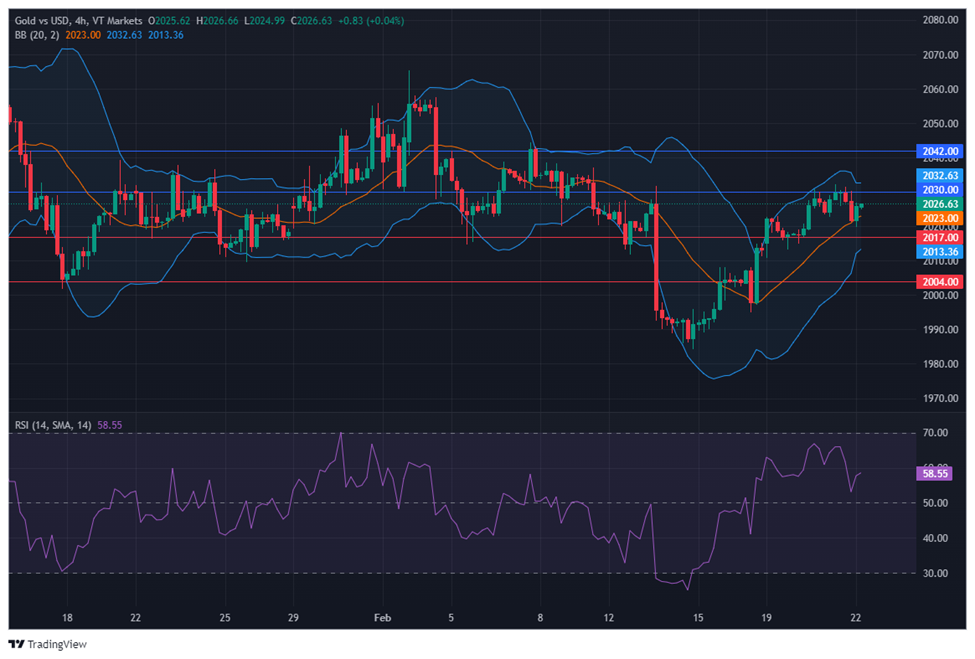
As the US Dollar gained momentum with Wall Street’s opening and before the release of the Federal Open Market Committee (FOMC) Minutes, gold prices (XAU/USD) were influenced by a complex interplay of factors. The anticipation surrounding the FOMC minutes, detailing reasons for holding interest rates steady in early 2024, and Chairman Jerome Powell’s remarks on the unlikelihood of a March rate cut, set a cautious tone in the market. Despite recent employment and inflation data backing the Federal Reserve’s wait-and-see approach, shifting rate-cut expectations to June from May, the overall mixed performance of the dollar amidst a lackluster risk appetite and struggling global equities highlights a potentially volatile environment for gold as investors digest these economic cues.
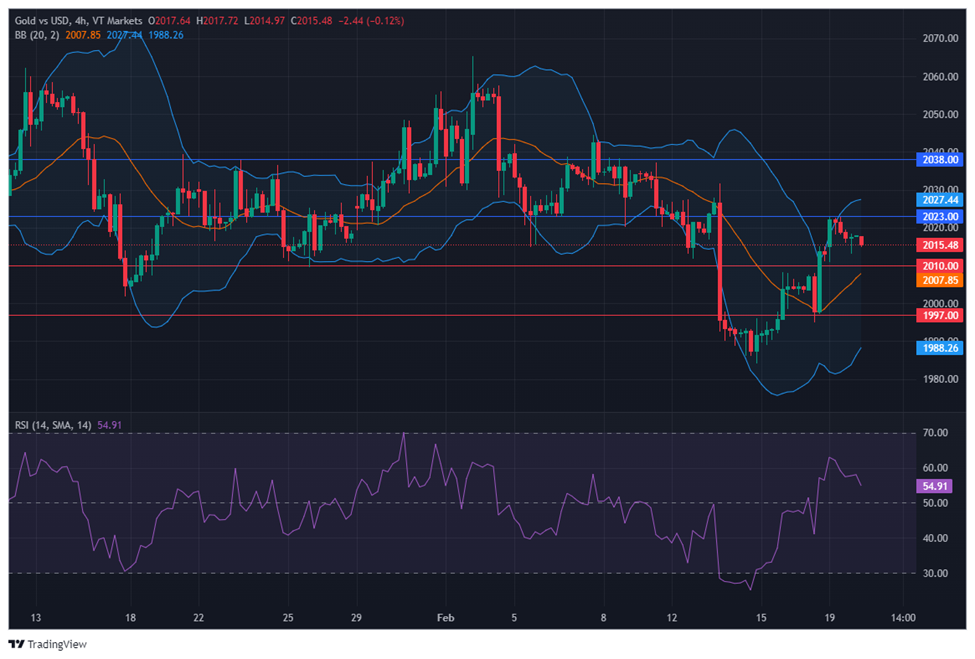
On Wednesday, XAU/USD moved back lower to reach the middle band after reaching near the upper band of the Bollinger Bands. Currently, the price is moving just above the middle band, suggesting a potential upward movement toward the upper band. The Relative Strength Index (RSI) stands at 58, signaling a neutral with a slightly bullish outlook for this pair.
Resistance: $2,030, $2,042
Support: $2,017, $2,004
Economic Data
Currency
Data
Time (GMT + 8)
Forecast
EUR
French Flash Manufacturing PMI
16:15
43.5
EUR
French Flash Services PMI
16:15
45.7
EUR
German Flash Manufacturing PMI
16:30
46.1
EUR
German Flash Services PMI
16:30
48.0
GBP
Flash Manufacturing PMI
17:30
47.5
GBP
Flash Services PMI
17:30
54.2
USD
Unemployment Claims
21:30
217K
USD
Flash Manufacturing PMI
22:45
50.5
USD
Flash Services PMI
22:45
52.4
Written on February 22, 2024 at 1:19 am, by anakin
Imagine a time when basic commodities like bread and gas were just a few cents, and fast forward to today, where their prices often strain our budgets.
This gradual increase in the price of goods and services over time is known as inflation, a phenomenon deeply embedded in economic history that significantly impacts market dynamics and investment strategies in the forex domain.
Understanding inflation
Inflation, often termed the silent thief of purchasing power, influences individuals, businesses, and entire economies.
At its core, inflation signifies a sustained uptick in the general price level of goods and services, resulting in a rise in the cost of living and a decline in the purchasing power of currency.
While moderate inflation is seen as conducive to healthy economic growth, excessive inflation can erode purchasing power, disrupt economic stability, and hinder long-term prosperity.
The driving forces behind inflation:
Demand-pull inflation: Arises when demand outpaces supply due to factors such as consumer spending patterns and policy interventions.
Cost-push inflation: Emerges from rising production costs passed on to consumers.
Monetary factors: Central bank actions, like interest rate adjustments, that impact inflation.
Supply chain disruptions: Global phenomena leading to shortages and subsequent price hikes.
Expectations and psychology: Influence consumer behaviour, affecting inflation outcomes.
Types of inflation
Inflation presents itself in various forms, each with unique characteristics and underlying causes:
Creeping inflation: Characterised by a gradual rise in prices, often associated with stable economic conditions and moderate inflation rates.
Walking inflation: Signifies a slightly accelerated pace of price increases compared to creeping inflation, posing manageable economic risks.
Galloping inflation: Represents a rapid surge in price levels, often reaching double or triple-digit inflation rates, jeopardising economic stability and currency confidence.
Hyperinflation: The most extreme form of inflation, characterised by astronomical inflation rates, resulting in the collapse of the monetary system and severe economic turmoil.
Impact of inflation on currency valuation
Understanding the relationship between inflation and currency valuation is crucial for forex traders.
As inflation rises, a currency’s value typically declines due to the erosion of its purchasing power. Conversely, currencies from regions with low inflation or stable prices often experience heightened demand, bolstering their value against others.
However, this correlation is not always straightforward, as various factors such as interest rate differentials, economic growth prospects, geopolitical events, and market sentiment also influence exchange rates.
Role of central banks in inflation management
Central banks play a critical role in managing inflation through monetary policy tools like interest rates, open market operations, and forward guidance.
For forex traders, closely monitoring central bank actions is essential, utilising tools like the Economic calendar to anticipate and react swiftly to policy shifts.
Indicators and metrics for monitoring inflation
Inflation serves as a vital indicator of economic health, influencing policy decisions and investment strategies.
Consumer Price Index (CPI): Tracks changes in household goods and services prices, indicating consumer inflation.
Producer Price Index (PPI): Monitors changes in producer prices, reflecting upstream inflationary trends.
Core vs. headline inflation: Core inflation excludes volatile items like food and energy, offering a stable measure of underlying trends.
Other economic indicators: Monitoring unemployment rates and GDP growth provides insights into inflationary pressures and broader economic conditions.
By analysing these indicators, forex traders gain a comprehensive view of inflation trends and their impact on currency values.
Strategies for trading in an inflationary environment
Adapting to inflationary undercurrents in the forex domain requires strategic finesse.
Here are succinct strategies for traders:
Stay informed about inflation across economies, dissecting data releases and central bank communiques for nuanced trend prognostication.
Incorporate CPI, PPI, and core inflation metrics into fundamental analyses to glean insights into economic robustness and currency values.
Mitigate risks by recalibrating strategies: adjust position sizes, establish stop-loss thresholds, and diversify portfolios for effective risk management.
Hedge against inflation by strategically positioning in currencies and assets poised for appreciation, such as those with robust inflation-combatting policies or inflation-resilient assets like gold.
In conclusion, navigating forex trading amidst an inflationary landscape mandates a nuanced comprehension of inflation’s ripple effects on currency valuations.
By discerning the interplay between inflation and currency dynamics, leveraging key indicators, and deploying strategic methodologies, traders can adeptly navigate the challenges and seize the opportunities presented by inflation in the forex sphere.
Stay informed, stay adaptable, and integrate inflationary analyses into your trading blueprints to augment your prospects of success in the dynamic realm of forex trading.
Gold is one of the most popular commodities in the world, and for good reason. It has a long history of being a store of value, a hedge against inflation, and a safe haven in times of crisis.
But did you know that gold also has seasonal patterns that can help you optimize your trading strategy?
Let’s dive in to know what seasonal patterns are, how they affect gold prices, and which are the best months to trade gold.
We will also show you how to use a free tool to analyze seasonal patterns in gold trading and how to open a demo account to practice trading without risking any money.
Seasonal patterns in gold trading
Seasonal patterns are recurring trends or cycles that occur in the price of an asset over a certain period of time. They are influenced by various factors, such as supply and demand, weather, holidays, festivals, geopolitics, and market sentiment.
Seasonal patterns can help traders identify potential opportunities and risks in the market, as well as plan their entry and exit points.
However, seasonal patterns are not always reliable or consistent. In addition, they can be affected by unexpected events or changes in market conditions.
Therefore, traders should always use other tools and indicators to confirm their analysis and manage risk.
How do seasonal patterns affect gold prices?
Gold prices tend to follow certain seasonal patterns throughout the year, depending on the demand and supply of the precious metal. Some of the main factors that influence gold demand and supply are:
1) Jewelry demand:
Gold is widely used for jewelry making, especially in countries like India and China, where gold is considered a symbol of wealth and prosperity.
Jewelry demand usually peaks during festive seasons, such as Diwali, Chinese New Year, Valentine’s Day, and Christmas.
2) Investment demand:
Gold is also sought after by investors who want to:
Diversify their portfolio,
Hedge against inflation,
or protect their wealth from political or economic uncertainty.
Investment demand usually rises during periods of market volatility, geopolitical tension, or currency devaluation.
3) Central bank demand:
Gold is also held by central banks as part of their foreign exchange reserves. Central banks can buy or sell gold to influence their currency value, interest rates, or monetary policy. Central bank demand usually depends on their economic outlook and policy objectives.
4) Mining supply:
Gold is also produced by mining companies who extract it from the earth. Mining supply usually depends on the cost of production, the availability of resources, and the environmental regulations.
5) Choosing the best broker
When trading gold, selecting a reliable forex broker is crucial. A top-notch broker should offer competitive spreads, robust trading platforms, and excellent customer service. A great broker would be like VT Markets, we provide one of the best spreads and leverage for gold trading.
Based on these factors, gold prices tend to exhibit some common seasonal patterns over the year, such as:
January effect:
Gold prices often start the year with a strong rally, as investors buy gold to hedge against the potential risks of the new year. This is also known as the January effect or the Santa Claus rally.
Spring weakness:
Gold prices often experience a correction or consolidation in the spring months, as jewelry demand slows down after the festive season and investors take profits from the January rally.
Summer rally:
Gold prices often rebound in the summer months, as jewelry demand picks up again ahead of the wedding season in India and China. This is also when central banks tend to buy more gold to diversify their reserves.
Autumn strength:
Gold prices often reach their highest levels in the autumn months, as jewelry demand peaks during Diwali and Chinese New Year. This is also when investors tend to buy more gold to hedge against inflation or market uncertainty.
December weakness:
Gold prices often end the year with a decline or stagnation, as jewelry demand drops after the festive season and investors sell gold to rebalance their portfolio or realize their gains.
Capitalizing on Gold’s Seasonal Trends
Of course, these seasonal patterns are not set in stone and can vary from year to year depending on other factors. For example, in 2020, gold prices surged to a record high of over $2,000 per ounce in August due to the COVID-19 pandemic and its impact on the global economy and financial markets.
If you want to practice trading gold without risking any money, you can open a demo account with a reputable online broker. A demo account is a simulated trading account that allows you to trade with virtual money using real-time market data and conditions.
Enhance Your Gold Trading Strategy with VT Markets
Ready to capitalize on gold’s seasonal trends? VT Markets offers a robust platform for trading gold with competitive spreads and excellent customer service. Open a demo account today to practice trading without financial risk and refine your strategies using real-time market data. Start your journey with VT Markets and take your gold trading to the next level! Visit vtmarkets.net to get started.
Written on February 21, 2024 at 9:11 am, by anakin
Please note that the dividends of the following products will be adjusted accordingly. Index dividends will be executed separately through a balance statement directly to your trading account, and the comment will be in the following format “Div & Product Name & Net Volume ”.
Please refer to the table below for more details:
The above data is for reference only, please refer to the MT4/MT5 software for specific data.
If you’d like more information, please don’t hesitate to contact info@vtmarkets.com.
Written on February 21, 2024 at 8:14 am, by anakin
On Tuesday, the stock market faced a downturn, heavily influenced by a slump in technology stocks, especially with Nvidia’s earnings report on the horizon, causing its shares to fall by 4.4%. The Dow Jones Industrial Average slightly declined by 0.17%, while more significant drops were observed in the S&P 500 and Nasdaq Composite, decreasing by 0.60% and 0.92%, respectively. This trend reflected broader concerns over the tech sector’s high valuations, with companies like Amazon, Microsoft, and Meta also experiencing losses. Concurrently, major financial transactions grabbed headlines, including Capital One’s acquisition of Discover Financial Services for $35.3 billion and Walmart’s purchase of Vizio for $2.3 billion, both moves sparking notable stock surges. Additionally, currency markets saw fluctuations amid varied economic indicators and policy expectations, affecting the dollar index and EUR/USD pair. These market movements underscore the complexities of sector-specific trends and significant corporate deals, against a backdrop of evolving global economic conditions and monetary policies.
Stock Market Updates
On Tuesday, the stock market experienced a downturn, influenced significantly by a decline in technology stocks, particularly ahead of Nvidia’s earnings report. The Dow Jones Industrial Average saw a slight decrease of 0.17%, closing at 38,563.80, while the S&P 500 and Nasdaq Composite fell by 0.60% and 0.92% respectively. Nvidia’s stock dropped by nearly 4.4% amid concerns over its high valuation despite anticipated strong earnings. This sentiment was echoed across other tech giants, with Amazon, Microsoft, and Meta also recording losses. The tech sector’s valuation, trading at around 30 times forward estimates, has raised doubts about further price-to-earnings (PE) multiple expansion, according to CFRA Research’s chief investment strategist, Sam Stovall.
In addition to the tech sector’s performance, significant financial transactions also captured market attention. Capital One Financial announced its plan to acquire Discover Financial Services in a deal valued at $35.3 billion, which is expected to close between late 2024 and early 2025, causing Discover’s stock to surge by 12.6%. Meanwhile, Walmart revealed its acquisition of TV manufacturer Vizio for $2.3 billion, a move that resulted in a 16% jump in Vizio’s shares and a more than 3% increase in Walmart’s stock following the retailer’s announcement of surpassing quarterly earnings and revenue expectations. These developments highlight the ongoing adjustments within the stock market, influenced by both sector-specific trends and significant corporate deals.
On Tuesday, the market saw a mixed performance across various sectors with an overall price decline of 0.60% across all sectors. Consumer Staples emerged as the top performer, recording a gain of 1.13%, while Information Technology faced the steepest decline, dropping by 1.27%. Sectors such as Consumer Discretionary and Energy also saw significant losses, decreasing by 1.00% and 0.95% respectively. Other sectors experienced more moderate changes, with Communication Services, Utilities, Real Estate, Materials, Industrials, Financials, and Health Care witnessing declines ranging from -0.11% to -0.40%.
Currency Market Updates
The currency markets have recently experienced fluctuations, notably with the dollar index and the EUR/USD pair both witnessing a rise of 0.27%. This movement came amidst a complex backdrop of economic indicators and policy expectations. On one hand, the U.S. Treasury yields hit a resistance last week, influenced by a mix of conflicting domestic data, including softer Philly Fed and Leading Economic Index (LEI) figures, as well as external factors like China’s rate cut. These developments have somewhat dented the dollar’s strength. Furthermore, the anticipation around the Federal Reserve’s rate cuts for 2024 has seen a significant adjustment, with the market’s expectations dialing down from five to six rate cuts to less than four, aligning more closely with the Fed’s December projections of 75 basis points in cuts.
The detailed dynamics of these currency movements also reflect broader global economic sentiments and policy maneuvers. For instance, the EUR/USD rally on Tuesday was noteworthy, overcoming key resistance levels and indicating a potential shift in market sentiment. Meanwhile, the USD/JPY pair’s movements have been influenced by the Treasury-Japanese Government Bond (JGB) yield spreads, alongside speculations around the Bank of Japan’s policy directions and their implications for the currency pair. Additionally, the broader implications of these currency shifts, alongside upcoming economic data releases like global flash PMIs and U.S. jobless claims, are keenly awaited by the markets. They are expected to provide further clarity on the U.S. economic performance and its impact on currency valuations, especially as investors and analysts parse through the Fed’s upcoming meeting minutes for insights into future rate adjustments.
Picks of the Day Analysis
EUR/USD (4 Hours)
EUR/USD Peaks Amid Speculation on Fed Rate Decisions
The EUR/USD pair reached a new high since early February, closing near 1.0800, as it gained from the widespread weakness of the US Dollar. This shift was largely influenced by market speculation that the Federal Reserve might postpone interest rate cuts, with expectations for a May reduction significantly dropping post the latest Fed meeting. Despite a light economic calendar, the euro found additional support from positive data releases like the EU Current Account surplus and an increase in Construction Output. Investors now await the FOMC Meeting Minutes for further direction on the Fed’s rate policy outlook.
On Tuesday, the EUR/USD moved higher and was able to reach the upper band of the Bollinger Bands. Currently, the price is moving just below the upper band, suggesting a potential slight downward movement to reach the middle band before it goes back higher. Notably, the Relative Strength Index (RSI) maintains its position at 62, signaling a neutral but bullish outlook for this currency pair.
Resistance: 1.0845, 1.0896
Support: 1.0783, 1.0723
XAU/USD (4 Hours)
XAU/USD Hits Week-High as US Dollar Weakens Amid Rate Speculation
Spot Gold (XAU/USD) continues its ascent, marking a fourth day of gains by reaching around $2,030, a peak not seen in over a week. This surge comes as the US Dollar weakens, driven by increasing speculation that the Federal Reserve will maintain elevated interest rates longer than some investors expected. Despite the resilient US economy, bets against the Fed’s intentions have been cautioned against by officials, shifting market expectations towards a later rate adjustment, now more heavily anticipated in June rather than March. Meanwhile, Wall Street experiences a downturn, though mitigated by some positive earnings reports, and a recovery in government bond yields further pressures the USD, contributing to Gold’s upward momentum.
On Tuesday, XAU/USD moved back lower after reaching the upper band of the Bollinger Bands. Currently, the price is moving between the upper and middle bands, suggesting a potential downward movement toward the middle band. The Relative Strength Index (RSI) stands at 59, signaling a neutral but bullish outlook for this pair.
Resistance: $2,030, $2,042
Support: $2,017, $2,004
Economic Data
Currency
Data
Time (GMT + 8)
Forecast
AUD
Wage Price Index q/q
09:30
0.9%
USD
FOMC Meeting Minutes
03:00 (22nd)
Written on February 21, 2024 at 1:08 am, by anakin
To provide our valued clients with an enhanced trading environment, VT Markets will adjust certain trading conditions for STP account on February 26, 2024:
STP Account
Original
Adjusted
Stop-Out Margin Level
50%
20%
Margin Call Level
80%
50%
Friendly reminder:
1. All account settings stay the same except for the above adjustments.
If you’d like more information, please don’t hesitate to contact info@vtmarkets.com.
Written on February 20, 2024 at 9:36 am, by anakin
Disclaimer: This article is for informational purposes only and should not be considered as financial advice. Investment decisions should be made based on your own research and risk assessment.
A Complete Review For Adobe Inc. in 2024
Adobe Inc. (ADBE) is a leading software company that has been a staple in the tech industry for decades. With its innovative products and strong financials, Adobe is a stock that investors should keep an eye on in 2024.
Company Snapshot:
Adobe Inc. is a renowned software company specializing in digital media and marketing software. With its establishment in 1982, Adobe has emerged as one of the largest and most diversified software companies worldwide.
Over the years, Adobe has made significant progress by expanding its product offerings and enhancing its customer experience.
In 2023, Adobe achieved a record revenue of $19.41 billion, representing 10% year-on-year growth. Adobe’s recent acquisition of Figma is expected to further strengthen its position in the market.
Financial Performance:
Adobe has demonstrated impressive financial performance in recent years. In the fourth quarter of 2023, the company achieved a remarkable revenue of $5.05 billion, indicating a 12% year-on-year growth.
Additionally, Adobe’s net income stood at $1.96 billion, while its cash flows from operations amounted to $1.60 billion. These robust financials underscore Adobe’s capacity to innovate and adapt to evolving market conditions.
Investment Potential:
Investing in Adobe presents a compelling opportunity for several reasons.
Firstly, the company boasts a diverse product portfolio encompassing digital media and marketing software. This diversification is a risk mitigation strategy against market volatility and industry-specific challenges.
Secondly, Adobe enjoys a strong competitive advantage derived from its innovative products and well-established brand recognition. These factors contribute to its continued success and market leadership.
Lastly, Adobe’s recent acquisition of Figma is poised to further enhance its market position. This strategic move fortifies Adobe’s competitive edge, making it an attractive investment option for those seeking to invest in the dynamic tech industry.
Risks and Considerations:
While Adobe is a strong investment opportunity, there are some risks and considerations that investors should be aware of.
First, Adobe operates in a highly competitive market, which could impact its market share and profitability.
Second, Adobe’s financial performance is subject to market volatility and other macroeconomic factors.
Finally, investors should consider diversifying their portfolio to mitigate risks associated with investing in a single stock.
Adobe Inc. is a strong investment opportunity for investors looking to invest in the tech industry. With its diverse product portfolio, strong financials, and innovative products, Adobe is well-positioned to continue its growth trajectory in 2024 and beyond.
However, investors should be aware of the risks associated with investing in a single stock and should consider diversifying their portfolio accordingly.
Trade Adobe with VT Markets
To explore Adobe Inc.’s potential further and consider diversifying your investment portfolio, VT Markets offers an innovative platform for trading Shares CFDs. With VT Markets, you can leverage Adobe’s market movements and gain exposure to a wide array of other stocks, offering a strategic blend of opportunities in the tech industry and beyond.
Please note that the dividends of the following products will be adjusted accordingly. Index dividends will be executed separately through a balance statement directly to your trading account, and the comment will be in the following format “Div & Product Name & Net Volume ”.
Please refer to the table below for more details:
The above data is for reference only, please refer to the MT4/MT5 software for specific data.
If you’d like more information, please don’t hesitate to contact info@vtmarkets.com.
Written on February 20, 2024 at 7:19 am, by anakin
With U.S. markets closed in observance of Presidents Day, global financial markets took center stage, showcasing mixed sentiments across different regions and sectors. Europe’s Stoxx 600 index saw a modest rebound, while Asian markets presented a mixed picture, influenced by the People’s Bank of China’s policy decisions and optimistic travel data from China. Meanwhile, the currency and commodity markets remained relatively stable, with minor movements in major currency pairs and commodities like gold seeing a slight rise. Key economic events, including policy decisions from the Reserve Bank of Australia and the People’s Bank of China, along with Canada’s CPI report, are highly anticipated by investors, potentially setting the tone for future market movements.
Stock Market Updates
The U.S. markets were closed on Monday in observance of Presidents Day, leading to a day where international markets garnered more attention. In Europe, the Stoxx 600 index managed a modest recovery, ending the day by 0.17%, a slight rebound from its negative performance in the morning session. Sector-wise, there was a mixed picture; mining stocks experienced a downturn, dropping by 1%, whereas healthcare stocks moved in the opposite direction, recording a gain of 0.95%. This divergence highlights the varied investor sentiments across different sectors within the European stock market landscape.
In company-specific news, shares of the Swiss software firm Temenos saw an impressive jump of 8.8%, bouncing back from the significant losses it suffered following a negative report from Hindenburg Research. On the other side of the globe, in the Asia-Pacific region, the stock market outcomes were mixed. Chinese markets showed optimism as traders returned from the Lunar New Year holidays, encouraged by promising travel data, while the Hong Kong stock market faced a downturn. The monetary policy stance of the People’s Bank of China, which held a key policy rate steady, also played a crucial role in shaping market expectations, especially in a global context where the timing of the U.S. Federal Reserve’s policy easing remains a focal point of speculation.
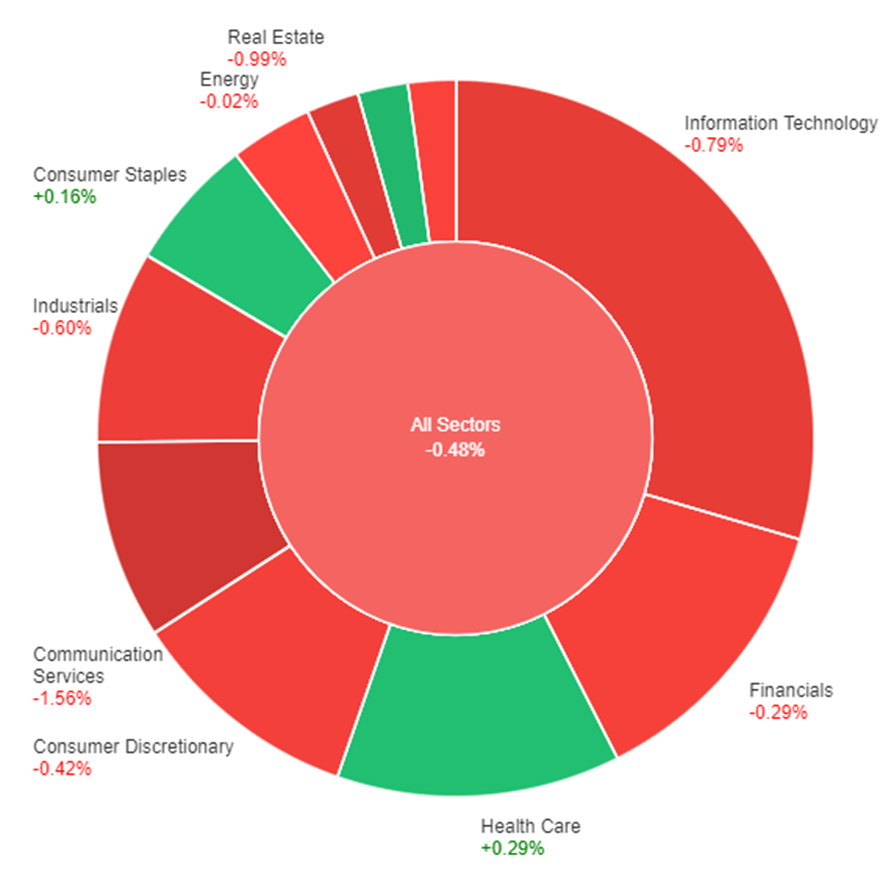
On Friday, the overall market saw a slight downturn, closing down by 0.48%. Despite the general negative sentiment, some sectors managed to post gains, with Materials leading the way with a 0.51% increase, followed by Health Care and Consumer Staples, which rose by 0.29% and 0.16%, respectively. On the flip side, the Communication Services sector faced the steepest decline at -1.56%, and Real Estate and Information Technology also experienced significant losses, dropping by -0.99% and -0.79% respectively. Other sectors such as Energy and Utilities saw marginal decreases, while Financials, Consumer Discretionary, and Industrials also ended the day in the red, highlighting a mixed but overall bearish performance across the market. Adding to the context, the US market was closed on Monday, suggesting that these movements were the last recorded before a day of inactivity in the trading sessions.
Currency Market Updates
In the recent currency market updates, major currency pairs have shown minimal movement, adhering to their familiar trading ranges, influenced by the holiday closures in the United States and Canada. Despite this lull, a cautious optimism permeated the financial markets, reflected in the performance of some European and Japanese stock indexes as they neared record highs. The Euro to US Dollar (EUR/USD) exchange rate remained just below the 1.0800 mark, while the British Pound to US Dollar (GBP/USD) hovered around 1.2600. The GBP gained momentum during the European trading session, although it saw a slight retreat before the day’s end. Meanwhile, the US Dollar saw modest gains against traditionally safe-haven currencies such as the Swiss Franc (CHF) and the Japanese Yen (JPY), hinting at a buoyant mood within the financial markets.
On the commodity front, the Australian Dollar recorded a slight increase against the US Dollar, with the AUD/USD pair trading near 0.6540. In contrast, the Canadian Dollar depreciated against its US counterpart, approaching the 1.3500 level. These movements come ahead of significant macroeconomic events slated for early this week. The Reserve Bank of Australia (RBA) is expected to release its Meeting Minutes, which market participants will scrutinize for indications on future monetary policy, especially concerning inflation control and rate adjustments. Additionally, the People’s Bank of China (PBoC) is set to announce its decision on interest rates, specifically the Loan Prime Rate (LPR), which could influence global financial sentiments. Meanwhile, Canada’s upcoming Consumer Price Index (CPI) report for January is anticipated to show a 0.4% month-over-month increase, potentially impacting the CAD’s performance. Furthermore, spot Gold has seen a rise for three consecutive days, briefly surpassing the $2,020.00 mark, adding another layer of complexity to the market dynamics as investors await these critical economic updates.
Picks of the Day Analysis
EUR/USD (4 Hours)
EUR/USD Sees Limited Movement Amid Quiet Macro Calendar and Mixed Market Sentiment
On Monday, the EUR/USD pair experienced limited investor engagement, ending the day with slight gains in the 1.0780 area, amidst a narrow trading range. The lack of significant macroeconomic data and the closure of US and Canadian markets contributed to the subdued activity. While the US dollar showed general weakness against a backdrop of mixed stock market performances, optimism in some Asian and European stock indexes did not translate into a clear direction for FX traders. The Euro’s muted response followed the Deutsche Bundesbank’s report suggesting a recession in Germany, attributed to weak demand and cautious investment. Looking ahead, a light macroeconomic calendar and anticipation for the Federal Open Market Committee (FOMC) meeting minutes release are likely to influence future trading dynamics, with the market seeking clues on monetary policy amidst recent inflation developments.
On Monday, the EUR/USD moved in consolidation, fluctuating between the middle and upper bands of the Bollinger Bands. Currently, the price is moving slightly above the middle band, suggesting a potential slight upward movement to reach above the upper band. Notably, the Relative Strength Index (RSI) maintains its position at 52, signaling a neutral outlook for this currency pair.
Resistance: 1.0796, 1.0830
Support: 1.0745, 1.0713
XAU/USD (4 Hours)
XAU/USD Gains Amidst Dollar Weakness and Mixed Market Sentiments
In Monday’s trading session, Gold (XAU/USD) saw an uptick, advancing to $2,023.04 a troy ounce in the first half, driven by a diminishing demand for the US Dollar before settling around $2,016 after the Dollar regained some strength. The broader financial markets experienced subdued volatility, attributed to holidays in Canada and the US, and a light macroeconomic calendar. Despite this, Asian and European markets offered mixed signals, with Chinese stocks gaining post-holiday and the Nikkei 225 nearing record highs before closing lower. European markets ended mixed but close to record levels. The financial landscape is currently absorbing recent US inflation data, which exceeded expectations, reducing the likelihood of an imminent rate cut by the Fed, with markets eagerly awaiting the upcoming FOMC Meeting Minutes for further direction.
On Monday, XAU/USD moved lower after reaching the upper band of the Bollinger Bands. Currently, the price is moving between the upper and middle bands, suggesting a potential downward movement toward the middle band. The Relative Strength Index (RSI) stands at 54, signaling a neutral outlook for this pair.
Resistance: $2,023, $2,038
Support: $2,010, $1,997
Economic Data
Currency
Data
Time (GMT + 8)
Forecast
AUD
Monetary Policy Meeting Minutes
08:30
CAD
Consumer Price Index m/m
21:30
0.4%
Written on February 20, 2024 at 1:25 am, by anakin