As we delve into the economic calendar for the upcoming week, several pivotal events and data releases promise to provide insight into the global economic landscape. From inflation figures to central bank deliberations and purchasing managers’ indices (PMIs), market participants will keenly watch these developments for signals regarding the direction of key economies. Here’s what to expect in the week ahead:
February 20, 2024: Canadian Inflation Rate
Canada’s annual inflation rate surged to 3.4% in December 2023, surpassing expectations and underscoring the persistent pressures on prices. The Bank of Canada had anticipated such an uptick, aligning with its outlook on inflation. Analysts now await the release of January 2024 data, scheduled for February 20, with expectations of a slight moderation to 3.2%.
February 21, 2024: Australia Wage Price Index
In Australia, the wage price index witnessed robust growth, reaching 4.0% year-on-year in Q3 2023, the highest level since Q1 2009. As data for Q4 2023 is set for release on February 21, analysts anticipate another uptick to 4.1%, indicative of sustained wage pressures.
February 22, 2024: FOMC Meeting Minutes
The minutes from the Federal Open Market Committee (FOMC) meeting in January 2024 will be scrutinized for insights into the Federal Reserve’s monetary policy stance. Despite maintaining the Fed funds rate at a 23-year peak of 5.25%-5.5% for the fourth consecutive meeting, Chair Powell hinted at the possibility of a rate reduction later in the year. However, the decision remains contingent upon evolving economic conditions, suggesting a cautious approach to policy adjustments.
February 22, 2024: Flash Manufacturing PMI
On the same day, flash manufacturing PMI figures for Germany, the UK, and the US will provide a snapshot of industrial activity. In January 2024, while Germany recorded a PMI of 45.5, the UK and the US posted figures of 47 and 50.7, respectively. Analysts anticipate slight improvements in the January 24, 2024, readings, with forecasts at 46.1 for Germany, 47.5 for the UK, and 50.1 for the US.
February 22, 2024: Flash Services PMI
Simultaneously, attention will be on the flash services PMI for the same countries. In January 2024, Germany witnessed a decline to 47.7, while the UK and the US saw expansions to 54.3 and 52.5, respectively. Projections for February 22, 2024, point to readings of 48 for Germany, 54.5 for the UK, and 52 for the US.
As markets await these critical releases and events, investors and analysts alike remain vigilant, poised to interpret the data and its implications for economic trajectories and financial markets. The week ahead promises to offer valuable insights into the ongoing dynamics shaping the global economy.
Written on February 19, 2024 at 1:49 am, by anakin
Navigating Inflation with Effective Forex Trading Strategies
Hyper-inflation source: The Wall Street Journal
Imagine a time when a loaf of bread cost just a few cents, and a gallon of gas was a pocket-change purchase. Now, fast forward to today, where those same items can often dent our wallets significantly.
This gradual increase in the price of goods and services over time is what economists term as inflation. It is a phenomenon that has been shaping economies and markets for centuries, and understanding its nuances is crucial for anyone looking to thrive in the world of forex trading.
Understanding inflation
Inflation, often dubbed the silent thief of purchasing power, is a widespread economic phenomenon impacting individuals, businesses, and entire nations.
At its core, it denotes a sustained increase in the general price level of goods and services over time, resulting in a gradual rise in the cost of living and a decrease in the purchasing power of currency.
While moderate inflation is deemed a natural aspect of healthy economic growth, excessive inflation can undermine purchasing power, disrupt economic stability, and impede long-term prosperity.
Understanding the drivers behind inflation is crucial. They include:
Demand-pull inflation: results from demand exceeding supply due to factors like consumer spending and policy changes.
Cost-push inflation: arises from increased production costs passed on to consumers.
Monetary factors: central bank actions, such as interest rate adjustments, impacting inflation.
Supply chain disruptions: global issues causing shortages and price hikes.
Expectations and psychology: influence behaviour, affecting inflation outcomes.
Types of inflation source: Oscar Education
Types of inflation
Inflation manifests in various forms, each with distinct characteristics and underlying causes:
1. Creeping inflation: Characterised by a slow and gradual rise in prices, creeping inflation is typically associated with stable economic conditions and moderate inflation rates.
2. Walking inflation: Walking inflation refers to a slightly faster pace of price increases compared to creeping inflation but remains manageable and does not pose significant economic risks.
3. Galloping inflation: Galloping inflation represents a rapid acceleration in price levels, often reaching double-digit or triple-digit inflation rates. It can erode purchasing power rapidly, disrupt economic stability, and undermine confidence in the currency.
4. Hyperinflation: Hyperinflation is the most extreme form of inflation, characterised by astronomical inflation rates, often exceeding 50% per month. It results in the complete breakdown of the monetary system, rendering the currency worthless and causing severe social and economic upheaval.
How inflation affects currency values
Understanding how inflation affects currency values is essential for forex traders.
Purchasing power of the US Dollar source: Visual Capitalist
As inflation rises, a currency’s value typically decreases due to the erosion of its purchasing power. This decreased attractiveness prompts investors to seek higher returns, leading to a decline in the currency’s value.
Conversely, currencies from nations with low inflation or stable prices often see increased demand, which strengthens their value against others.
However, this relationship is not always straightforward, as a range of factors like interest rates, economic growth prospects, geopolitical events, and market sentiment can also influence exchange rates.
Role of Central Banks in managing inflation
Central banks play a vital role in managing inflation through monetary policy tools like interest rates, open market operations, and forward guidance.
Inflation targeting frameworks, where central banks set explicit targets, are widespread in many countries.
US Fed inflation targeting vs real inflation rate source: The Real Economy Blog
For forex traders, monitoring central bank decisions is crucial; using tools like the Economic calendar helps anticipate and react to actions swiftly.
Hawkish policies, like interest rate hikes, strengthen a currency, while dovish measures, aiming to stimulate growth, may lead to depreciation as investors seek higher returns elsewhere.
Indicators and metrics to monitor inflation
Inflation serves as a vital gauge of economic health, influencing policy decisions and investment strategies.
US inflation indicators source: Euromonitor
Consumer Price Index (CPI)
CPI tracks changes in household goods and services prices, indicating consumer inflation. Higher CPI signals rising inflationary pressures, potentially leading to currency depreciation.
Producer Price Index (PPI)
PPI tracks changes in producer prices, reflecting upstream inflation trends. Rising production costs may translate into consumer price hikes and inflationary pressures.
Core vs Headline Inflation
Core inflation excludes volatile items like food and energy, offering a stable measure of underlying inflation trends. Comparing core to headline inflation helps filter out temporary fluctuations.
Other Economic Indicators
Monitoring unemployment rates and GDP (Gross Domestic Product) growth provides insights into inflationary pressures and broader economic conditions. High unemployment may dampen wage pressures and inflation, while strong GDP growth may signal inflationary tendencies.
By analysing these indicators, forex traders gain a comprehensive view of inflation trends and their impact on currency values.
Strategies for Trading in an Inflationary Environment
Adapting to inflationary shifts in the forex market requires strategic manoeuvres. Here are concise strategies for traders:
Stay informed about inflation across economies, analysing data releases and central bank announcements for accurate trend anticipation.
Incorporate CPI, PPI, and core inflation into fundamental analysis for insights into economic health and currency values.
Mitigate risks by adapting strategies: adjust position sizes, set stop-loss levels, and diversify portfolios for effective risk management.
Hedge against inflation by strategically positioning in currencies and assets poised to appreciate, such as those from countries with strong inflation-fighting policies or inflation-resistant currencies like gold.
Implementing these streamlined strategies enables forex traders to navigate the complexities of an inflationary market with precision and confidence.
In conclusion, navigating forex trading in an inflationary landscape requires a nuanced understanding of how inflation impacts currency values.
By recognising the relationship between inflation and currency dynamics, utilising key indicators, and implementing strategic approaches, traders can effectively navigate the challenges and opportunities presented by inflation in the forex market.
Stay informed, stay adaptable, and integrate inflation analysis into your trading strategies to enhance your chances of success in the dynamic world of forex trading.
Written on February 16, 2024 at 9:54 am, by anakin
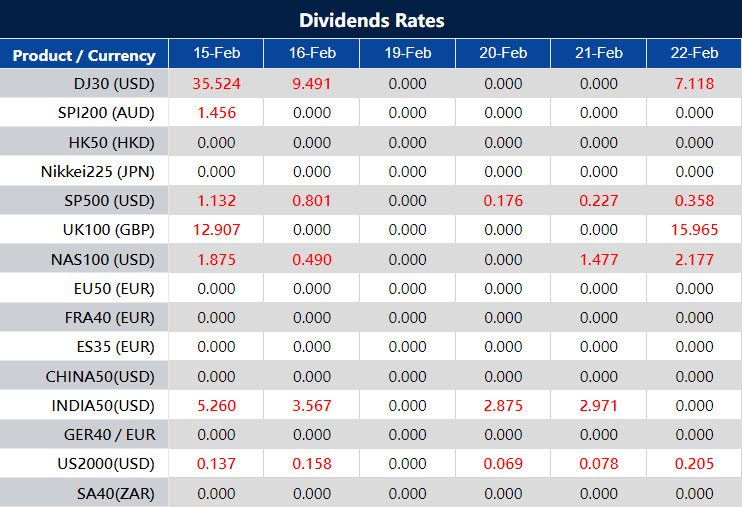
Please note that the dividends of the following products will be adjusted accordingly. Index dividends will be executed separately through a balance statement directly to your trading account, and the comment will be in the following format “Div & Product Name & Net Volume ”.
Please refer to the table below for more details:
The above data is for reference only, please refer to the MT4/MT5 software for specific data.
If you’d like more information, please don’t hesitate to contact info@vtmarkets.com.
Written on February 16, 2024 at 7:38 am, by anakin
Disclaimer: This article is for informational purposes only and should not be considered as financial advice. Investment decisions should be made based on your own research and risk assessment.
NVIDIA’s Remarkable Financial Surge: A 2024 Outlook
NVIDIA (NVDA) is a leading semiconductor company that has been building its legacy for the past two decades. Over the last 20 years, its stock has returned an eye-catching 25,514%. In this article, we will discuss the company’s outlook for 2024.
Company Snapshot
NVIDIA is popular for its innovative graphics processing units (GPUs) that power everything from gaming, automotive, and healthcare to AI. The company has been building its legacy for the past two decades and has established itself as a leader in the semiconductor industry.
Financial Performance
In fiscal year 2024, NVIDIA achieved remarkable financial results with a record-breaking revenue of $18.12 billion, exhibiting a staggering 206% increase compared to the previous year. This exceptional performance can be attributed to the company’s high-performing chips, which have been instrumental in driving its success throughout the fiscal year.
The Data Center segment experienced an astounding year-over-year growth of 279%, while the Gaming segment witnessed a substantial 81% growth. These two segments significantly contributed to the overall increase in revenue.
Looking ahead to the fourth quarter of fiscal year 2024, NVIDIA expects its revenue to reach approximately $20.00 billion, with a margin of error of plus or minus 2%. Furthermore, industry analysts have predicted an impressive revenue growth of 118% to reach $58.7 billion for the full fiscal year 2024. Additionally, they anticipate extraordinary growth in earnings per share (EPS) of 268.3% to reach $12.30 for the same period.
This revision ensures that the figures align logically, particularly regarding the projected annual revenue and growth rates.
Explore the future of investing with NVIDIA with VT Markets Shares CFD.
Investment Opportunity
Over the past two decades, NVIDIA has delivered an astonishing return of 25,514% to its stockholders, making it an incredibly lucrative investment.
The previous year proved to be a transformative period for the company as its shares experienced a remarkable surge of 238%. This substantial growth easily outpaced the gains of the tech-heavy NASDAQ Composite index, which recorded a 43% increase.
While the overall rise in tech stocks was largely influenced by the advancements in artificial intelligence (AI), NVIDIA’s exceptional performance can be attributed to its impressive quarterly results in fiscal year 2024, which surpassed market expectations.
Market analysts on Wall Street are optimistic about NVIDIA’s future growth prospects in the coming quarters. This positive sentiment could potentially drive the company’s stock even higher, potentially reaching the target price of $1,100, which is the highest price projection on the Street.
According to estimates compiled by FactSet, the average one-year price target for stocks within the Magnificent Seven (a term used to refer to a group of top-performing technology stocks) is approximately 11% higher than the closing price on Friday.
Notably, NVIDIA stands out with the highest expected share-price return, projected at about 34%. This is particularly impressive considering that the company already achieved a phenomenal gain of 239% and secured a prominent position on the S&P 500 leaderboard in the previous year.
Risk and Considerations
Despite the positive performance in the previous year, ongoing concerns surrounding the U.S.-China trade relations pose a significant challenge for NVIDIA to maintain its position as a dominant player in the semiconductor industry.
In October 2023, the U.S. Commerce Department implemented restrictions on the export of advanced computer chips to China. This development is noteworthy because approximately 20% to 25% of NVIDIA’s Data Center revenue originates from China and other countries affected by the new export limitations.
Consequently, NVIDIA expects a slight decline in revenue for the fourth quarter, although this may be partially offset by growth in other areas of the business. Taking into account these obstacles, the estimated revenue for the fourth quarter is projected to be approximately $20 billion, with a margin of error of plus or minus 2%.
This aligns with the predictions made by analysts, who anticipate a revenue figure of $20.03 billion for the same period.
Start Trading NVIDIA with VT Markets
Ready to explore the potential of NVIDIA stock in 2024? VT Markets offers a robust platform for trading NVIDIA shares CFDs, providing advanced tools and resources to help you succeed. Join VT Markets today and take the first step towards enhancing your investment portfolio with one of the top stocks to watch. Discover more at vtmarkets.net and start your trading journey now!
Written on February 16, 2024 at 5:57 am, by anakin
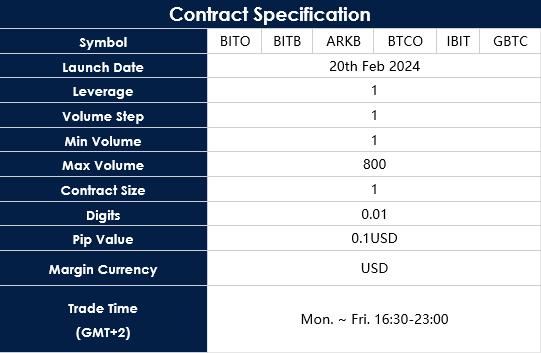
The above data is for reference only, please refer to the MT4 and MT5 software for specific data.
Friendly reminders:
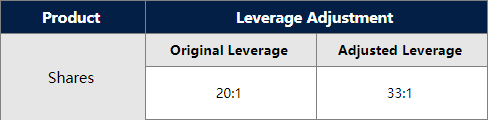
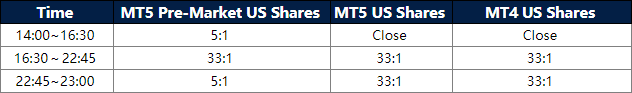
1. All specifications for Shares stay the same except leverage during the mentioned period.
2. The margin requirement of the trade may be affected by this adjustment. Please make sure the funds in your account are sufficient to hold the position before this adjustment.
If you’d like more information, please don’t hesitate to contact info@vtmarkets.com.
Written on February 16, 2024 at 3:15 am, by anakin
The S&P 500 notched its 11th record high of the year, leading a positive trend across major U.S. stock indexes, despite mixed economic indicators and a volatile week. Closing at 5,029.73, the index was up by 0.58%, with the Nasdaq and Dow Jones also finishing in the green, buoyed by standout performances from companies like Tesla, Meta Platforms, and Wells Fargo. This rebound comes amidst a backdrop of fluctuating retail sales data, uneven earnings reports, and shifting currency markets, highlighting the stock market’s resilience even as it navigates through economic uncertainties and global financial dynamics. The week’s events underscore the complex interplay between consumer strength, corporate health, and international economic policies, painting a multifaceted picture of the current financial landscape.
Stock market updates
The S&P 500 achieved a new record high, with all three major stock indexes, including the Nasdaq Composite and the Dow Jones Industrial Average, finishing in positive territory on Thursday. This recovery marks the S&P 500’s 11th record high of the year, as it managed to rebound from significant losses earlier in the week. The S&P 500 rose by 0.58% to close at 5,029.73, the Nasdaq Composite increased by 0.30% to 15,906.17, and the Dow Jones surged 0.91%, adding 348.85 points to close at 38,773.12. Notable performers included Tesla and Meta Platforms, with shares up 6% and 2% respectively, and Wells Fargo, which saw a 7% increase after a penalty from the Office of the Comptroller of the Currency was lifted.
Despite the positive close, the week presented mixed signals about the U.S. economy’s health and corporate America’s outlook. Retail sales in January fell by 0.8%, exceeding economists’ expectations of a 0.3% decline, fueling concerns about consumer strength amidst persistent inflation and high-interest rates. The earnings season has been inconsistent, with Tripadvisor’s shares jumping 9% after surpassing estimates. In comparison, Cisco faced a 2% decline after announcing layoffs and a dim sales forecast, and Deere’s stock fell 5% following a reduction in its full-year profit guidance. These developments came in a week marked by volatility, with the Dow experiencing its biggest one-day loss since March 2023 earlier in the week, yet it, along with the S&P 500, is set to end the week with slight gains, whereas the Nasdaq is projected to record a loss.
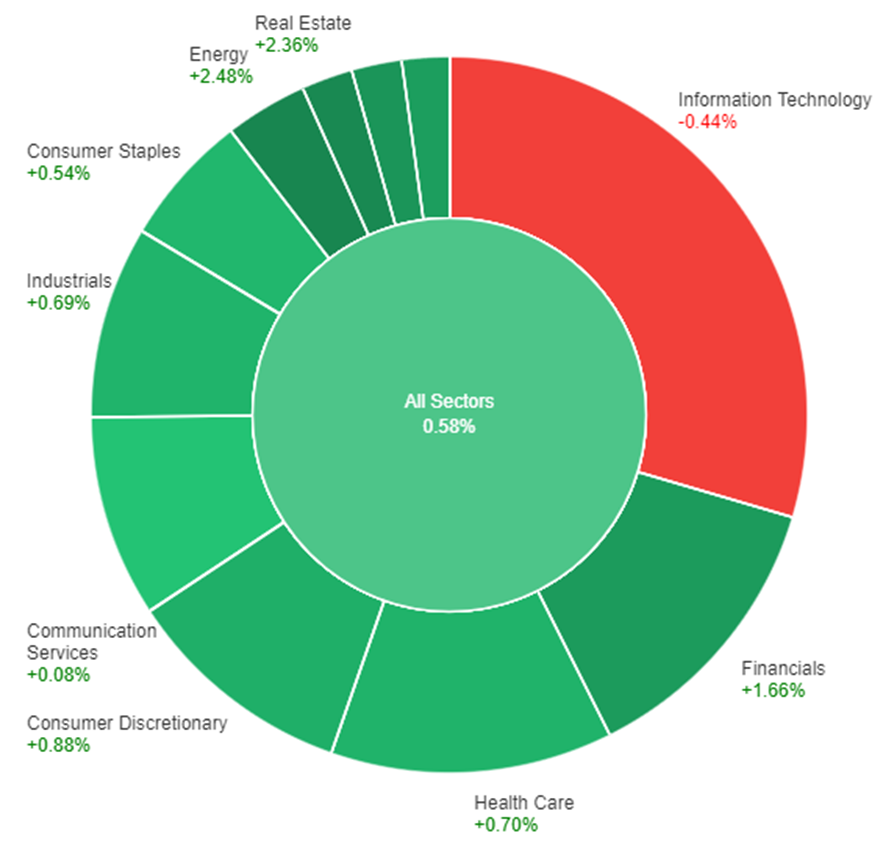
On Thursday, the overall market showed a positive trend with all sectors combined gaining +0.58%. The energy sector led the gains with a significant increase of +2.48%, closely followed by the real estate and materials sectors, which rose by +2.36% and +1.88%, respectively. Other sectors such as financials, utilities, consumer discretionary, and health care also saw increases, with financials up by +1.66% and health care by +0.70%. Industrials and consumer staples recorded modest gains. However, the communication services sector barely moved with a +0.08% increase, while the information technology sector was the only one to decline, dropping by -0.44%.
Currency market updates
In the currency markets, the U.S. dollar experienced a significant downturn following unexpectedly weak January retail sales, dropping 0.8% against a forecasted 0.1% decrease. This initial reaction was somewhat mitigated as the data’s validity was questioned due to potential seasonal adjustments and adverse weather conditions. Despite this, the dollar managed to recover slightly from its lowest points. Contributing to the economic landscape were other indicators like initial jobless claims and various regional Fed data, suggesting a stronger-than-anticipated economic performance and higher inflation signals. This mixed economic feedback, along with a recovery in two-year Treasury yields from initial drops, painted a complex picture of the U.S. financial health, influencing currency valuations.
Internationally, the currency markets saw movements influenced by the U.S. data and other global economic indicators. The USD/JPY pair declined by 0.4%, yet it remained above its recent lows, indicating resilience amidst broader trends and speculation about Japan’s monetary policy challenges. Meanwhile, the EUR/USD pair rose by 0.3%, buoyed by European Central Bank (ECB) policymakers’ resistance to rate cuts and market anticipations around monetary policy adjustments. The British pound also saw a modest increase, benefiting from the U.S. retail sales report’s fallout and optimistic comments from Bank of England officials. These currency movements underscore the interconnectedness of global economic indicators and central bank policies, with investors closely monitoring various data points and policy statements for future direction.
Picks of the day analysis
EUR/USD (4 hours)
EUR/USD nears key level amid speculation of Fed rate cut
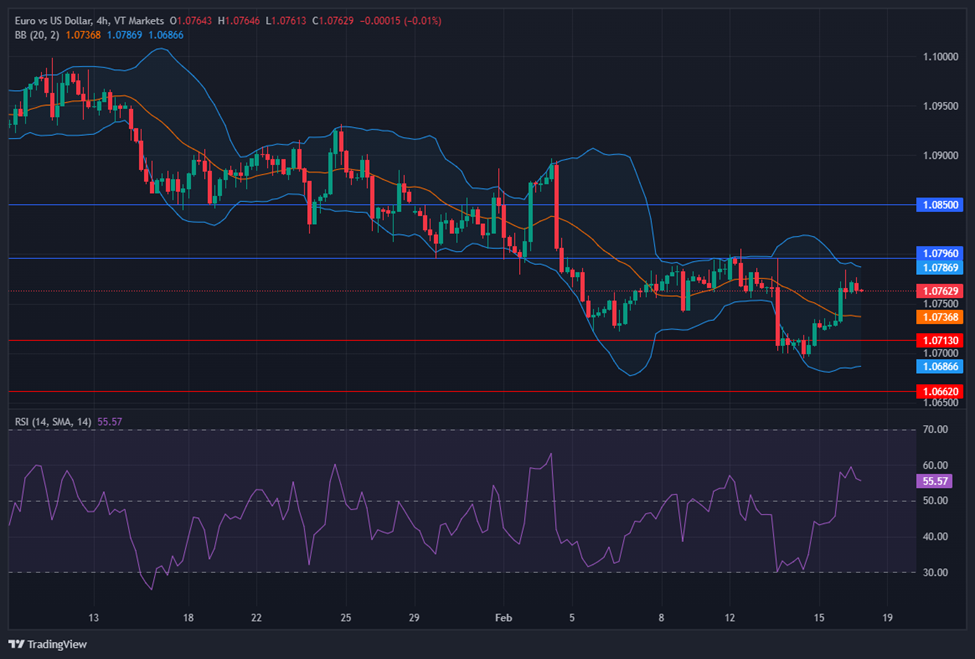
A moderate decline in the US dollar, coupled with a decrease in US bond yields, has pushed the EUR/USD pair closer to the significant 1.0800 level. This movement is underpinned by market speculation of a potential Federal Reserve interest rate cut later this year, with a 40% chance in May and nearly 50% in June according to the CME Group’s FedWatch Tool. The speculation gains ground following higher-than-expected US inflation data, despite strong fundamentals and a tight labor market. On the European side, ECB President Christine Lagarde points to strong wage pressures and a commitment to achieving a 2% inflation target, amidst the European Commission’s downward revision of eurozone GDP growth for 2024 and expectations of decelerating inflation.
On Thursday, the EUR/USD moved higher and was able to reach near the upper band of the Bollinger Bands. Currently, the price is moving between the upper and middle band, suggesting a potential slightly upward movement to reach above the upper band. Notably, the Relative Strength Index (RSI) maintains its position at 55, signaling a neutral outlook for this currency pair.
Resistance: 1.0796, 1.0850
Support: 1.0713, 1.0662
XAU/USD (4 hours)
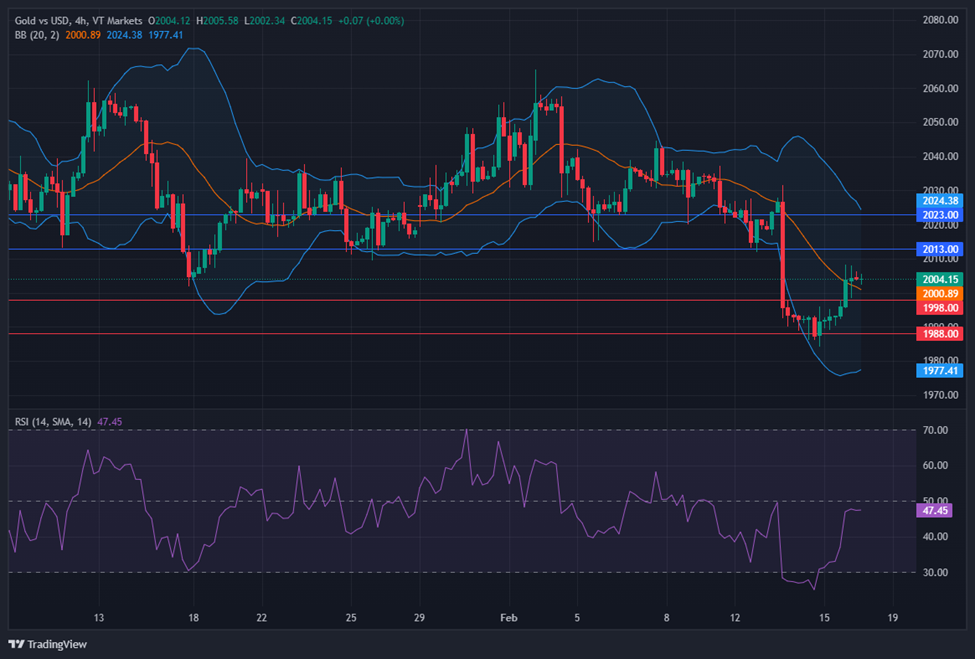
XAU/USD struggle to hold the $2,000 mark amid mixed US economic indicators
Gold prices saw an increase on Thursday, reaching a peak of $2,008.30, driven by a weakening US Dollar and mixed economic data from the United States. Despite an initial surge, XAU/USD lost momentum throughout the trading session, struggling to maintain its position above the $2,000 threshold. The decline in retail sales by 0.8% for January, significantly below the expected 0.1%, and a slight improvement in initial jobless claims did not suffice to sustain early gains. However, improvements in manufacturing indices from New York and Philadelphia offered some positive economic signals. These developments led to fluctuating government bond yields and a partial recovery in the US Dollar, affecting gold prices amidst a complex economic backdrop.
On Thursday, XAU/USD moved higher and was able to reach above the middle band of the Bollinger Bands. Currently, the price is moving slightly above the middle band, suggesting a potential upward movement to reach the upper band. The Relative Strength Index (RSI) stands at 47, signaling a neutral outlook for this pair.
Resistance: $2,013, $2,023
Support: $1,998, $1,988
Economic data
Currency
Data
Time (GMT + 8)
Forecast
GBP
Retail Sales m/m
15:00
1.5%
USD
Core PPI m/m
21:30
0.1%
USD
PPI m/m
21:30
0.1%
USD
Prelim UoM Consumer Sentiment
23:00
80.0
Written on February 16, 2024 at 2:28 am, by anakin
As part of our commitment to provide the most reliable service to our clients, there will be server maintenance this weekend.
Maintenance Hours :
17th of February 2024 (Saturday) 00:00-05:00 (GMT+2)
Please note that the following aspects might be affected during the maintenance:
1. The price quote and trading management will be temporarily disabled during the maintenance. You will not be able to open new positions, close open positions, or make any adjustments to the trades.
2. There might be a gap between the original price and the price after maintenance. The gaps between Pending Orders, Stop Loss and Take Profit will be filled at the market price once the maintenance is completed. If you don’t want to hold any open positions during the maintenance, it is suggested to close the position in advance.
3. Please refer to MT4/MT5 for the latest update on the completion and market opening time. Our services will be back online once the maintenance is completed.
4. Please note that during the maintenance period, the Client Portal and VT App may be unable to operate or unable to log in.
Thank you for your patience and understanding about this important initiative.
If you’d like more information, please don’t hesitate to contact info@vtmarkets.com
Written on February 15, 2024 at 9:27 am, by anakin
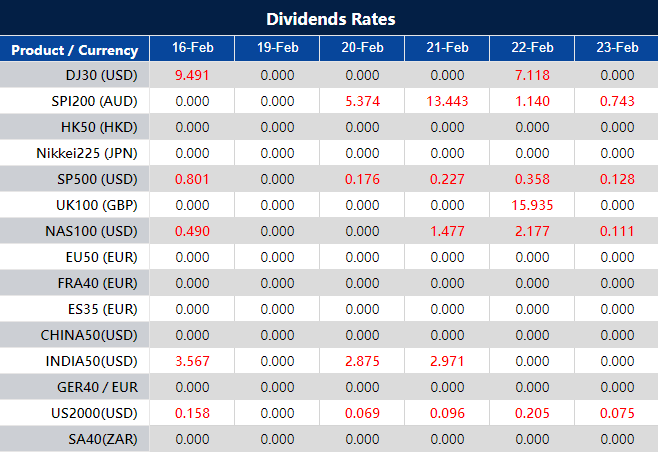
Please note that the dividends of the following products will be adjusted accordingly. Index dividends will be executed separately through a balance statement directly to your trading account, and the comment will be in the following format “Div & Product Name & Net Volume ”.
Please refer to the table below for more details:
The above data is for reference only, please refer to the MT4/MT5 software for specific data.
If you’d like more information, please don’t hesitate to contact info@vtmarkets.com.
Written on February 15, 2024 at 7:50 am, by anakin
On Wednesday, the stock market witnessed a significant rebound, with the S&P 500, Nasdaq Composite, and Dow Jones Industrial Average posting notable gains, driven in part by Lyft’s shares soaring 35% after reporting impressive fourth-quarter earnings. This rally followed a sharp downturn on Tuesday, spurred by concerns over inflation and the Federal Reserve’s interest rate policies. The market’s recovery was also reflected in the currency markets, where the dollar index dipped slightly, and currency pairs like EUR/USD saw modest gains. These movements came in the wake of comments from Federal Reserve officials and the latest CPI data, which led to a recalibration of expectations regarding the timing of potential rate cuts, now more likely in the second half of 2024, and influenced currency market dynamics significantly.
Stock Market Updates
On Wednesday, the stock market saw a positive shift as major indexes rebounded from the significant losses experienced in the prior session. The S&P 500 increased by 0.96% to close at 5,000.62, the Nasdaq Composite rose by 1.3% to end at 15,859.15, and the Dow Jones Industrial Average grew by 0.4%, adding 151.52 points to finish at 38,424.27. This recovery was notably led by shares of Lyft, which surged by 35% following the ride-hailing company’s announcement of better-than-expected earnings for the fourth quarter. However, not all shares experienced gains, as Airbnb’s stock fell by 1.7% despite the company surpassing revenue expectations in its latest quarter.
The upward movement in the stock market came after a tumultuous Tuesday, where indexes such as the Dow, S&P 500, and Nasdaq Composite all slumped by more than 1%, marking the Dow’s worst day since March 2023. This sell-off was triggered by a hotter-than-anticipated inflation report, causing concern among traders that the Federal Reserve might delay cutting interest rates, a move previously anticipated by some to occur as early as March. The January CPI report has adjusted expectations, suggesting that any potential rate cuts by the Fed are more likely to happen in the second half of 2024, reflecting investors’ recalibrated outlooks on monetary policy amidst ongoing inflation concerns.
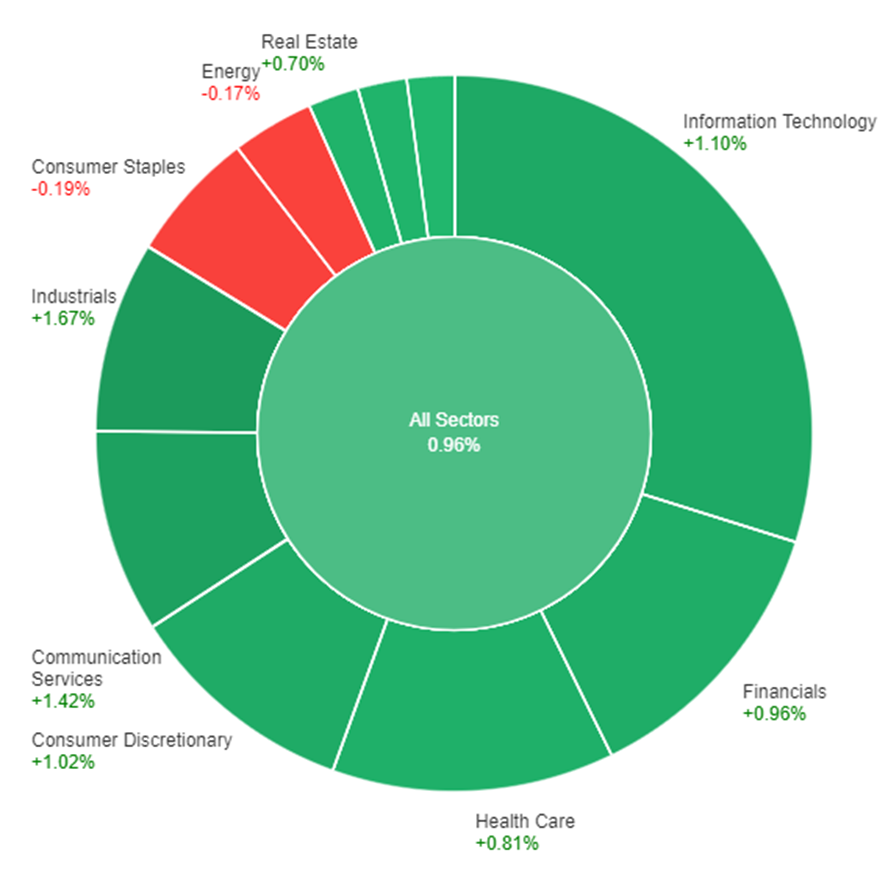
On Wednesday, the stock market experienced broad gains across most sectors, with the overall sectors index rising by 0.96%. Industrials led the charge with a significant increase of 1.67%, followed closely by Communication Services and Information Technology, which saw gains of 1.42% and 1.10%, respectively. Other sectors showing notable performance included Consumer Discretionary, Financials, and Health Care, with increases of 1.02%, 0.96%, and 0.81%, respectively. Real Estate, Materials, and Utilities also experienced positive movement, albeit at a slower pace. In contrast, the Energy and Consumer Staples sectors faced slight declines, dropping by 0.17% and 0.19%, respectively, indicating a mixed but predominantly positive day in the market.
Currency Market Updates
The currency market experienced notable movements as the dollar index saw a decrease of 0.25%, influenced by a mix of factors including the consolidation of gains post-Tuesday’s Consumer Price Index (CPI) announcement and remarks from Chicago Fed President Austan Goolsbee, who suggested that the market’s reaction to the inflation data might have been excessive. Goolsbee’s comments, emphasizing that the recent CPI report does not alter the ongoing downtrend in inflation, were particularly impactful despite the core CPI’s 3-month annualized rate climbing to its highest since June. This dovish perspective from Goolsbee, alongside a drop in Treasury yields, led to a shift in market expectations, increasing the probability of a Federal Reserve rate cut in May and adjusting the outlook for 2024 cuts.
In currency pairs, the EUR/USD pair experienced a slight recovery, rising 0.2% after initially dropping below 1.0700, reacting to the surging U.S. Treasury yields and the recalibration of Federal Reserve rate cut expectations following the U.S. CPI data. This movement underscores the sensitivity of currency markets to interest rate expectations and inflation data, with the euro finding some support despite facing pressure from the anticipated earlier and more significant rate cuts by the European Central Bank compared to the Fed. Meanwhile, other major currencies like the British pound and the Japanese yen also showed varied reactions to the shifting economic indicators and central bank sentiments, highlighting the intricate dynamics influencing the currency markets amidst evolving economic landscapes.
Picks of the Day Analysis
EUR/USD (4 Hours)
EUR/USD Rebounds Amid USD Pullback and Fed Rate Cut Speculation
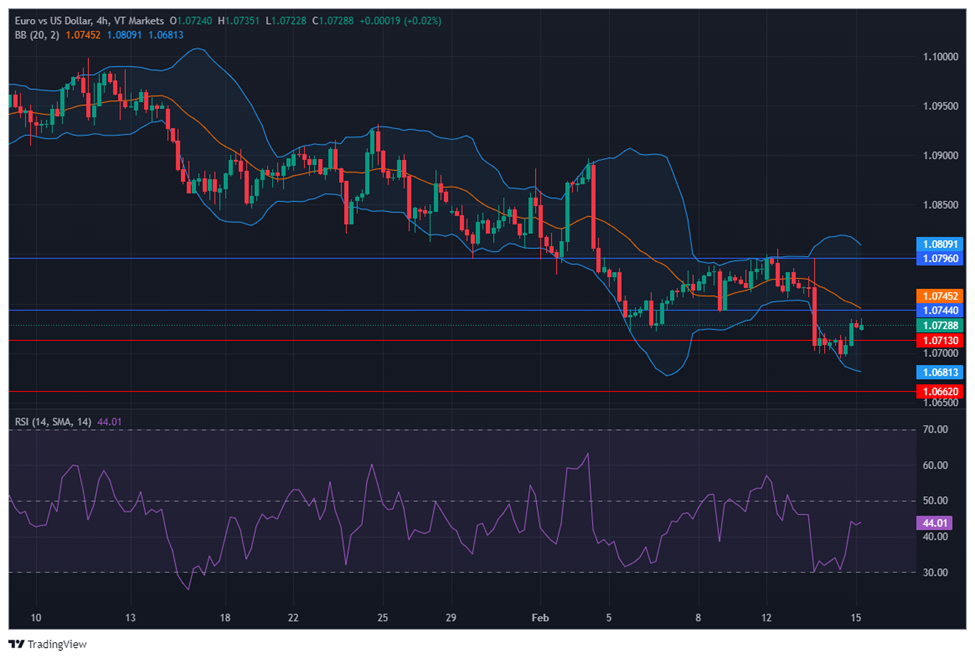
The EUR/USD pair witnessed a rebound as the US dollar experienced a modest retracement, driven by a pullback in US yields and profit-taking after recent gains. This movement was influenced by the anticipation of potential Federal Reserve monetary easing, possibly starting in June, in response to higher-than-expected US inflation figures. Market odds, according to the CME Group’s FedWatch Tool, suggest a growing probability of a Fed rate cut, with significant expectations for a reduction by the June meeting. Meanwhile, Federal Reserve and ECB officials highlighted the importance of cautious monetary policy adjustments amidst inflation concerns and geopolitical risks, indicating a complex environment for future rate decisions and their implications for currency movements.
On Wednesday, the EUR/USD moved higher and reached near the middle band of the Bollinger Bands. Currently, the price is moving just below the middle band, suggesting a potential slightly upward movement to reach above the middle band. Notably, the Relative Strength Index (RSI) maintains its position at 44, signaling a neutral outlook for this currency pair.
Resistance: 1.0744, 1.0796
Support: 1.0713, 1.0662
XAU/USD (4 Hours)
XAU/USD Recovery Amid Weakening USD and Optimistic Market Sentiments
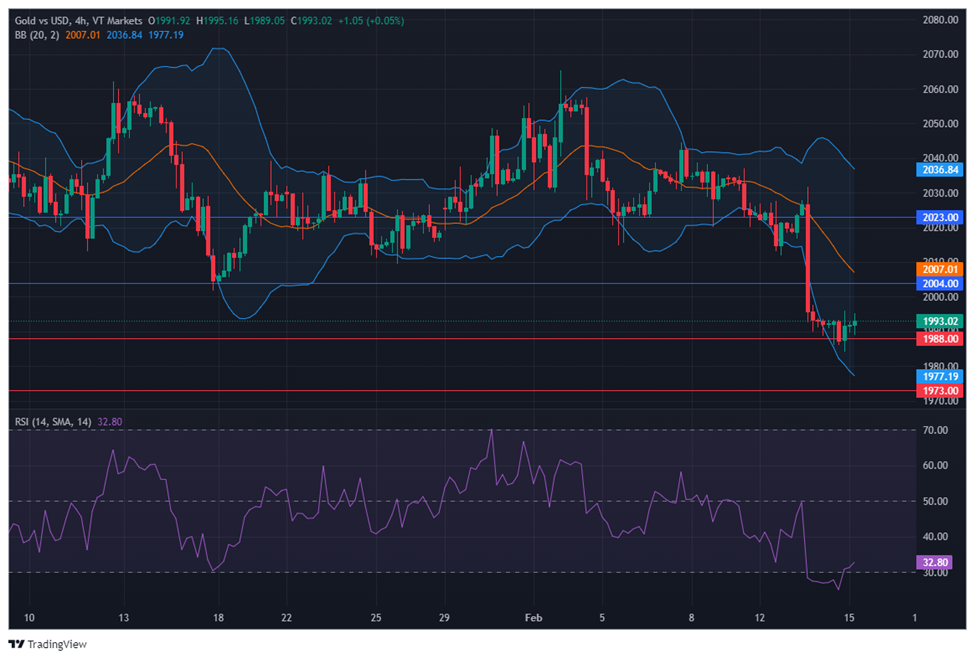
Gold (XAU/USD) witnessed a dip to its lowest since last December at $1,984.03, only to rebound above the $1,900 threshold as the US Dollar weakened due to improved market sentiments and a rally on Wall Street. This shift came despite the global central banks’ firm stance against easing monetary policy, underscored by recent macroeconomic data indicating persistent inflation and tight labor markets, especially in the US. The unexpected rise in January’s inflation and strong Nonfarm Payrolls report has quashed immediate hopes for a Federal Reserve rate cut, as affirmed by Fed Chairman Jerome Powell, emphasizing a cautious yet optimistic outlook for the economy.
On Wednesday, XAU/USD moved flat and moved between the lower and middle bands of the Bollinger Bands. Currently, the price is moving above the lower band, suggesting a potential upward movement to reach the middle band. The Relative Strength Index (RSI) stands at 32, signaling a bearish outlook for this pair.
Resistance: $2,004, $2,023
Support: $1,988, $1,973
Economic Data
Currency
Data
Time (GMT + 8)
Forecast
AUD
Employment Change
08:30
0.5K (Actual)
AUD
Unemployment Rate
08:30
4.1% (Actual)
GBP
GDP m/m
15:00
-0.2%
USD
Core Retail Sales m/m
21:30
0.2%
USD
Empire State Manufacturing Index
21:30
-13.7
USD
Retail Sales m/m
21:30
-0.2%
USD
Unemployment Claims
21:30
219K
Written on February 15, 2024 at 1:23 am, by anakin