New contracts will automatically be rolled over as follows:
Please note:
• The rollover will be automatic, and any existing open positions will remain open.
• Positions that are open on the expiration date will be adjusted via a rollover charge or credit to reflect the price difference between the expiring and new contracts.
• To avoid CFD rollovers, clients can choose to close any open CFD positions prior to the expiration date.
• Please ensure that all take-profit and stop-loss settings are adjusted before the rollover occurs.
• All internal transfers for accounts under the same name will be prohibited during the first and last 30 minutes of the trading hours on the rollover dates.
If you’d like more information, please don’t hesitate to contact info@vtmarkets.com.
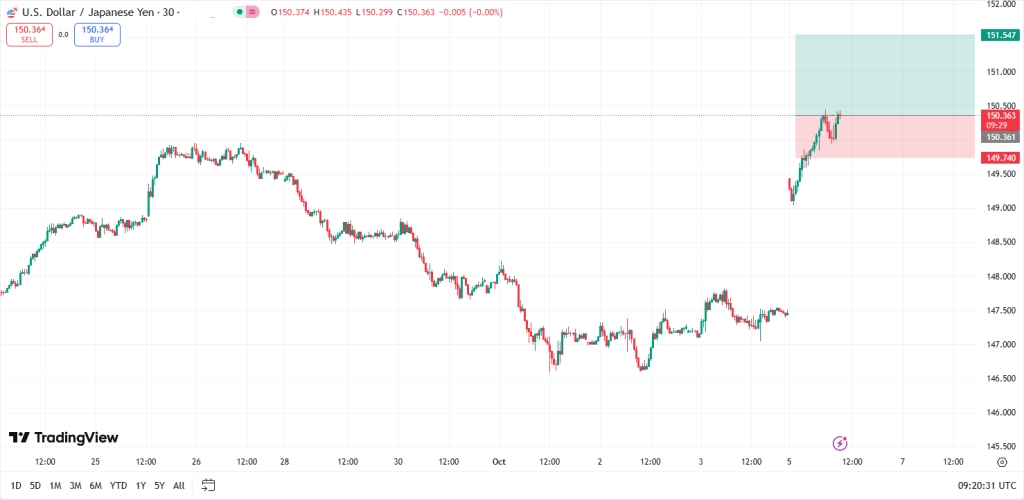
USD/JPY trades in a tight range near 146.80 to 147.20, with traders digesting key macro developments from both the U.S. and Japan. Earlier this week, Federal Reserve officials offered mixed views on the rate outlook, keeping yield volatility elevated. Meanwhile, attention now shifts to the upcoming CPI release in Japan, which could influence policy expectations of the Bank of Japan (BoJ) and yen sentiment heading into the weekend.
Inflation challenge in Japan and stance taken by the BoJ
Recent data out of Japan shows persistent inflationary pressure, with core CPI remaining above the 2% target of the BoJ. Despite this, the BoJ has maintained its loose monetary policy, citing fragile domestic demand and wage growth concerns. Governor Ueda’s cautious tone has kept rate hike expectations muted, allowing the yen to remain under pressure against the dollar.
U.S. Fed rate cut speculation adds fuel
In contrast, the Federal Reserve faces growing calls for easing, especially after mixed labor data last week and signs of slowing consumer demand. While some Fed officials remain hawkish, others have hinted at a shift toward employment-focused policy. This divergence has created volatility in U.S. yields, which in turn influences USD/JPY flows.
Technical analysis: USD/JPY eyes breakout
Technically, USD/JPY is hovering near the 147.00 to 147.50 zone. A confirmed breakout above 147.80 would signal bullish continuation toward multi-month highs, with upside targets at 148.50 and 149.35. On the downside, a break below 146.00 would invalidate the bullish bias and open room for a deeper correction.
Resistance: 147.80, 148.50, 149.35
Support: 146.20, 145.20, 144.40
Bullish setup: Long entries on pullbacks to 146.20 or breakout above 147.80, targeting 148.50 and 149.35.
Bearish setup: Short positions if price rejects 147.80 or breaks below 146.00, with downside targets at 145.20 and 144.40.
Range play: Tactical trades within 146.00–147.80 until a breakout confirms direction.
CPI and Fed commentary: The drivers to watch
With USD/JPY sitting at a technical inflection point, traders should monitor the CPI release in Japan for confirmation. Yield differentials and risk sentiment will likely dictate whether the pair breaks higher or reverses course.
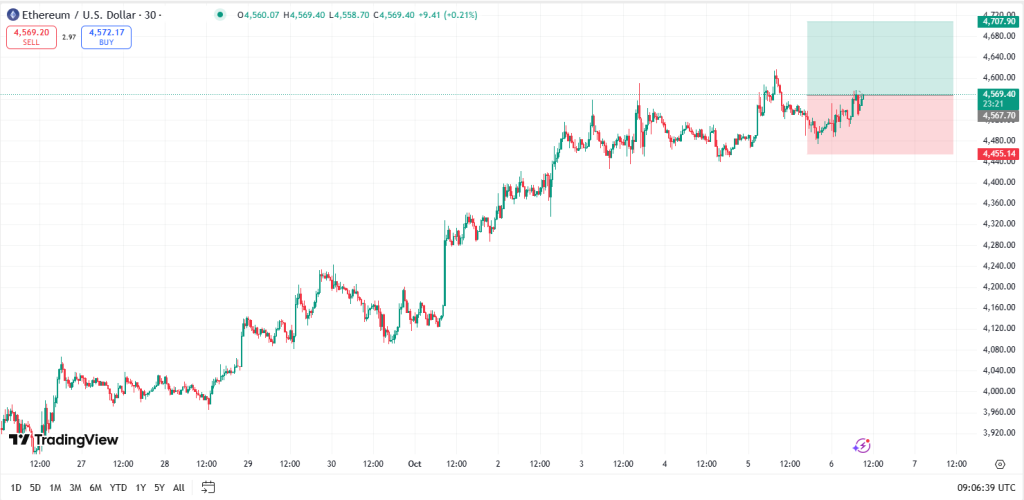
Ethereum (ETH/USD) opens the week consolidating near $4,300, with markets watching for a decisive move above the $4,340 to $4,385 resistance zone. The setup comes in the face of shifting macro conditions and evolving crypto market dynamics, including renewed speculation around Federal Reserve rate cuts and a potential rotation into altcoins as Bitcoin dominance shows signs of faltering.
Rate cut bets and altcoin rotation
Stronger-than-expected U.S. GDP revision and falling jobless claims last week have complicated the policy outlook of the U.S. Federal Reseerve. While some officials urge caution, others hint at a pivot toward employment-focused easing. This ambiguity has kept rate cut speculation alive, supporting risk assets including crypto.
Meanwhile, Bitcoin dominance has stalled long enough, prompting traders to explore altcoin opportunities. Historically, such pauses in BTC leadership have preceded “altcoin seasons,” where assets like Ethereum outperform. The technical setup of Ethereum suggests it may be ready to lead that charge.
Technical analysis: Ethereum tests key resistance zone
ETH is currently consolidating near $4,300, testing resistance around $4,340 to $4,385. A sustained breakout above $4,385 would confirm bullish momentum and open the path toward $4,420 and $4,500, with $4,800+ possible under strong flow. Conversely, failure to hold above $4,250 could trigger a pullback toward $4,160 or even $4,000.
Resistance: $4,385, $4,420, $4,500, $4,800
Support: $4,250, $4,220, $4,160, $4,000
Bullish setup: Long entries on breakout above $4,385 or dips into $4,220 to $4,250 if support holds.
Bearish setup: Short or hedge positions if price rejects resistance or breaks below $4,220.
Range play: Trade within $4,220 to $4,385 until breakout confirms direction, using tight stops.
What you should look out for
With Ethereum opening near $4,300 to $4,330, early-week volatility will likely hinge on macro headlines and crypto sentiment. Traders should monitor Bitcoin dominance, Fed commentary, and volume confirmation to validate positioning. A clean breakout could mark the start of a broader altcoin rally.
Please note that the dividends of the following products will be adjusted accordingly. Index dividends will be executed separately through a balance statement directly to your trading account, and the comment will be in the following format “Div & Product Name & Net Volume”.
Please refer to the table below for more details:
The above data is for reference only, please refer to the MT4/MT5 software for specific data.
If you’d like more information, please don’t hesitate to contact info@vtmarkets.com.
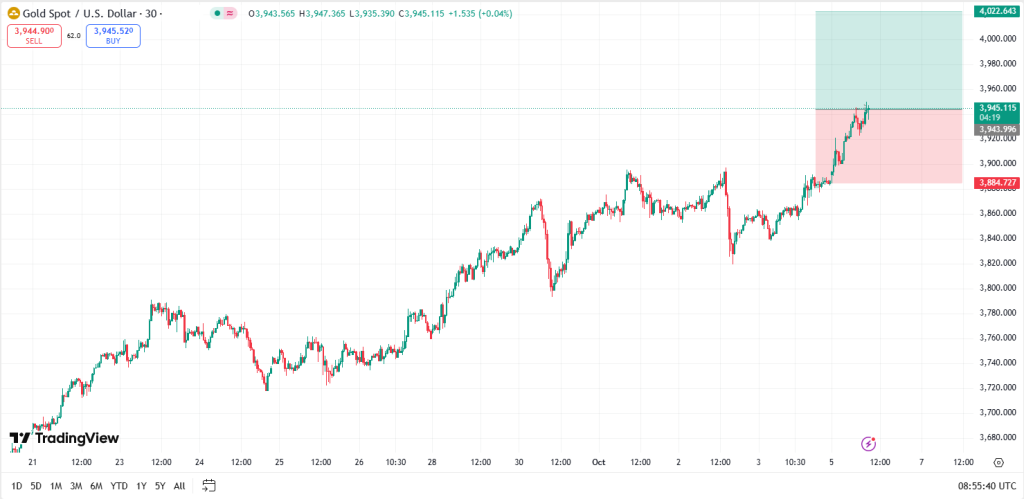
Gold (XAU/USD) enters the week with bullish momentum after confirming a breakout above the $3,750 to $3,760 consolidation zone. The move comes on the heels of macroeconomic surprises last week, including a sharp drop in U.S. jobless claims and an upward revision to Q2 GDP growth, which is now at 3.8%, the highest in two years. While these figures suggest economic resilience, the rate path of the Federal Reserve is further complicated with officials offering mixed signals on future policy.
Macro drivers: Strong data but mixed signals from the Fed
The strength of the labor market and GDP revision have cooled immediate rate cut expectations, but Fed officials remain divided. Some emphasise caution, while others shift focus toward employment and liquidity reform, highlighting the TGCR as a potential benchmark alternative. This uncertainty has kept yields volatile and the dollar reactive, creating a supportive backdrop for gold as investors seek clarity.
Technical analysis: Breakout above $3,760 sets bullish tone
Gold has broken above the $3,750 to $3,760 range, turning former resistance into support. A sustained daily close above $3,820 would further validate the breakout and likely attract momentum buyers.
Resistance: $3,820, followed by $3,860 then $3,900
Support: $3,760, followed by $3,720 then $3,660
Bullish setup: Long entries on dips toward $3,760 or breakout continuation above $3,820.
Bearish setup: Short positions if price rejects $3,820 with confirmation.
Range play: Tactical trades within $3,760 to $3,820 until breakout confirms direction.
Data-driven volatility: What you should monitor
With gold opening near $3,790 to $3,810, early-week price action will likely hinge on follow-through from economic data last week and upcoming Fed commentary. Traders should watch for volume confirmation and macro headlines to validate positioning, especially as markets digest the implications of stronger-than-expected U.S. growth.
Please note that the dividends of the following products will be adjusted accordingly. Index dividends will be executed separately through a balance statement directly to your trading account, and the comment will be in the following format “Div & Product Name & Net Volume”.
Please refer to the table below for more details:
The above data is for reference only, please refer to the MT4/MT5 software for specific data.
If you’d like more information, please don’t hesitate to contact info@vtmarkets.com.
The question isn’t whether altcoin season will happen. It’s when. Every major crypto cycle begins the same way: Bitcoin (BTC) leads, stabilises, and hands the rally baton to smaller coins.
The last two rotations, in 2017 and 2021, each saw the Bitcoin dominance collapse from above 70% to around 40%, unlocking explosive rallies across Ethereum (ETH), Ripple (XRP), and a long list of smaller assets.
A long-simmering clash between Bitcoin purists and altcoin advocates is reaching a high-stakes battleground: the corporate-treasury boom https://t.co/w3SryDRwJq
Now, the pattern is re-emerging. The market share of Bitcoin has slipped below 59%, its weakest since early 2024, while the total market capitalisation of altcoins has climbed to roughly USD 1.69 trillion.
Analysts are eyeing USD 2.3 trillion as the line that would confirm a full rotation of capital into non-BTC assets.
Beneath those headline numbers, DeFi activity is picking up again, transaction volumes are trending higher, and large wallets are quietly accumulating mid-cap tokens.
Bitcoin set a fresh record on Sunday for the first time since mid-August, as the US government shutdown drove investors to safe-haven assets in a migration dubbed the “debasement trade” https://t.co/qmqFvllG7n
Institutional inflows into altcoin-focused ETFs are beginning to build momentum, marking a return of patient, structured capital to a market that’s long been ruled by emotion.
Liquidity finds the market
Macro conditions are also turning more favourable. In September, the Federal Reserve trimmed rates by 25 basis points, the first cut in months. Fed Chair Powell hinted that more could follow before year-end. The US M2 money supply has surged to USD 22 trillion, its fastest expansion in a year and a half.
Federal Reserve interest-rate cuts are likely to lead to an economic rebound next year that spurs investors to bet on rate increases by late-2027, Citigroup strategists say https://t.co/ZD1y4V4sNz
Historically, periods of rapid liquidity growth have coincided with stronger risk sentiment, and crypto has often been the earliest to respond. If policy stays on this trajectory, liquidity could fuel an altcoin rally well into early 2026.
Retail curiosity returns
Retail traders are starting to take notice. Google searches for “altcoins” have jumped 40–50% since late September, while social engagement around ETH, Solana (SOL), and Chainlink (LINK) has surged.
These early signs of retail curiosity mirror the build-up seen before previous altseasons. The leaders are already breaking ahead: XRP, SUI, and LINK have shown relative strength against BTC, often the first clue that capital is rotating toward higher-beta names.
Wall Street, crypto industry say tokenization will reshape global markets: 'It’s going to eat the entire financial system' https://t.co/QpMZU3wZDr
Still, traders should tread carefully. The popular altcoin season index measuring how many top-100 coins outperform BTC has already crossed the 80 mark this year but failed to trigger a true rally. Many smaller coins barely moved, showing that the indicator is often backward-looking.
In reality, most of the money is made before the data confirms it. That’s why analysts focus instead on BTC dominance trends, altcoin market cap acceleration, and DeFi liquidity growth.
Has the altseason begun?
If these signals continue to align, the next altcoin season could emerge between October 2025 and February 2026. Timing, however, remains tied to macro catalysts. Faster rate cuts, approvals for spot ETFs, or regulatory milestones such as the U.S. Clarity Act could accelerate the cycle.
On the other hand, any delay in easing or a sudden risk-off move could push the timeline back.
This cycle may be larger in scale but narrower in scope. Some forecasts project that total altcoin market capitalisation could eventually reach USD 15 trillion, driven by institutional adoption and the tokenisation of real-world assets. Yet unlike the 2017 frenzy, the rally may centre on fewer names.
Institutional money prefers liquidity and compliance, meaning capital could cluster around established ecosystems rather than scatter across thousands of speculative tokens.
For traders, that shift changes the strategy. The coming altcoin cycle may reward precision more than speculation. Watching how liquidity, regulation, and macro policy evolve will be key. If history holds true, what’s forming now beneath BTC’s surface may soon become the market’s next major rotation.
Key movements of the week
The first week of October opened with a cautious tone as traders digested mixed macro signals.
The US dollar index (USDX) extended its climb from the 97.00 monitored zone, opening the week with a gap higher. Traders are watching 98.05 closely as the next key resistance level. While the broader uptrend remains intact, the index could enter a larger consolidation phase if momentum slows. In that case, buying interest is likely to reappear near 96.85 or 96.60, where previous rebounds have formed.
EURUSD mirrored this strength in reverse, sliding lower after gapping down from the 1.1805 resistance zone. The pair’s structure suggests continued downside pressure unless it can sustain a move above 1.1800, where sellers are expected to defend.
GBPUSD followed a similar trajectory, extending its decline from the previous week and finding short-term interest around 1.3395. Any recovery toward 1.3540 could face renewed selling as markets await fresh guidance from the Bank of England.
USDJPY gapped higher in line with last week’s bullish bias, edging closer to breaking the 149.95 high before a potential consolidation. A confirmed breakout could see momentum extend toward 150.911, a level that would test the patience of Japan’s policymakers.
USDCHF, meanwhile, slipped from the 0.8000 zone and now trades within a consolidation band. Should price dip further, buyers are expected to defend the 0.7915 level to maintain upward structure.
Among the commodity-linked currencies, AUDUSD opened the week with a gap lower before stabilising near 0.6570. If recovery extends, traders will monitor 0.6650 for bearish price action.
The NZDUSD chart paints a similar picture: after dropping early in the week, price rebounded from the 0.5790 zone. Resistance remains between 0.5860 and 0.5890, with potential for sellers to re-enter if risk sentiment weakens.
Commodities extended their retracement.
Gold surged to a fresh all-time high, testing the USD 3,915 resistance area as investors sought safety amid global rate uncertainty. A breakout above this level could open the door toward USD 4,075, though the move appears stretched after a strong run. Traders are closely watching for profit-taking signals before committing to new longs.
Oil, meanwhile, is attempting to recover after weeks of losses. A sustained move above USD 62.665 would signal that buyers are regaining control, though fundamentals remain fragile amid uneven demand expectations. Any rejection at this zone could see prices retreat toward prior support levels near the low-60s.
Equities entered October on firmer ground but are showing fatigue.
The S&P 500 continues to face resistance near 6,750, where price action suggests sellers are beginning to reassert control. Should momentum persist, 6,840 marks the next area of interest. Broader sentiment remains cautious as markets await clarity on Fed policy and Q4 earnings guidance.
Bitcoin, by contrast, is once again stealing the spotlight. The world’s largest cryptocurrency surged to a new record above USD 125,700 on Sunday, breaking through resistance with strong volume.
If consolidation patterns hold, analysts see scope for another leg higher toward $135,000. The move underscores the broader divergence between traditional and digital assets, where equity traders are treading water, crypto investors appear to be gearing up for the next rally.
Key events of the week
The week ahead offers a calmer start before major data hits midweek, setting the tone for currency and rate expectations heading into mid-October.
Tuesday brings two key central-bank speeches. ECB President Lagarde and BoE Governor Bailey are both scheduled to speak, and markets will be listening closely for clues on future interest-rate management. The euro and pound have traded in tight ranges in recent sessions, but any hawkish tone could revive volatility as traders recalibrate rate-cut expectations for year-end.
On Wednesday, the Reserve Bank of New Zealand will announce its Official Cash Rate, currently forecast at 2.75 % versus 3.00 % previously. A dovish reduction would confirm policymakers’ shift toward easing after months of slowing growth, potentially pressuring the New Zealand dollar. Traders are watching for selling opportunities on NZDUSD should price action make another attempt higher.
The focus then shifts to Friday, when the macro calendar accelerates. RBA Governor Bullock is set to speak, and markets expect remarks tied to Australia’s softer inflation outlook and the potential for further easing.
The same session will bring the all-important US Non-Farm Employment Report, with payrolls expected to rise by 51 K versus 22 K previously, while the unemployment rate is projected to hold at 4.3 %. Stronger-than-expected numbers could dampen speculation of additional Fed cuts, offering a temporary lift to the dollar; weaker data would reinforce the dovish bias that has underpinned recent market moves.
Later in the day, the University of Michigan Consumer Sentiment Index rounds out the week, with forecasts pointing to 54.6 versus 55.1 previously.
Any surprise rebound could suggest consumer resilience despite policy uncertainty, while further softening would fit the slowing-growth narrative that has shaped investor sentiment through early October.
Looking ahead, the following week will be heavier on data, featuring US CPI, PPI, and Retail Sales, alongside UK GDP, all due between 15–16 October 2025. These releases will provide the next key test of whether the global easing narrative can sustain its grip on markets or if inflation pressures return to complicate the picture.
Please note that the dividends of the following products will be adjusted accordingly. Index dividends will be executed separately through a balance statement directly to your trading account, and the comment will be in the following format “Div & Product Name & Net Volume”.
Please refer to the table below for more details:
The above data is for reference only, please refer to the MT4/MT5 software for specific data.
If you’d like more information, please don’t hesitate to contact info@vtmarkets.com.
The euro traded around $1.1738 on Friday, as implied volatility in the options market dropped to its lowest level in nearly a year. Three-month implied volatility for EUR/USD fell to 6.470%, marking its weakest point since November 2024.
Despite the calm backdrop, positioning remains tilted toward euro strength. Traders continue to show favour towards call options over puts, with the three-month risk reversals holding ground.
The European Union’s progress toward a multitrillion euro savings and investment union is being hampered by member states defending their own national interests, the bloc’s financial services chief said https://t.co/HhKzhO92Nw
Analysts suggest this drop in volatility is less about fading interest in EUR/USD moves and more about expectations of quieter market conditions.
The reduction in expected swings is partly tied to the ongoing U.S. government shutdown, which has delayed the release of crucial economic data, including the nonfarm payrolls report. With the Federal Reserve’s policy outlook clouded by a lack of fresh data, traders are less inclined to price in sharp moves in the near term.
EUR/USD technical analysis
The EUR/USD pair is trading at 1.1738, up 0.19% on the day, showing mild strength after a period of consolidation. The pair has been trapped in a sideways range between 1.1500–1.1900 since mid-summer, with momentum stalling despite attempts to break higher.
From a technical perspective, the 50-day moving average continues to act as a dynamic support zone, while the resistance at 1.1918 (July high) remains the key barrier to overcome for further upside.
The long consolidation suggests that the market is waiting for a catalyst like US macro data, ECB policy signals, or developments in the ongoing US government shutdown to determine the next breakout direction.
The MACD shows a flat momentum structure, with both signal and MACD lines hovering close together around the zero line, reflecting a lack of strong directional conviction. The histogram has turned slightly positive, hinting at modest bullish bias, but without strong follow-through.
Cautious forecast in the currency pair
For traders, the setup remains range-bound. A sustained move above 1.1900 could unlock upside potential toward 1.2050, while a break below 1.1500 risks a decline toward the 1.1300 support zone.
Until then, EUR/USD may continue to drift sideways with low volatility, making short-term scalping or range strategies more favourable than trending plays.
The stage is set for a high-stakes showdown in Washington as the Supreme Court prepares to hear arguments in November on whether President Trump overstepped his authority by imposing emergency tariffs through the International Emergency Economic Powers Act.
The legal fight over President Donald Trump’s global tariffs is deepening after a federal appeals court ruled the levies were issued illegally under an emergency law, extending the chaos in global trade. https://t.co/crYguoeJ7X
These duties, levied at rates ranging from 10 to 50 per cent on imports from Canada, Mexico, China, and beyond, drove the U.S. effective tariff rate to levels last seen in the 1930s.
They were projected to generate between 2.3 trillion and 3.3 trillion dollars over a decade, yet the legal challenge now threatens to unwind the entire structure and force a historic refund that could reshape fiscal planning for years.
If cancellation comes, the first impulse of equity markets would be to cheer. Companies that saw their margins thinned by inflated import costs would find sudden relief, with consumer electronics, auto parts, and agriculture leading the charge.
US equities have defied virtually every warning in the past five months, but Wall Street veterans see reasons for worry https://t.co/mLSiTay4fG
Inflation, which budget researchers estimate was lifted by 1.7 percentage points due to tariffs, could fall closer to 0.5 percent, loosening the grip that rising prices have held on the Federal Reserve. That shift would hand policymakers more freedom to cut rates, adding to momentum for equities.
In the first stage of adjustment, this is a market that rallies rather than collapses, with traders bidding up stocks that gain most directly from lower trade frictions.
The second stage of the sequence is less comfortable. Trump’s tariffs have already pulled in more than 150 billion dollars, but refunds linked to accrued collections and interest could reach 750 billion to 1 trillion dollars. That liability would hit a Treasury already facing annual deficits above 2 trillion dollars.
To fund it, more bonds would have to be issued into a market where supply is already heavy and debt-servicing costs are rising. Traders would likely demand higher yields to absorb the glut, and those yields would in turn ripple through the economy, raising borrowing costs for companies and households alike.
Equities may rally on disinflation in the short term, but higher yields could ultimately cap gains and drag valuations back down.
Currency markets will have to navigate a similar two-track adjustment.
In the near term, U.S. Treasuries remain the world’s premier safe haven, and even under fiscal stress global traders seek shelter in American debt. That demand would support the dollar, particularly if equity gains coincide with rate-cut expectations from the Federal Reserve.
That said, confidence could erode if the deficit continues to balloon. The dollar would then be forced to reprice, still strong in bursts of global risk aversion but softer on a structural horizon as traders demand greater compensation to hold U.S. paper.
For traders, the implications are clear. Expect a two-step process where markets first celebrate lower inflation and thinner trade costs, then wrestle with the heavier reality of fiscal strain. Volatility is likely to rise as the initial burst of optimism collides with swelling bond supply and higher yields.
The cautious forecast is that equities gain first, led by sectors most sensitive to tariffs, but face headwinds if bond markets push borrowing costs higher. The dollar may hold firm in the short run, but risks are tilted toward gradual softening if deficits remain unchecked.
Key movements of the week
A concise, trader-first read on where the pressure points sit across currencies, commodities, equities, and crypto this week. The map is drawn by levels already in play. The bias is driven by how the price behaves when it returns to each zone.
The dollar is still steering the wheel. USDX climbed from 96.60 and cleared 98.051 before pausing. The pullback is orderly so far, and the bias holds as long as 97.00 remains intact. Dips into the 97s are still the place to watch for buyers.
The euro and sterling are both struggling to keep traction. EURUSD fell through 1.16571 before rebounding, but rallies into 1.1745 or 1.1805 look stretched. GBPUSD carries the same weight, with sellers lining up near 1.3450 and 1.3505. For now, both pairs remain capped by fragile sentiment.
USDJPY keeps its bullish tilt. The push through 149.127 sets the tone, and any retreat into 148.75 or 147.75 is where momentum buyers are likely to re-engage. Dollar Swiss is also building higher ground, with 0.7950 and 0.7925 as natural springboards.
The commodity bloc is still under pressure. AUDUSD has been leaning lower from 0.6640, and NZDUSD mirrors the weakness, with sellers watching 0.5815 to 0.5860. The Canadian dollar, by contrast, is firming with the dollar, and 1.3900–1.3830 is the zone to watch for the next leg higher.
Oil’s breakout has hit resistance. Price cleared 66.442 but sellers stepped in quickly. The 64.60 handle is the line to defend if the uptrend is to hold. Gold is quieter, caught between 3835 overhead and 3690 below. Until one side gives, it remains a range-trader’s market.
Equities continue to climb. The S&P 500 bounced from 6576 and now eyes 6750 and 6840, though stretched valuations will test conviction if yields start pressing higher again.
Bitcoin, too, is settling into a range between 109450 support and 114200 resistance. With two-way flows in play, the market is waiting for a clean break before leaning hard in either direction.
Natural gas sits on the back foot after losing 2.92, with 2.73 the next level for dip buyers to try their luck.
Key events of the week
The calendar for the week sets a measured tone, with traders balancing central bank decisions against labour market data. Monday begins quietly, with no scheduled releases.
On Tuesday, 30 Sep, attention shifts to Australia and the United States. The Reserve Bank of Australia holds its cash rate steady at 3.60 percent, unchanged from the previous reading, while in the U.S. the JOLTS job openings survey is forecast at 7.15 million compared with 7.18 million previously.
These releases are expected to support consolidation in AUDUSD before fresh downside and could allow the dollar index to continue edging higher, though some stalling is possible.
Wednesday, 1 Oct, brings the ISM Manufacturing PMI, forecast at 49.1 versus 48.7 last month. A modest improvement would leave the index still below the 50 threshold, but if the dollar completes its consolidation phase by then, the release could provide the next impulse higher for the greenback.
Friday, 3 Oct, is the focal point. The Bank of Japan governor is due to speak, a reminder of yen policy sensitivity after recent weakness.
In the U.S., the September nonfarm payroll report is expected to show a sharp rebound with 51,000 new jobs compared to just 22,000 previously. The unemployment rate is seen steady at 4.3 percent. This combination may reinforce the dollar’s strength itrader-firstf the labour market shows resilience, though structure remains key as traders look for confirmation of trend.
Looking beyond the immediate horizon, the following week brings the Reserve Bank of New Zealand’s official cash rate decision on 8 October and the University of Michigan’s preliminary consumer sentiment survey on 10 October, both of which could add another layer of volatility to dollar pairs.