Please note that the dividends of the following products will be adjusted accordingly. Index dividends will be executed separately through a balance statement directly to your trading account, and the comment will be in the following format “Div & Product Name & Net Volume”.
Please refer to the table below for more details:
The above data is for reference only, please refer to the MT4/MT5 software for specific data.
If you’d like more information, please don’t hesitate to contact info@vtmarkets.com.
The euro hovered near $1.16 on Monday, holding close to its lowest level in over two months as traders monitored fresh political developments in France and subtle shifts in US-China trade relations.
Budget test of France
In France, political volatility continued after Prime Minister Sebastien Lecornu resigned last week, only to be swiftly reappointed on Friday.
The French presidency announced Prime Minister Sebastien Lecornu's new cabinet line-up, with most top jobs remaining unchanged despite demands by opponents for a political shift https://t.co/5QiMfBvmkgpic.twitter.com/BJu1lSzLc0
Lecornu faces a significant test today as he presents a draft budget bill, navigating a tight parliamentary landscape where maintaining stability is crucial.
Lecornu is attempting to secure enough abstentions or conditional support from both the Socialists and centre-right Republicans to pass the budget. Encouragingly, most deputies have expressed opposition to dissolving parliament, suggesting a potential pathway for budget approval and avoiding a new round of elections.
US-China dynamics
Meanwhile, geopolitical sentiment improved slightly after US President Donald Trump adopted a more conciliatory tone toward China, just days after threatening 100% tariffs on Chinese imports.
Traders return from the weekend after Donald Trump raised the threat of a “massive increase” in tariffs on Chinese goods, which he said would involve an additional 100% levy beginning Nov. 1. https://t.co/CIo4iVkt5q
The softer rhetoric followed the decision by Beijing to tighten export controls on rare earth minerals, a move that had briefly escalated trade tensions.
The euro remains under modest pressure as traders favour the US dollar amid its safe-haven appeal and relatively stronger growth outlook. Market participants are also watching for cues from the European Central Bank (ECB), which has maintained a cautious tone on monetary policy, balancing inflation risks with signs of slowing activity.
Technical analysis: EUR/USD
The EUR/USD pair is trading around 1.16046, slightly lower by 0.14%, as the euro continues to consolidate near its recent lows amid persistent dollar strength and mixed eurozone data. The pair remains under modest selling pressure, with traders weighing the cautious tone of the ECB against the commitment of the Fed to keeping interest rates elevated for longer.
From a technical standpoint, EUR/USD has shifted into a mildly bearish posture. The pair has fallen below its 5- and 10-day moving averages, while the 30-day moving average is beginning to flatten, signalling potential loss of bullish momentum.
The recent rejection from the 1.1918 resistance level marks the formation of a short-term top, with price action now testing the key support area at 1.1550 to 1.1580. A clear break below this zone could open the path toward 1.1450, a level last seen in mid-summer 2025.
The MACD has turned bearish, with the signal line crossing above the MACD line and the histogram entering negative territory.
This momentum shift reinforces the likelihood of continued downside pressure in the near term unless the pair finds renewed buying interest around current levels.
On the fundamental side, the euro has been weighed down by weak manufacturing and industrial output data across the bloc, alongside political tensions in France and Italy that are dampening investor confidence.
Meanwhile, the U.S. dollar remains supported by safe-haven flows amid ongoing fiscal uncertainty in Washington and strong U.S. economic indicators, including retail sales and labour data.
Please note that the dividends of the following products will be adjusted accordingly. Index dividends will be executed separately through a balance statement directly to your trading account, and the comment will be in the following format “Div & Product Name & Net Volume”.
Please refer to the table below for more details:
The above data is for reference only, please refer to the MT4/MT5 software for specific data.
If you’d like more information, please don’t hesitate to contact info@vtmarkets.com.
Quantitative trading, often referred to as quant trading, uses mathematics, data analysis, and computer algorithms to identify trading opportunities with precision and consistency. Once exclusive to hedge funds and large financial institutions, this approach is now increasingly accessible to individual traders through modern trading platforms. In this guide, we explain what quantitative trading is, how it works, highlight popular quantitative trading strategies, and outline its key advantages, risks, and steps to get started.
What Is Quantitative Trading?
Quantitative trading, also known as quant trading, is a method of trading that uses mathematical models, statistical analysis, and computer algorithms to make data-driven decisions. Instead of relying on human intuition or emotion, quantitative trading focuses on identifying measurable patterns within large sets of financial data. Traders, often called “quants,” design models to analyse price movements, trading volumes, and volatility to uncover opportunities with a high probability of success.
In essence, quantitative trading transforms raw market data into logical, repeatable trading strategies that aim to achieve consistent performance over time.
Example: A quantitative trader might analyse historical EUR/USD data to identify a recurring pattern in which the price tends to rise when interest rate spreads between the euro and the US dollar narrow. Based on this finding, the trader builds an algorithm that automatically buys EUR/USD whenever that condition occurs, testing and refining it before deploying it in live markets.
How Quantitative Trading Works
Quantitative trading involves a systematic process that turns data into actionable trading strategies. Professional traders and institutions often use programming languages like Python, R, or C++, while retail traders can leverage automation tools and Expert Advisors available on MetaTrader 4 (MT4) and MetaTrader 5 (MT5) platforms.
The process typically follows four key stages:
Data Collection: Gathering large volumes of historical and real-time data such as prices, interest rates, trading volumes, and macroeconomic indicators.
Model Development: Building mathematical or machine-learning models to identify statistically significant and potentially profitable trading opportunities.
Backtesting: Testing the strategy on historical data to evaluate how it would have performed under different market conditions and adjusting the model parameters for optimal results.
Execution: Using automated systems to place and manage trades efficiently, ensuring precision and speed in fast-moving markets.
Example: A quant trader might design a model to trade gold (XAU/USD) whenever volatility rises beyond a specific threshold. The model is backtested on several years of price data, adjusted for transaction costs, and then automated to execute trades instantly when those conditions are met.
Popular Quantitative Trading Strategies
There are several common types of quantitative trading strategies that traders can explore:
1. Statistical Arbitrage
The statistical arbitrage strategy exploits small, short-term price inefficiencies between correlated securities. For instance, if two similar stocks diverge in price temporarily, a quant model might buy one and short the other until prices realign.
Example: Suppose two technology giants, Apple (AAPL) and Microsoft (MSFT), normally move in the same direction because they share similar market drivers and investor sentiment. If Apple’s share price rises sharply while Microsoft’s remains flat, a quant model might short Apple and buy Microsoft, expecting their prices to converge once the temporary imbalance corrects.
2. Trend Following
Trend following focuses on capturing price momentum using technical indicators to identify and trade in the direction of market trends. Quant traders often use moving averages (MA) or the Relative Strength Index (RSI) to spot trends. A common rule-based method is to buy when the 50-day moving average crosses above the 200-day moving average.
Example: A quant trader might design a system that buys gold when its 50-day moving average crosses above the 200-day average, a classic “golden cross” signal, and sells when the opposite occurs. This approach seeks to profit from prolonged bullish or bearish trends.
3. Mean Reversion
The mean reversion strategy is based on the idea that asset prices tend to move back toward their long-term average after periods of deviation. Quant traders identify assets that are temporarily overbought or oversold compared with their historical mean and position accordingly.
Example: If Tesla’s (TSLA) share price suddenly rises far above its 90-day moving average due to short-term market hype, a quant model might short the stock, anticipating that its price will gradually revert toward the mean once the temporary surge fades.
4. High-Frequency Trading (HFT)
HFT strategies use powerful computers and low-latency connections to execute thousands of trades per second. These systems seek to profit from micro-inefficiencies that exist for only fractions of a second.
Example: An HFT firm might detect slight price discrepancies between shares listed on the London Stock Exchange (LSE) and their corresponding listings or derivatives traded on other global stock exchanges. The algorithm would instantly execute simultaneous buy and sell orders to capture the small price difference before it disappears.
Advantages of Quantitative Trading
Quantitative trading offers several key advantages that make it appealing to both institutional and retail traders:
1. Objective and Emotion-Free
Trades are executed based on data and predefined rules, not emotions. This removes the influence of fear or greed, leading to more disciplined and consistent decision-making.
2. Data-Driven Accuracy
Quant models rely on statistical evidence and mathematical analysis, improving the accuracy of trade entries and exits compared with intuition-based decisions.
3. Backtesting and Risk Control
Before deploying a strategy, traders can test it on historical data to understand potential returns, risks, and drawdowns. This helps refine strategies and manage risk more effectively.
4. Speed and Efficiency
Automated algorithms can analyse vast amounts of data and execute trades within milliseconds, capturing opportunities that human traders would likely miss.
5. Scalability
Once a model is developed, it can be applied across multiple markets and instruments simultaneously without additional effort, allowing traders to diversify strategies efficiently.
Risks and Limitations of Quantitative Trading
While quantitative trading offers many benefits, it also comes with certain risks and challenges that traders should be aware of:
1. Model Overfitting
A common issue where a strategy performs well on historical data but fails in live markets because it was tailored too closely to past conditions. Overfitted models often struggle to adapt when market behaviour changes.
2. Dependence on Data Quality
Quantitative models rely heavily on accurate and complete data. Inconsistent, missing, or biased data can lead to incorrect signals and poor trading performance.
3. Market Regime Changes
Economic events, policy shifts, or sudden volatility can render previously successful models ineffective. Quant strategies that rely on historical patterns may not perform well in new or extreme conditions.
4. High Infrastructure and Maintenance Costs
Developing and maintaining trading systems require robust hardware, reliable data feeds, and continuous updates. For individual traders, these costs can be significant.
5. Complexity and Oversight
Quantitative models are complex and require constant monitoring. Even automated systems need human oversight to detect errors, manage unexpected events, and update parameters as markets evolve.
Quantitative Trading vs Algorithmic Trading
While these terms are often used interchangeably, there are key differences:
Aspect
Quantitative Trading
Algorithmic Trading
Purpose
Develops data-driven strategies using statistical models
Executes trades automatically based on predefined rules
Focus
Strategy design and testing
Trade execution efficiency
Users
Hedge funds, institutional and retail quants
Brokers, trading platforms, and retail traders
Example
Designing a mean-reversion model
Automating trade execution via MetaTrader Expert Advisors (EAs)
In practice, quantitative trading provides the brains behind a strategy by analysing data, identifying patterns, and developing models that predict price movements. Algorithmic trading, on the other hand, acts as the hands that execute those models automatically in the market, ensuring trades are placed with speed, precision, and minimal human error.
How to Start Quantitative Trading
You do not need a PhD in mathematics to begin quant trading. Many tools and educational resources are available for retail traders. Below is a step-by-step guide on how to start quantitative trading:
Step 1: Learn the Basics
Familiarise yourself with financial markets, probability, basic statistics, and fundamental quantitative concepts such as data analysis and model testing.
Step 2: Develop or Use Existing Models
You can start by designing simple quantitative models using readily available trading tools or platforms, or explore pre-built strategies offered by reputable providers.
Step 3: Backtest Your Strategy
Use historical data to measure performance and adjust parameters for optimal results.
Step 4: Practise on a Demo Account
Use a demo trading account to test your strategies in real market conditions without risking actual funds.
Step 5: Go Live with Risk Management
Once your strategy proves consistent, start small with a live trading account and apply proper risk management practices, including setting stop-loss levels and managing capital allocation carefully.
In Summary
Quantitative trading, or quant trading, uses mathematics, data analysis, and automation to identify and execute trading opportunities with precision and consistency. It transforms large volumes of market data into structured, rule-based strategies. While this approach offers clear advantages such as objectivity, speed, and scalability, traders must remain cautious of challenges like model overfitting, data reliability, and shifting market conditions. As technology continues to advance and tools become more accessible, quantitative trading empowers both professional and retail traders who apply disciplined testing and effective risk management.
Start Quantitative Trading Today with VT Markets
Whether you are learning what quant trading is or already developing your own models, VT Markets provides the technology, educational resources, and dedicated support through its Help Center to help you trade with confidence. Experience ultra-fast execution, deep liquidity, and access to advanced automated trading tools through MetaTrader 4 (MT4) and MetaTrader 5 (MT5).
Quant trading is a method of trading that uses mathematical models and data analysis to identify profitable opportunities automatically.
2. Do I need coding skills to start quant trading?
Basic coding knowledge helps, but retail traders can use pre-built tools on MT4/MT5 without advanced programming.
3. Is quantitative trading profitable?
It can be highly profitable when models are well-designed and properly managed, though results depend on data quality and market conditions.
4. How much capital do I need to begin?
There is no strict minimum, but starting with a demo account is recommended to test and refine strategies before trading real funds.
5. Can quantitative trading be used in forex and other markets?
Absolutely. Quantitative trading can be applied across asset classes such as forex, indices, precious metals, equities, and even cryptocurrencies.
6. How does quantitative trading differ from traditional trading?
Traditional trading often relies on human judgment and market experience, while quantitative trading uses data, algorithms, and automation to make decisions. This allows trades to be executed faster and more objectively.
7. How often do quantitative trading models need to be updated?
Models should be reviewed and updated regularly, especially when market conditions or volatility change.
8. Why is risk management important in quantitative trading?
Even the most advanced models can fail during unexpected market events. Strong risk management, including position sizing, stop-loss orders, and diversification, helps protect capital and sustain long-term profitability.
The Nasdaq 100 extended modest gains on Friday, rising 0.2% to 25,164.88, as investors balanced optimism about artificial intelligence (AI) growth with growing concerns over the sustainability of technology valuations.
The rally, largely driven by the “Magnificent Seven” and their AI-linked ventures, is now facing scrutiny from market strategists who see parallels to the late-1990s dot-com boom.
Analysts warn that the heavy dependence on AI spending, particularly from OpenAI, Microsoft, Nvidia, and Oracle, is creating both strong momentum and significant systemic risk.
The trillion-dollar question on AI investment plan
At the centre of the current market debate is OpenAI’s trillion-dollar investment plan, an ambitious effort to build 16 gigawatts of data centres worldwide and expand its cloud infrastructure through partnerships with Oracle and Nvidia.
The sheer scale exceeds any historic capital expenditure cycle, raising questions about both financing feasibility and power supply constraints.
OpenAI and Nvidia. Oracle and OpenAI. Nvidia and Oracle. Today on the Big Take: the AI giants making circular deals — and why some analysts are skeptical https://t.co/b9hHfUuhMCpic.twitter.com/nSBAHCbO1f
Estimates suggest that OpenAI’s commitments total nearly $1 trillion, which equals about 3.4% of U.S. GDP and around one-quarter of all non-residential private investment recorded in 2024.
Around $100 billion of that total is expected to come from Nvidia and other partners, but analysts question how the remaining $800 billion will be financed through cash flow, equity, or debt markets.
Any of these paths would represent unprecedented levels of fundraising in corporate history.
Analysts warn that the impact of OpenAI failing to secure required funding could ripple through the entire AI supply chain.
Tech and AI market context
Despite these concerns, the Nasdaq 100 remains close to record highs. Resilient earnings from major technology firms and persistent investor appetite for growth continue to provide support.
Artificial intelligence remains the dominant narrative in markets, with Microsoft, Amazon, and Meta collectively expected to spend around $335 billion this year on AI-related capital expenditure.
However, the concentration of market value within a handful of companies highlights potential vulnerability if any disruption occurs in the AI financing cycle.
The forward price-to-earnings ratio of the Nasdaq 100 currently stands near 29 times, which is significantly higher than its 10-year average, pointing to elevated valuation risk.
Technical analysis: NAS100
The Nasdaq 100 (NAS100) index is trading around 25,164.88, up 0.20% on the day, as technology stocks continue to show resilience despite broader market caution.
The tech-heavy benchmark remains near record highs, driven by sustained investor enthusiasm around artificial intelligence, cloud computing, and semiconductor sectors, while recent signs of cooling inflation have also lent support to equity sentiment.
From a technical perspective, NAS100 maintains a strong bullish structure. The index is comfortably trading above its 5-, 10-, and 30-day moving averages, reflecting healthy trend alignment across short- and medium-term indicators.
The MACD remains in positive territory, though its histogram shows modest weakening, hinting that upward momentum may plateau after the long stretch of gains since mid-2025.
Cautious outlook on tech stocks
While the broader uptrend remains intact, the market’s growing reliance on AI-related investment and speculative expectations surrounding OpenAI’s expansion make it more fragile.
Any delay in funding or shift in monetary policy that reduces liquidity could lead to a correction.
For now, traders are watching upcoming earnings from major AI players and economic data that may influence Federal Reserve rate expectations. These will be key in determining whether the current rally is supported by fundamentals or driven by speculation.
Please note that the dividends of the following products will be adjusted accordingly. Index dividends will be executed separately through a balance statement directly to your trading account, and the comment will be in the following format “Div & Product Name & Net Volume”.
Please refer to the table below for more details:
The above data is for reference only, please refer to the MT4/MT5 software for specific data.
If you’d like more information, please don’t hesitate to contact info@vtmarkets.com.
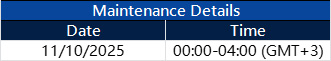
As part of our commitment to provide the most reliable service to our clients, there will be maintenance this weekend.
Maintenance Details:
Please note that the following aspects might be affected during the maintenance:
1. The price quote and trading management will be temporarily disabled during the maintenance. You will not be able to open new positions, close open positions, or make any adjustments to the trades.
2. There might be a gap between the original price and the price after maintenance. The gaps between Pending Orders, Stop Loss, and Take Profit will be filled at the market price once the maintenance is completed. It is suggested that you manage the account properly.
3. During the maintenance period, VT Markets APP will not be available. It is recommended that you avoid using it during the maintenance.
4. During the maintenance hours, the Client portal will be unavailable, including managing trades, Deposit/Withdrawal and all the other functions will be limited.
The above data is for reference only. Please refer to the MT4/MT5 software for the specific maintenance completion and marketing opening time.
Thank you for your patience and understanding about this important initiative.
If you’d like more information, please don’t hesitate to contact info@vtmarkets.com.
Please note that the dividends of the following products will be adjusted accordingly. Index dividends will be executed separately through a balance statement directly to your trading account, and the comment will be in the following format “Div & Product Name & Net Volume”.
Please refer to the table below for more details:
The above data is for reference only, please refer to the MT4/MT5 software for specific data.
If you’d like more information, please don’t hesitate to contact info@vtmarkets.com.
9 October, Sydney, Australia – VT Markets, a leading multi-asset broker, announced plans to introduce an AI-powered growth strategy designed to elevate trading performance, strengthen client protection, and transform user experience. The strategy was revealed during the high-profile VT Markets Dubai Week Gala Night that brought together industry leaders, partners, and traders.
As financial markets become increasingly complex, VT Markets’ upcoming AI integration aims to address key challenges for retail traders, including decision-making, risk management, and education. More than a technological upgrade, the strategy underscores the company’s long-term commitment to its clients and the industry.
Ross Maxwell, Global Strategy Operations Lead shared: “We’re harnessing AI to deliver sharper insights, faster execution, and smarter support – helping traders navigate market dynamics with confidence, while staying true to the trust and transparency our brand is built on.” He added: “We’re also using AI to boost internal efficiency and productivity so we can deliver products and services at the highest standards.”
Upcoming Tech and AI-Powered Innovations
1. One-Tap Trading: Streamlined trading actions such as deposits, withdrawals, and trade entries/exits, optimized by AI for speed and ease.
2. AI Trading Assistant: Consolidates market trends, news, and data into personalized insights for informed decision-making.
3. Automated Loyalty Program: Tracks client activity and automatically rewards engagement and referrals to customer satisfaction.
4. Real-Time Risk & Compliance Monitoring: Monitors market exposure, leverage, and anomalies, offering real-time alerts and automated adjustments to ensure client safety.
5. Digital Finance Ecosystem: A unified ecosystem for managing assets, offering features such as seamless top-ups, withdrawals, and real-time conversions between currencies and cryptocurrencies. Powered by AI, it enhances efficiency and security, integrating everyday transactions via digital wallets and cards to cater to local and global payment needs
6. 24/7 AI Support: Round-the-clock AI-powered support provides real-time, multilingual assistance, ensuring a smooth trading experience.
As the financial landscape continues to evolve, VT Markets’ AI strategy reinforces its position as an industry leader, combining innovation with its legacy of trust as it enters a new era of smarter, more empowering trading experiences.
About VT Markets:
VT Markets is a regulated multi-asset broker with a presence in over 160 countries as of today. It has earned numerous international accolades including Best Online Trading and Fastest Growing Broker. In line with its mission to make trading accessible to all, VT Markets offers comprehensive access to over 1,000 financial instruments and clients benefit from a seamless trading experience via its award-winning mobile application.