Dear Client,
To ensure fair trading conditions and manage market volatility during major economic announcements, VT Markets will apply temporary leverage adjustments on certain trading products during specific news periods and market opening/closing.
These adjustments are designed to protect clients from abnormal market fluctuations, sudden liquidity changes, and extreme price movements that may occur during high-impact news releases.
1.Products Affected
The temporary leverage adjustment may apply to the following products:
• Forex
• Gold
• Silver
• Oil
• Indices
• Commodities (including XPT and XPD)
2. Adjusted Leverage During News Releases and Market Opening/Closing
During the specified news period, maximum leverage will be adjusted as follows:
Forex: 200
Gold: 200
Silver: 50
Oil: 20
Indices: 50
Commodities: 5
Please note that each product with leverage already below the above will not be affected.
3. News Events That Can Trigger the Adjustment
Leverage adjustments may be applied during major economic announcements including:
• FOMC Interest Rate Decisions
• CPI (Consumer Price Index)
• GDP
• PMI / NMI
• PPI
• Retail Sales
• Non-Farm Payroll (NFP)
• ADP Employment Data
• Crude Oil Inventories
The above data is for reference only. Other significant macroeconomic releases from major economies may also be included.
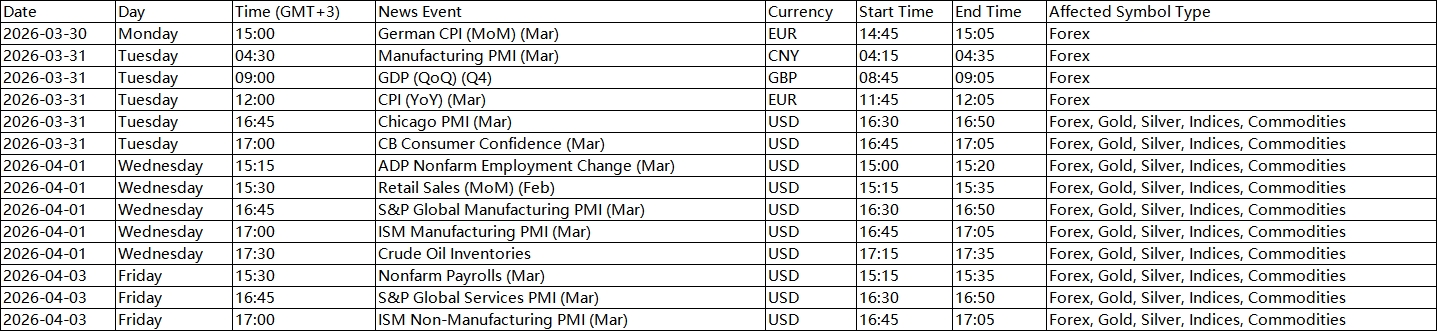
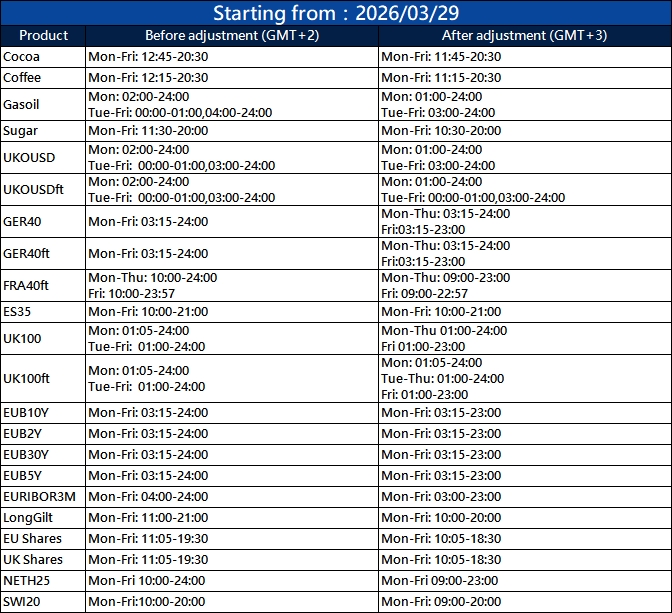
Please refer to the table below for details of the upcoming events and affected instruments:
All dates and times are stated in GMT+3 (MT4/MT5 server time).
4. Affected Period of News Releases and Market Opening/Closing
Temporary leverage adjustments apply during the following periods:
Economic News Period
• 15 minutes before the announcement
• 5 minutes after the announcement
Market Opening / Closing Period
• 3 hours before the weekly market closing (Friday)
• 30 minutes after market reopening (Monday)
• 30 minutes before daily market closing (Monday – Thursday)
After the above period ends, leverage will automatically return to the original leverage.
5. Important Rules
• The adjustment only affects new positions open during the adjustment period.
• Positions opened before the adjustment period will not be affected.
• Once the adjustment period ends, original leverage will resume automatically.
We strongly encourage clients to take these temporary leverage adjustments into account when planning trading strategies during high-impact economic events.
If you have any questions, please contact our support team: info@vtmarkets.com.
Please note that the dividends of the following products will be adjusted accordingly. Index dividends will be executed separately through a balance statement directly to your trading account, and the comment will be in the following format “Div & Product Name & Net Volume”.
Please refer to the table below for more details:
The above data is for reference only, please refer to the MT4/MT5 software for specific data.
If you’d like more information, please don’t hesitate to contact info@vtmarkets.com.
SpaceX is not publicly traded, and there is no confirmed IPO timeline despite ongoing speculation.
Elon Musk has consistently prioritised long-term mission goals over public market pressure.
A Starlink IPO is more realistic, but only once revenue and cash flow stabilise.
Interest in a SpaceX IPO has grown alongside the company’s rapid rise in valuation and influence. As one of the most valuable private companies in the world, SpaceX sits at the centre of several powerful narratives — space exploration, satellite infrastructure, and next-generation technology.
That combination makes it a natural target for speculation.
Search trends around “SpaceX stock” and “SpaceX IPO” have surged, particularly as retail traders look for the next high-growth opportunity similar to Tesla or Nvidia. However, much of what circulates online tends to blur the line between possibility and reality.
SpaceX is aiming to file its initial public offering prospectus with regulators later this week or next week, The Information reported, citing a person with direct knowledge of the plans https://t.co/ZUOEpEYYRVpic.twitter.com/VtU9SiDhYf
To understand whether a SpaceX IPO is likely, it is important to separate speculation from what has actually been said and done.
Myth 1: SpaceX is Already Publicly Traded
SpaceX remains a privately held company, and this is one of the most common points of confusion.
Unlike publicly listed firms, SpaceX shares are not available on exchanges such as the Nasdaq or NYSE. Ownership is concentrated among founders, employees, and private traders who participate in funding rounds.
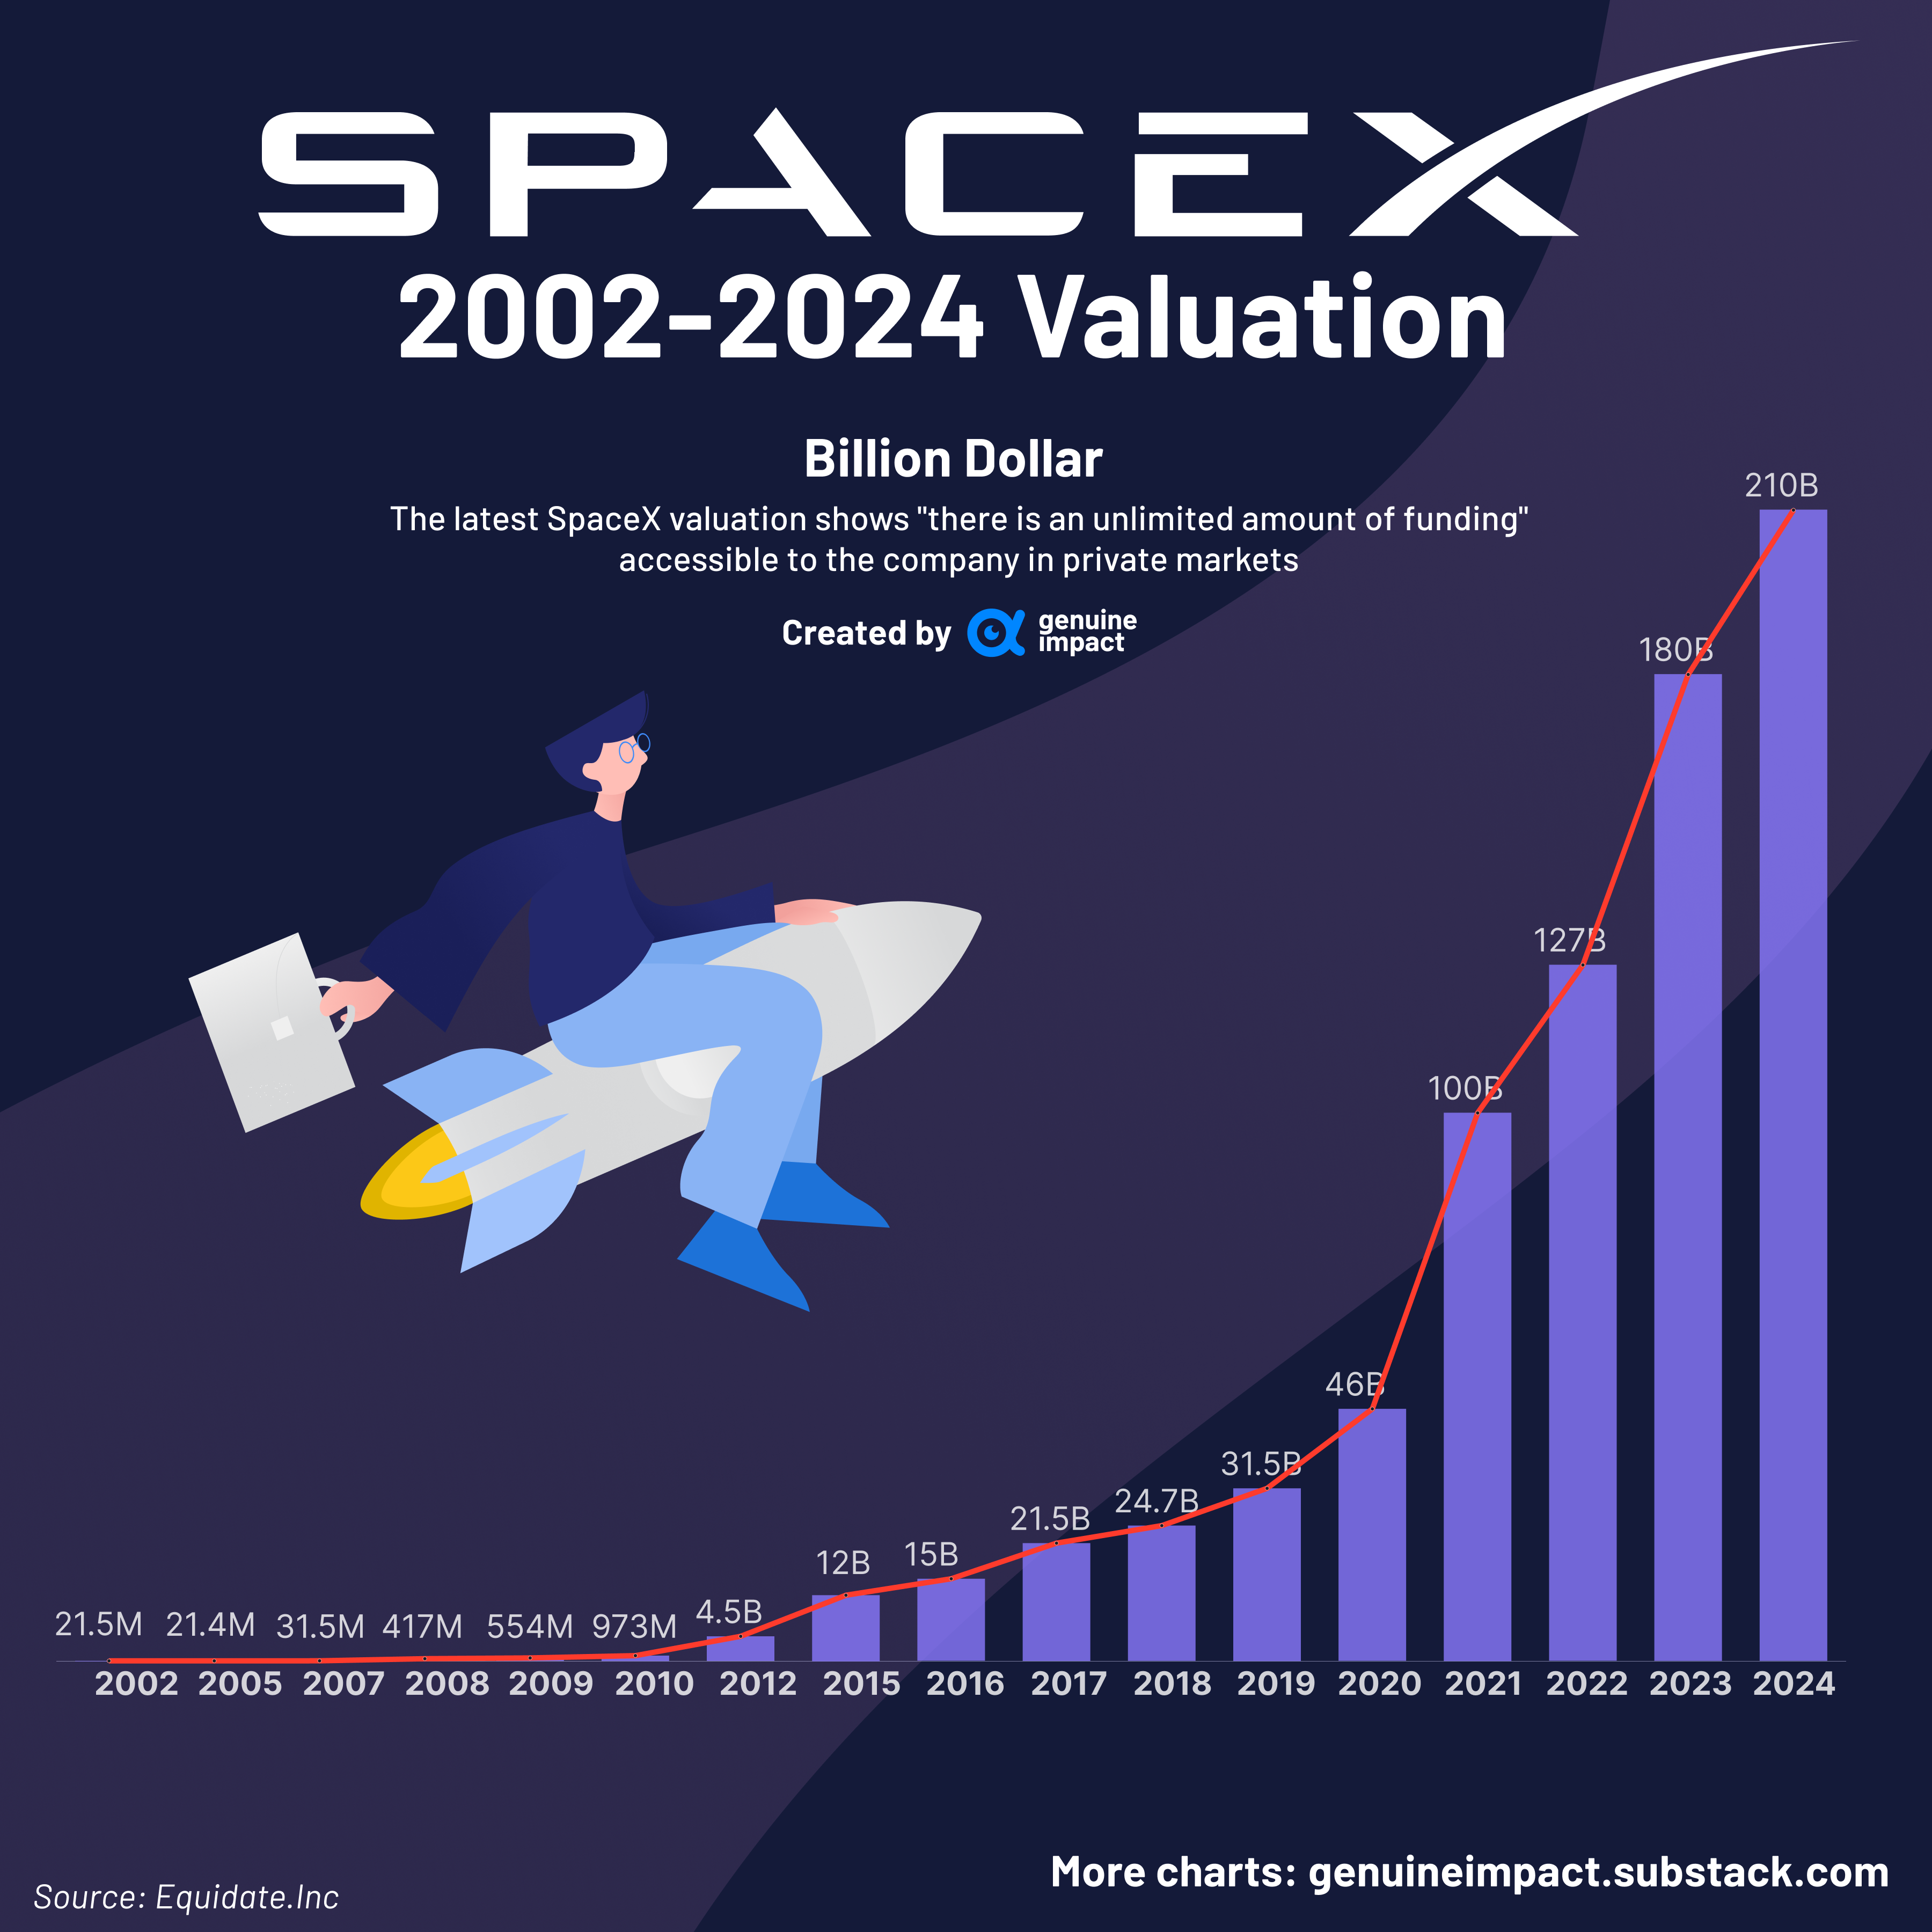
Recent private market valuations have placed SpaceX in the range of $150 billion to $180 billion, reflecting strong investor confidence in both its launch business and Starlink division.
However, this valuation does not translate into public accessibility. For most traders, SpaceX stock simply does not exist in a tradable form.
This disconnect between visibility and accessibility is one of the main drivers behind persistent IPO rumours.
Myth 2: A SpaceX IPO Has Already Been Announced
There is no confirmed SpaceX IPO date, and no official filing indicating that the company is preparing to go public.
Elon Musk has addressed this topic on multiple occasions, and his position has been relatively consistent. He has emphasised that taking SpaceX public too early could create pressure to prioritise short-term profitability over long-term objectives.
This matters because SpaceX operates very differently from a typical technology company. Its core activities likerocket development, reusable launch systems, and deep-space missions require heavy capital investment with uncertain timelines.
In public markets, companies are expected to deliver predictable earnings and quarterly performance. SpaceX’s business model does not naturally fit that framework.
Myth 3: SpaceX Will Go Public Soon
Speculation around a near-term IPO often resurfaces during periods of strong valuation growth or major announcements. However, there is little evidence to suggest that a full SpaceX listing is imminent.
The company continues to reinvest heavily into:
Starship development.
Launch capacity expansion.
Global satellite infrastructure.
These projects are long-cycle investments that may take years to generate consistent returns.
Musk has previously indicated that a public listing would only make sense once revenue streams become more stable and predictable. At present, SpaceX’s value is still closely tied to future potential rather than fully realised earnings.
That makes it less suited to the expectations of public equity markets in the near term.
What’s Actually Likely: A Starlink IPO First
If any part of SpaceX were to go public, the most likely candidate is Starlink.
Starlink differs from the rest of SpaceX in one key way: it generates recurring revenue. The satellite internet service has expanded rapidly, serving millions of users across multiple regions and building a more traditional subscription-based business model.
Musk has suggested that Starlink could eventually be spun off as a separate entity once:
Cash flow becomes more predictable.
Operational scaling stabilises.
The business reaches a more mature stage.
From a market perspective, Starlink fits the profile of a typical IPO candidate far more closely than SpaceX’s launch operations.
This is why many analysts view a Starlink IPO as the more realistic scenario, rather than a full listing of SpaceX itself.
Why Starlink Still Matters
Even with the fresh SpaceX IPO headlines, Starlink remains the most useful part of the story for traders to understand.
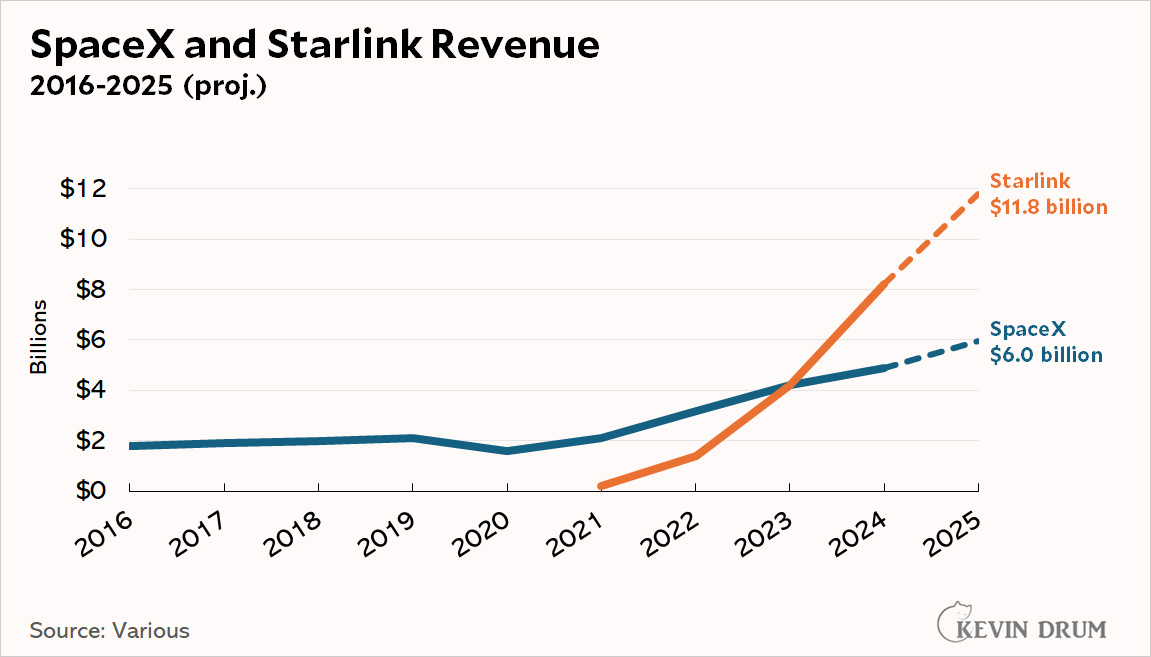
Starlink is no longer just a futuristic side project. In its 2025 progress report, the company said it connected more than 4.6 million new active customers in that year alone and expanded service to 35 additional countries and territories. It also said Direct to Cell service is now commercially available in the United States and New Zealand, supported by a constellation of more than 400 satellites.
That matters because public markets understand recurring services better than they understand long-horizon engineering ambition. Rocket launches, reusable systems, and deep-space projects are powerful narratives, but recurring connectivity revenue, mobile partnerships, and scaling subscriber growth are easier for investors to price.
What Traders Can Actually Watch Instead
If SpaceX itself still sits out of reach for now, the better question becomes: where does the same theme show up in listed markets?
The first bucket is telecom adoption. T-Mobile has the clearest live commercial connection to Starlink through T-Satellite. When the Starlink story strengthens, this is one of the first listed names traders may want on the watchlist.
The second bucket is satellite communications peers and rivals. AST SpaceMobile says it is building direct-to-cell broadband to end dead zones. Iridium describes itself as a global mobile voice, data, and PNT satellite network and is pushing forward with NTN Direct.
AST SpaceMobile launched its largest-ever satellite from India, the first in a series of deployments to help the company compete against Elon Musk’s SpaceX in delivering space-based connectivity to mobile phones https://t.co/mzhCJLXRDc
These names do not give direct ownership of SpaceX or Starlink, but they do sit in the same commercial conversation around satellite connectivity, coverage, and next-generation network infrastructure.
The third bucket is space infrastructure. Rocket Lab describes itself as an end-to-end space company. That makes it a cleaner “space economy” read-through than stretching into unrelated tech stocks that only have a weak thematic link. CFD shares of companies like Virgin Galactic (SPCE) may also appeal to traders looking to dabble in the space sector.
The fourth bucket is thematic ETF exposure. Where available on the product list, space-focused ETFs can offer a broader basket approach. Roundhill’s MARS ETF says it invests in companies building the space economy, and its March 2026 factsheet lists Rocket Lab, AST SpaceMobile, EchoStar, Globalstar, and Viasat among its top holdings. Procure’s UFO ETF and VanEck’s JEDI ETF also explicitly frame themselves around space, satellite, and communications exposure.
SpaceX may still be private today, but the price action around satellite communications and the wider space economy is already visible in listed markets. Track relevant shares, ETFs, and market themes on the VT Markets app.
What a SpaceX IPO Could Mean for Markets
If SpaceX were to go public, it would likely be one of the most significant listings in modern market history.
At current valuation levels, an IPO could:
Rank among the largest technology listings ever.
Attract substantial institutional capital.
Influence index weightings and fund allocations.
Beyond size, it would also carry narrative weight. SpaceX sits at the intersection of several major themes:
Advanced technology.
Infrastructure expansion.
Long-term innovation.
A public listing would reinforce these themes and potentially draw further capital into adjacent sectors.
Bottom Line
SpaceX IPO rumours are driven more by investor interest than by confirmed plans.
The company remains private, with no official listing timeline. While a Starlink IPO is a realistic possibility in the future, a full SpaceX public offering appears unlikely in the near term.
For now, SpaceX continues to prioritise long-term growth and innovation over public market participation—making it one of the most closely watched private companies in the world.
Create a live VT Markets account today to access our platform features, including market insights and educational content.
FAQs
Is SpaceX publicly traded? No, SpaceX is a private company and is not listed on any stock exchange.
Has SpaceX officially announced its IPO? Reuters has reported that SpaceX is aiming to file soon and may reserve a large share of the offering for retail investors, but final details are still not confirmed publicly.
Why does Starlink matter so much to this story? Because Starlink has real commercial scale. It added more than 4.6 million new active customers in 2025, expanded to 35 more countries, and now has Direct to Cell service live in the United States and New Zealand.
What public assets are closest to the Starlink theme? T-Mobile is one of the clearest public links through its T-Satellite with Starlink service. Traders can also watch satellite communications names such as AST SpaceMobile and Iridium, plus space infrastructure companies and relevant ETFs where available.
Why has SpaceX not gone public? SpaceX remains private to maintain long-term focus, avoid short-term market pressure, and retain operational flexibility.
Start trading now – Click here to create your real VT Markets account
Written on March 26, 2026 at 10:32 pm, by josephine
AUDUSD drops to around 0.687, marking a two-month low.
Inflation risks rise, with CPI seen nearing 4.5% and possibly 5% in Q2.
Markets price a 68% chance of a May hike, with rates seen at 4.75% by year-end.
The Australian dollar weakened to around $0.687, falling to its lowest level in two months as markets reassessed global growth risks.
The move reflects rising concern that a prolonged Middle East conflict could trigger a sustained energy shock, weighing heavily on commodity-linked currencies like the Aussie.
As a proxy for global growth and commodity demand, AUDUSD tends to weaken when risk sentiment deteriorates.
The Aussie may remain under pressure if growth concerns deepen and commodity demand softens.
Yield Advantage Narrows as Global Tightening Expands
One of the key supports for the Australian dollar, its relatively higher interest rates, is beginning to fade.
Markets now expect other major central banks to maintain or even increase tightening, narrowing Australia’s yield advantage.
This shift reduces the incentive for capital flows into the Aussie, particularly as global uncertainty rises.
Despite this, markets still price a 68% probability of a rate hike in May, with expectations for rates to reach 4.75% by year-end.
Rate support may offer limited upside unless the RBA turns more aggressive than global peers.
Inflation Pressures Rise as Energy Costs Surge
A sharp rise in petrol prices is feeding directly into Australia’s inflation outlook.
Economists expect headline CPI to rise toward 4.5%, with the potential to approach 5% in Q2 if energy prices remain elevated.
Australian inflation remained elevated in February, even before the Iran war disrupted Middle East energy supplies and sent the cost of gasoline soaring, highlighting persistent price pressures in the economy. https://t.co/jBEU4ixjLg
This creates a difficult environment for policymakers, as higher inflation may require tighter policy, even as growth slows.
The combination of rising costs and weaker consumption is beginning to weigh on household spending.
RBA Faces Growth Versus Inflation Trade-Off
The Reserve Bank of Australia is navigating a complex policy environment.
RBA Assistant Governor Christopher Kent has warned that a prolonged Gulf conflict could weigh on economic growth, even as the central bank remains focused on anchoring inflation expectations.
The Middle East conflict and associated energy supply shock threaten to further fan inflation in Australia at a time when its economy is already grappling with capacity pressures, a senior Reserve Bank official said https://t.co/sMUTd5OmHD
This reflects a broader global theme where central banks must balance inflation control with weakening economic conditions.
The RBA may remain data-dependent, with policy decisions increasingly shaped by energy prices and global developments.
Technical Analysis
The AUDUSD is trading around 0.6893, continuing a steady pullback after failing to hold above the 0.71–0.7180 resistance zone. The structure has shifted from a strong uptrend into a corrective phase, with bearish pressure building in the short term.
Trend Structure and Moving Averages
Price is now sitting below all key short-term moving averages:
MA5: 0.6946
MA10: 0.7003
MA20: 0.7033
MA30: 0.7049
This alignment shows a clear bearish stack, with all MAs sloping downward. The rejection from 0.7187 marked a local top, followed by consistent lower highs and lower lows.
The fact that price cannot reclaim even the MA5 suggests sellers remain in control.
Key Levels to Watch
Immediate Resistance: 0.6945 → 0.7000
Stronger Resistance: 0.7030 → 0.7050
Support: 0.6850 → 0.6800
Breakdown Level: Below 0.6800 opens 0.6700 region
The 0.6850 area is the first key support. A clean break below this level would confirm continuation of the downside move.
Price Behaviour Insight
The rally from 0.6421 into the 0.7187 high was strong and trend-driven. However, the recent structure shows:
Repeated rejection near highs
Tight consolidation turning into breakdown
Increasing downside follow-through
This is typical of a distribution phase transitioning into correction.
Volume has increased during the recent decline, suggesting more active selling interest compared to the earlier consolidation.
What to Watch Next
Focus on how price reacts around 0.6945 (MA5 zone):
Failure to reclaim: Keeps downside pressure intact
Break above 0.7000: Could trigger a short squeeze toward 0.7030–0.7050
Also monitor macro drivers:
USDX strength remains a headwind for AUD
Commodity prices, especially iron ore and oil, can influence AUD direction
Cautious Outlook
The short-term bias remains bearish while below 0.7000, with rallies likely to be sold. Momentum only stabilises if price can reclaim the 0.7030–0.7050 zone. Until then, the structure favours a drift lower toward 0.6850 and potentially 0.6800.
What Traders Should Watch Next
AUDUSD remains sensitive to both domestic and global drivers. Key factors include:
Oil price movements and energy supply conditions
Global growth outlook and risk sentiment
RBA policy expectations and inflation data
Central bank divergence across major economies
For now, the Aussie dollar is reacting more to global risks than domestic policy support, with energy-driven inflation and growth concerns shaping its near-term direction.
S&P 500 fell 1.74%, with futures now attempting a rebound.
Trump delays action by 10 days, easing immediate risk sentiment.
Rising yields and energy prices continue to drive stagflation concerns.
U.S. equity futures edged higher on Friday, with the S&P 500 attempting to stabilise after a 1.74% drop in the previous session.
The rebound follows a heavy selloff across major indices, with the Dow falling 1.01% and the Nasdaq dropping 2.38%, led by weakness in technology stocks.
US stocks sank on Thursday amid uncertainty over the Middle East conflict, with oil hovering above $100. pic.twitter.com/2fzKNYsZv8
A senior officer onboard a tanker said his ship was given permission to pass through the Strait of Hormuz by Iran, and guided by the navy, following negotiations between Tehran and New Delhi https://t.co/nlSPyDVkdi
However, Iran has rejected the U.S.’s 15-point proposal and presented its own conditions, including control over the Strait, keeping tensions unresolved.
Relief rallies may be short-lived unless there is clear progress toward de-escalation.
Rising Yields and Energy Prices Drive Stagflation Fears
The broader market reaction reflects growing concern over stagflation.
A sharp rise in energy prices is feeding into inflation expectations, while higher Treasury yields tighten financial conditions.
Interest-rate strategists at Morgan Stanley say this month’s Treasury market slump has hallmarks of forced selling of two-year notes, whose yields soared as traders abandoned wagers on Federal Reserve interest-rate cuts and began to price in a hike https://t.co/rGSdCV7Tjw
This combination is particularly challenging for equities, as it raises discount rates while also threatening economic growth.
Technology stocks, which are sensitive to interest rate changes, led the decline in the previous session.
Continued pressure from yields may limit upside in equities, especially in rate-sensitive sectors.
Technical Outlook Shows Downtrend Pressure
The S&P 500 (SP500) is trading around 6505, attempting a mild rebound after a sharp sell-off that drove price down to the ~6439 low. The broader structure has shifted from a prior range into a clear short-term downtrend, and this bounce looks corrective rather than impulsive so far.
Trend Structure and Momentum
Price has broken below all key moving averages, with:
MA5: 6556
MA10: 6598
MA20: 6687
MA30: 6752
All moving averages are now sloping downward and stacked bearishly, confirming sustained downside pressure. The recent candles show lower highs and lower lows, which is classic trend continuation behaviour.
The current bounce is testing the underside of the short-term averages, particularly the MA5 and MA10 zone (6550–6600), which now acts as dynamic resistance.
Volume increased during the sell-off phase and has eased slightly during the bounce. That tells you buyers are not fully committed yet.
Key Levels to Watch
Immediate Resistance: 6550 → 6600
Stronger Resistance: 6685 → 6750
Support: 6439 → 6400
Breakdown Level: Below 6400 opens 6300 region
The 6439 low is the key near-term floor. A clean break below that level would likely accelerate downside momentum.
On the upside, price needs to reclaim 6600 first, then 6685 (MA20 zone) to shift sentiment back toward neutral.
Price Behaviour Insight
The rejection from the 7017 high earlier has led to a full structure shift. What used to be a sideways market has now transitioned into a distribution phase, followed by a breakdown.
The recent bounce shows:
Smaller candles
Less aggressive buying
Resistance holding quickly
This is typical of a bearish pullback, not a reversal.
What to Watch Next
Watch how price reacts around 6550–6600:
Rejection here: Likely continuation lower toward 6439 and potentially 6400
Break and hold above 6600: Opens a squeeze toward 6685
Also keep an eye on:
US yields (higher yields pressure equities)
USDX strength (strong dollar often weighs on risk assets)
Cautious Outlook
The short-term bias remains bearish while below 6600, with rallies likely to be sold into. Momentum only shifts if price can reclaim and hold above the 20-day average (~6685). Until then, the structure favours lower highs and continued pressure on support zones.
What Traders Should Watch Next
Markets remain driven by a mix of geopolitical and macro forces. Key areas to monitor include:
Progress in U.S.–Iran negotiations
Movement in Treasury yields
Oil price stability and supply flows through Hormuz
Performance of technology stocks
For now, the S&P 500 is attempting to find footing, but the balance between easing geopolitical risk and tightening financial conditions remains finely poised.
Please note that the dividends of the following products will be adjusted accordingly. Index dividends will be executed separately through a balance statement directly to your trading account, and the comment will be in the following format “Div & Product Name & Net Volume”.
Please refer to the table below for more details:
The above data is for reference only, please refer to the MT4/MT5 software for specific data.
If you’d like more information, please don’t hesitate to contact info@vtmarkets.com.
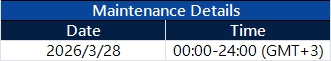
As part of our commitment to provide the most reliable service to our clients, there will be maintenance this weekend.
Maintenance Details:
Please note that the following aspects might be affected during the maintenance:
1. The price quote and trading management will be temporarily disabled during the maintenance. You will not be able to open new positions, close open positions, or make any adjustments to the trades.
2. There might be a gap between the original price and the price after maintenance. The gaps between Pending Orders, Stop Loss, and Take Profit will be filled at the market price once the maintenance is completed. It is suggested that you manage the account properly.
3. During the maintenance period, VT Markets APP will not be available. It is recommended that you avoid using it during the maintenance.
4. During the maintenance hours, the Client portal will be unavailable, including managing trades, Deposit/Withdrawal and all the other functions will be limited.
The above data is for reference only. Please refer to the MT4/MT5 software for the specific maintenance completion and marketing opening time.
Thank you for your patience and understanding about this important initiative.
If you’d like more information, please don’t hesitate to contact info@vtmarkets.com
Robinhood is back in focus, but not for the reasons that first made it famous.
At a glance
– Robinhood is trying to expand from a retail trading app into a broader consumer-finance platform.
– Its product range now includes cards, cash tools, retirement products, managed investing, and private-market access.
– Users, assets, and deposits are growing, but revenue still depends heavily on trading activity, crypto cycles, and market sentiment.
– The investment case now rests on whether product expansion can lead to more stable and diversified earnings.
Robinhood is a US fintech platform best known for retail stock, options, and crypto trading.
But the announcement signals a larger purpose. Robinhood is no longer trying to be seen only as a trading app built for bursts of market activity. It is trying to establish itself as a broader financial platform that can hold more of a user’s money, attention, and financial behaviour over time.
Previously, Robinhood was seen as a symbol of meme-era retail trading. Now, the focus is shifting to whether it can retain users as they become more experienced, better funded, and less reliant on short-term speculation.
Find HOOD stock as a CFD Share on our platform today.
How Robinhood is changing beyond trading
Robinhood’s original appeal was straightforward. It lowered the barrier to market access and matched well with users who were comfortable taking risks, acting quickly, and participating in fast-moving themes.
That trading-led base still matters. Robinhood remains centred on self-directed retail activity across equities, options, and crypto. These are products that naturally attract active users and benefit from volatility, engagement, and risk appetite.
What has changed is the company’s effort to build around that base rather than rely on it alone.
That progression is important because it shows how management sees the business evolving.
Instead of focusing only on trading frequency, Robinhood is trying to capture a larger share of each user’s overall financial life.
Its expanding product set now includes:
cash management and spending tools
credit products, including premium cards
retirement accounts and longer-term investing features
managed portfolios
private-market exposure through retail-facing fund structures
This is not a move away from trading. It is a move to keep users inside the platform as their financial behaviour becomes more deliberate and more diversified.
How Robinhood fits Trader Behaviour
For a risk-aware audience, this shift is easier to understand when viewed through trader behaviour rather than product labels.
Many active traders do not stay in one financial mode forever. They often begin with shorter-term opportunities, build confidence through market participation, then gradually develop broader goals around cash management, capital preservation, diversification, and long-term allocation.
Robinhood’s strategy increasingly reflects that progression.
This is where Robinhood looks more credible than it did a few years ago. The company is no longer built only for the first phase of the customer journey. It is trying to remain useful as that same customer becomes more financially capable and more selective.
That also helps explain the move upmarket.
Reuters reported that Robinhood’s premium card strategy is aimed at higher-income users, reflecting an effort to move beyond its earlier speculative image as its customer base ages. The February filing for a planned $1 billion private investment fund IPO fits the same pattern. It is not really an institutional pivot. It is a retail-facing wrapper that allows ordinary investors to buy exposure to private-company stakes through a listed fund structure.
In other words, Robinhood is broadening its menu for the same broad retail audience, from newer traders to wealthier and more experienced users.
Why eyes are on HOOD stock
There are solid reasons why investors are taking this transition more seriously.
As of March 2026, Robinhood reported:
27M funded customers
$322B in platform assets
$68B in net deposits
These figures suggest more than app engagement. They show that Robinhood continues to gather assets and retain financial relevance even as the business broadens beyond trading alone.
The product mix is also becoming more coherent.
Trading may be the entry point, but newer services are designed to increase retention and make the platform useful across different financial needs. A customer who once used Robinhood for options or crypto can now also hold cash, use credit, contribute to retirement products, and explore managed or alternative exposure without leaving the ecosystem.
One of the more interesting additions is Robinhood Ventures Fund I (RVI). Unlike a debit card or cash feature, RVI, which debuted at $658.4 million, is a publicly traded closed-end fund designed to give retail investors access to a concentrated basket of private companies. Structurally, that makes it less of a payment feature than an access product. But it still says something important about where Robinhood is positioning itself in the financial sector.
By offering indirect exposure to private companies such as Stripe, Revolut, Ramp, and Databricks, Robinhood is expanding what retail users can do on the platform. Instead of waiting for high-profile fintech and infrastructure businesses to reach the public market, users can gain earlier exposure through a listed fund wrapper, placing the platform closer to where financial innovation is being built.
The larger significance is that Robinhood is not just serving users who want to trade what is already public. It is gradually widening access across different layers of the financial ecosystem, from liquid markets to private-company exposure. That makes the platform more relevant to users whose strategies, capital base, and time horizon are becoming more developed.
Robinhood’s past identity is still intact
Even with a broader product set, Robinhood’s earnings profile remains closely linked to market conditions.
A significant portion of revenue still depends on:
This matters because it shows that platform expansion has not yet fully changed the business model’s sensitivity to market activity.
Robinhood may be adding more stable-looking products around the edges, but the core earnings engine still responds strongly to cycles in participation, volatility, and speculative interest.
That is the restraint investors keep returning to. The company is broadening structurally, but the income statement still appears cyclical.
Why Traders are alert
For traders, Robinhood is not interesting only because of its products. It is interesting because the company itself reflects a style of market participation.
Robinhood grew by appealing to users who value access, speed, flexibility, and the ability to act on conviction quickly, aligning up with active CFD trading behaviour.
What is different now is that the business is trying to hold that user for longer. Instead of benefiting only from short-term activity, Robinhood wants to benefit as that same user matures, builds capital, and starts allocating across more financial needs.
That makes Robinhood more inviting for serious assessment than it was when it was mainly discussed through the lens of meme stocks and speculative bursts.
For a market-aware reader, the company now raises a broader question about platform quality:can a business that was built around active risk-taking grow into one that also supports longer-term financial habits without losing the energy that made it relevant in the first place?
Bull vs Bear: reading Robinhood today
Bull case
Bear case
Robinhood is expanding into a broader financial ecosystem beyond trading.
Revenue is still meaningfully tied to trading activity and crypto cycles.
Funded customers, platform assets, and net deposits continue to grow.
Recent results still showed sensitivity to expectations and activity fluctuations.
New products may increase wallet share, improve retention, and support a more mature customer base over time.
Newer products still need to prove they can scale and monetise consistently.
RVI shows Robinhood broadening retail access beyond public markets into private-company exposure.
Access products can widen the menu, but they do not automatically change earnings quality in the near term.
The $1.5 billion buyback signals confidence and capital maturity.
Valuation may remain volatile if growth slows or activity weakens.
A successful transition could support a re-rating toward a diversified fintech profile.
The market may continue to treat Robinhood as a cyclical trading platform until revenue becomes less market-dependent.
In simple terms, the bull case rests on platform maturity, accessibility, and retention.
If Robinhood can deepen wallet share and retain users across more stages of their financial lives, these layers begin to reinforce one another. Robinhood may look less like a trading app reacting to market bursts and more like a consumer-finance platform with a wider role in capital allocation.
The bear case is that this broader menu still sits on top of an earnings base that remains highly sensitive to trading volumes, crypto activity, and retail sentiment. Until the newer layers contribute more meaningfully and more consistently, the market may remain reluctant to reward the company with a steadier valuation framework.
From here, investors are likely to watch three things closely:
whether asset growth leads to more stable revenue streams
whether newer products gain enough scale to reduce earnings dependence on trading
whether Robinhood can retain users as they become more sophisticated, rather than losing them to more traditional platforms
Robinhood’s Coming-of-Age
Robinhood looks more credible today than it did in its meme-stock era. Its product range is broader, its customer base is larger, and management is clearly trying to grow wallet share rather than rely only on trading activity.
But the transition is not complete. The business is still exposed to trading volumes, crypto cycles, market sentiment, and retail participation, which means the re-rating case still needs firmer proof. The challenge is no longer product expansion by itself. It is whether those newer products can gradually reduce Robinhood’s dependence on trading-driven revenue.
Robinhood’s next phase will be judged less by headlines and more by whether it can turn platform expansion into steadier earnings, deeper customer relationships, and a more durable role in how users manage money.
We equip traders with the tools, insights, and execution capabilities to navigate these transformative shifts, helping you position ahead of major market developments. Join today.
Click here for Refresher!
What is Robinhood trying to become? Robinhood is trying to evolve from a retail trading app into a broader consumer-finance platform with products across trading, cash management, credit, retirement, managed investing, and private-market access.
Why is Robinhood still considered cyclical? Robinhood is still considered cyclical because a significant part of its revenue depends on trading activity, crypto sentiment, retail risk appetite, and overall market conditions.
Why does Robinhood’s buyback matter? The $1.5 billion buyback signals management confidence in the company’s capital position and long-term value, although it does not remove concerns about earnings volatility.
What is the bull case for Robinhood stock? The bull case is that Robinhood can grow wallet share, deepen product usage, and eventually be valued more like a diversified fintech platform rather than a trading-led business.
What is the bear case for Robinhood stock? The bear case is that Robinhood’s earnings remain heavily exposed to trading cycles, crypto activity, and market sentiment, which could keep the stock volatile if growth slows or activity declines.
Start trading now – Click here to create your real VT Markets account
Written on March 26, 2026 at 1:29 am, by josephine
USDX edges lower to 99.576, after a strong prior session.
Fed funds futures show a 64.4% probability of no rate change by December.
Markets remain headline-driven amid Middle East uncertainty.
The U.S. dollar eased slightly in Asian trading, with the USDX dipping 0.1% to 99.576, after posting its strongest daily gain in a week.
The pullback reflects a shift in expectations around Federal Reserve policy, as traders reduce bets on further tightening. Markets are now pricing a 64.4% probability that the Fed will remain on hold in December, up from 60.2% just a day earlier.
Federal Reserve Chair nominee Kevin Warsh wants to significantly shrink the US central bank’s $6.6 trillion balance sheet. He’ll probably need more than one term to do it, according to a top financial economist. https://t.co/NhPebH0O22
This adjustment highlights how quickly sentiment is shifting as inflation expectations are reassessed in light of recent developments.
The dollar may consolidate near current levels as markets wait for clearer policy direction.
‘Strait Talk’ Keeps Markets on Edge
The broader market tone remains cautious, with traders closely watching developments in the Middle East.
Iran signalled it is reviewing a U.S. proposal to end the conflict, but also stated it has no intention to engage in direct talks, leaving uncertainty elevated.
Iran said it rejected a US ceasefire proposal and issued its own conditions for the end of the war. https://t.co/R0GbkXsxil
Markets are reacting to each headline, with analysts describing conditions as “decisively headline-driven”. Traders are trying to determine whether recent signals point to de-escalation or a prolonged conflict.
Iran's grip on the Strait of Hormuz shows that chokepoints in geography, trade and technology can shift the global balance of power, @halbrands writes (via @opinion) https://t.co/pXLsWYkNZ0
This uncertainty is limiting directional conviction across currencies and equities.
Continued mixed signals may keep volatility elevated and prevent strong trend formation.
Oil Prices and Inflation Expectations Drive Policy Outlook
The earlier closure of the Strait of Hormuz pushed energy prices higher, forcing markets to reconsider inflation risks.
The Iranian parliament is working on a draft bill to charge a fee in exchange for providing security to ships passing through the Strait of Hormuz, according to the semi-official Fars news agency https://t.co/BlnzJSFiLi
However, as oil prices stabilise, traders are beginning to question whether the inflation shock will persist long enough to justify tighter monetary policy.
There is a growing view that central banks, including the Fed, may choose to look through the energy-driven inflation spike rather than react aggressively.
This shift has reduced expectations for rate hikes and is now influencing currency positioning.
Diverging Central Bank Signals Create Currency Tension
Currency markets are increasingly driven by diverging central bank expectations.
The euro edged up 0.1% to $1.1570, supported by comments from the European Central Bank suggesting rate hikes remain possible if inflation persists.
At the same time, the dollar slipped 0.1% to 159.39 against the yen, even as it trades near its strongest levels since 2024.
In Japan, rising bond yields and expectations of policy tightening are adding complexity. Markets are pricing a 61.9% probability of a rate hike to 1% at the Bank of Japan’s April 28 meeting.
This creates a potential shift in relative rate dynamics, particularly if the Fed remains on hold while other central banks lean toward tightening.
Currency pairs may remain range-bound as policy divergence becomes the main driver.
Technical Analysis
US Dollar Index (USDX) is trading near 99.45, marginally higher on the session, as the dollar continues to consolidate just below the 100 level. Price action reflects a pause after the recent recovery from the 95.33 low, with momentum flattening in the near term.
Technically, the structure remains constructive but indecisive. The 5-day MA (99.20) and 10-day MA (99.38) are tightly clustered around current price, indicating a lack of strong directional bias. Meanwhile, the 20-day (99.06) and 30-day (98.52) continue to slope upward, suggesting the broader recovery trend is still intact.
Key levels to watch:
Support:99.00 → 98.50 → 97.80
Resistance:100.30 → 100.70 → 101.00
The index is currently trading within a tight range between 99.00 and 100.30, with repeated rejection near the 100.30 resistance zone. This level remains a key barrier, and a breakout above it would likely signal renewed bullish momentum toward 100.70 and beyond.
On the downside, 99.00 is acting as immediate support. A break below this level could lead to a pullback toward 98.50, where the 20-day average provides additional support.
Volume has tapered slightly, reinforcing the view that the market is in a consolidation phase rather than trending.
Overall, USDX appears to be coiling below major resistance, with the broader bias still mildly bullish. A decisive move above 100.30 or below 99.00 will likely determine the next directional leg, particularly as the dollar reacts to evolving rate expectations and macro developments.
What Traders Should Watch Next
Markets remain highly reactive to both macro and geopolitical signals. Key drivers include:
Developments in Middle East negotiations.
Oil price direction and supply conditions.
Federal Reserve policy signals and inflation data.
Divergence between global central banks.
For now, the dollar is holding firm but lacks strong momentum, with traders waiting for clearer signals before committing to the next directional move.


