Back

CHF vs JPY: Identifying the Superior Safe-Haven Currency in 2026 | VT Markets

Key Takeaways:

  • A safe haven currency appreciates during market stress as investors move capital into stable economies with low debt and resilient financial systems.
  • Selection depends on the risk source. The Swiss franc (CHF) leads to European or Middle Eastern tensions, while the Japanese yen (JPY) offers more aggressive moves during global deleveraging or US recessions.
  • The Swiss National Bank maintains a 0% policy rate and uses direct FX intervention to manage structural strength, which may cap the upside for CHF traders.
  • The Bank of Japan raised rates to 0.75%, but the 150 to 200 basis point gap with US rates continues to fuel carry trades until a major shock occurs.
  • Understanding the specific driver of a market move is more critical than identifying the direction alone, as regional vs global shocks trigger different currency responses.

Smart Money Rotation: Identifying the 2026 Safe Haven

When risk hits the markets, one question determines profits or losses: where does smart money go? In the world of currencies, that refuge has historically had two names — the Swiss franc (CHF) and the Japanese yen (JPY). However, in 2026, choosing between them is no longer straightforward. The rules of the game have shifted.

What is a safe-haven currency, and why does it matter now?

A safe-haven currency is one that tends to appreciate during periods of market stress. Not because it inherently becomes more valuable, but because investors rotate into economies perceived as stable — those with low debt, strong institutions, and resilient financial systems. Both the Swiss franc and the Japanese yen have long fulfilled this role, attracting capital during episodes of risk aversion.

The current macro backdrop makes this comparison particularly relevant. Persistent geopolitical tensions in the Middle East, ongoing trade uncertainty linked to Trump’s tariff policies, a softer US dollar, and central banks balancing inflation against slowing growth have created a fragile environment. In such conditions, understanding which safe haven is likely to outperform offers a tangible edge.

How do CHF and JPY react to different crises?

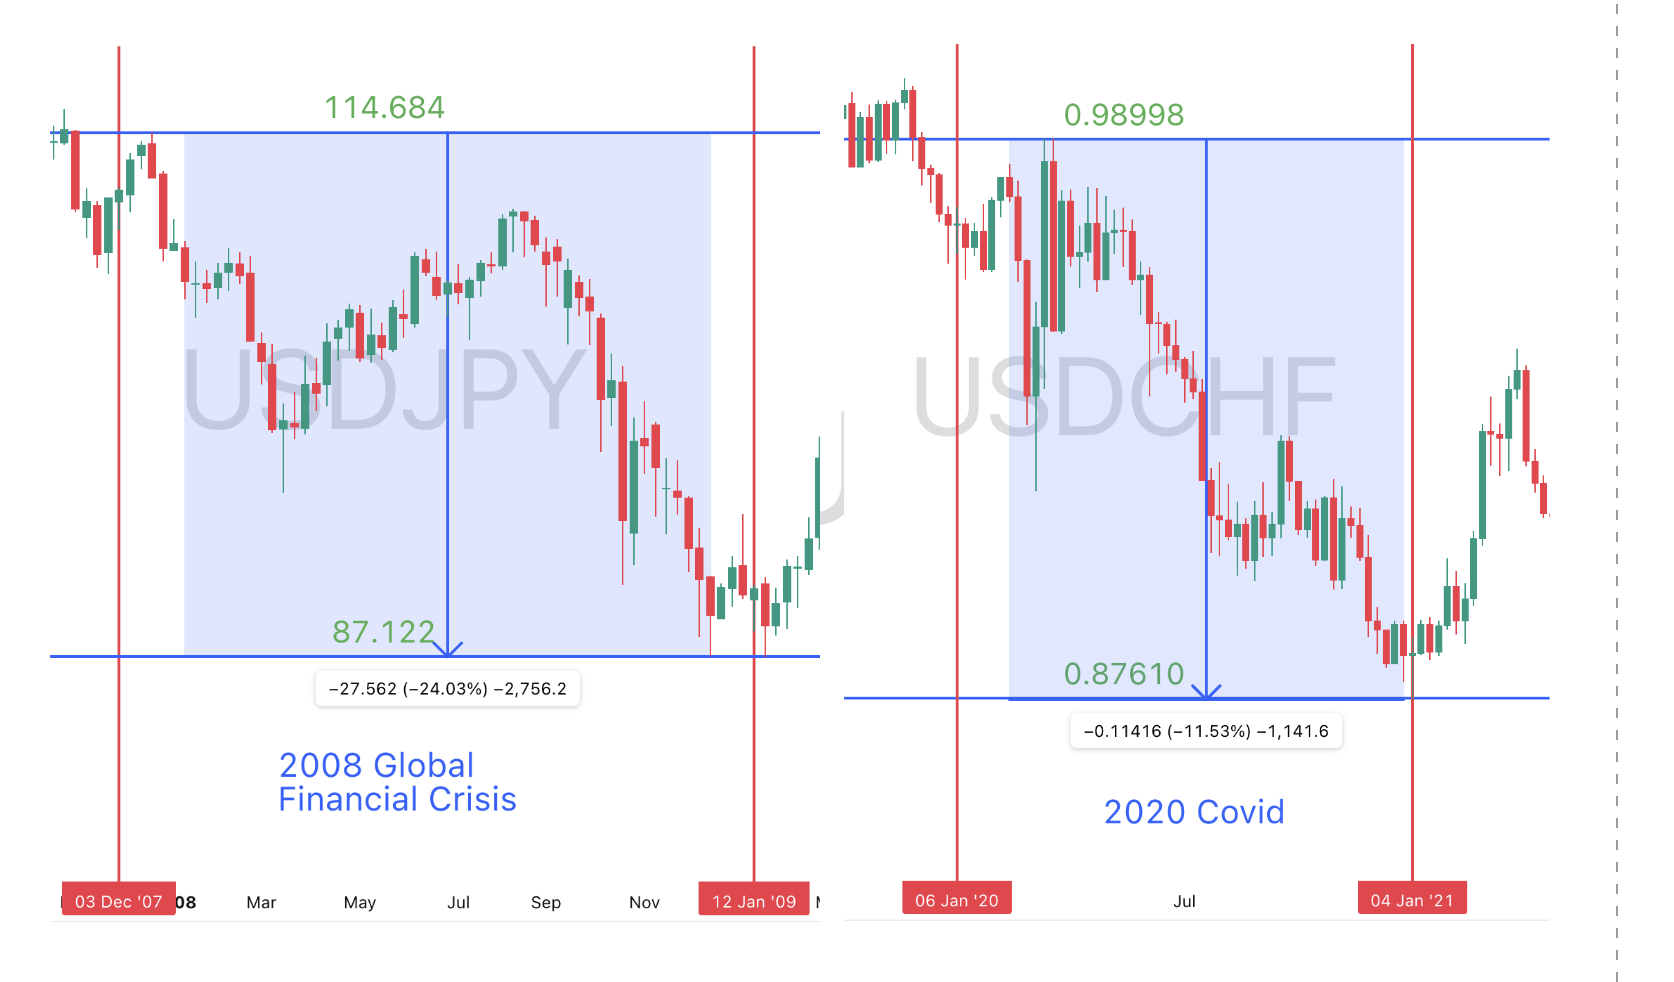
Historically, CHF and JPY do not react identically to crises. The Swiss franc tends to outperform during periods of European stress — such as sovereign debt crises or regional geopolitical tensions — while the yen is more sensitive to global shocks, particularly those involving the unwinding of carry trades (where investors borrow in low-yielding yen to invest in higher-yielding assets).

This content is only supported in a Lark Docs

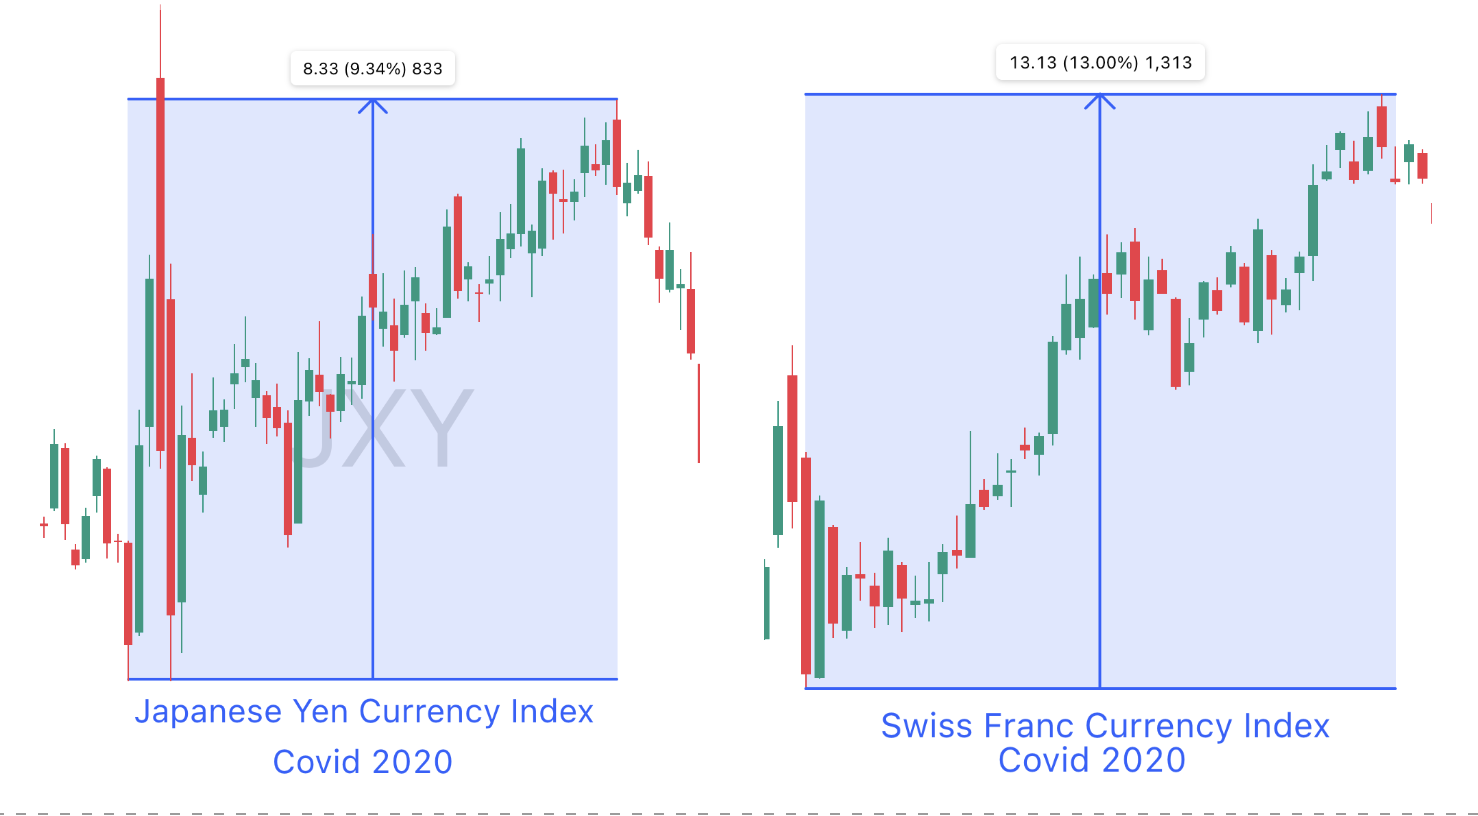
During the Global Financial Crisis and the COVID-19 shock, both currencies benefited from broad risk aversion. However, not every yen rally signals fear. For example, the 2024 yen surge was largely driven by the unwinding of crowded carry trades rather than genuine safe-haven demand. This distinction is crucial: positioning can move markets just as much as macro fear.

In 2025, the Swiss franc clearly led. It behaved as the dominant G10 risk-off currency, strengthening consistently during periods of geopolitical tension.

The drivers of each currency in 2026

The Swiss franc: structural strength with a visible ceiling

The Swiss National Bank (SNB) maintained its policy rate at 0% in March 2026, with inflation projected at just 0.5% for the year. With rates already at the lower bound, the SNB has limited conventional policy tools remaining. Its primary response has been direct intervention in the foreign exchange market to prevent excessive franc appreciation.

Most economists expect the SNB to keep rates unchanged throughout 2026, relying on currency intervention as its main policy lever.

This creates a unique dynamic: the franc is structurally strong, but its upside is actively managed. For traders, this means CHF strength may be capped, even in risk-off conditions.

The yen: normalising, but gradually

The yen is undergoing a quiet but important transition. The Bank of Japan has raised its benchmark rate to 0.75% — its highest level since 1995 — signalling a gradual shift towards policy normalisation.

In theory, this should support the yen. However, reality is more nuanced. The interest rate differential between Japan and the United States is narrowing but remains significant. Even under a dovish Federal Reserve scenario, US rates are likely to exceed Japan’s by 150–200 basis points.

As long as this gap persists, the carry trade will continue to exert downward pressure on the yen, limiting sustained appreciation outside of risk-off episodes.

Who wins in 2026?

The answer depends less on the currency itself and more on the nature of the risk driving the market.

If risk originates from Europe or the Middle East, the Swiss franc is likely to outperform. Its track record, Switzerland’s fiscal strength, and the SNB’s credibility position it as the preferred destination for defensive capital. Strong current account surpluses, low inflation, and political neutrality further reinforce its appeal.

If the shock is global — such as a US recession, equity market collapse, or large-scale deleveraging — the yen tends to deliver sharper, more aggressive moves. In such scenarios, the unwinding of carry trades can accelerate gains rapidly. Goldman Sachs estimates that in a rising US recession scenario, the yen could strengthen towards 140 per dollar, representing a meaningful appreciation from current levels.

For CFD traders, the implication is clear: it is not enough to identify market direction — you must also understand the underlying driver of the move.

  • Regional episodes → higher probability of CHF strength
  • Global deleveraging → more aggressive moves in JPY

In 2026, the safe haven is no longer a fixed asset. It is a strategic choice.

Understanding the type of crisis you are trading may ultimately matter more than the trade itself.

The Big Questions
  1. Which currency is the best safe haven in 2026?

The choice depends on the origin of market risk. The Swiss franc (CHF) typically outperforms during regional European or Middle Eastern instability. The Japanese yen (JPY) tends to see more aggressive appreciation during global shocks like a US recession or broad equity market collapses.

  1. How does the Bank of Japan interest rate affect the yen in 2026?

The Bank of Japan raised its benchmark rate to 0.75 percent. While this signals policy normalization, a significant interest rate gap of 150 to 200 basis points still exists between Japan and the United States. This gap maintains pressure on the yen through carry trades until a major risk event occurs.

  1. Why does the Swiss National Bank intervene in the currency market?

The Swiss National Bank maintains a policy rate of 0 percent and projects very low inflation of 0.5 percent. With limited conventional tools left, the bank uses direct foreign exchange intervention to prevent excessive franc appreciation. This strategy effectively creates a ceiling for CHF strength.

  1. What is the definition of a safe haven currency?

A safe haven currency is an asset that appreciates during periods of market stress. Investors rotate into these currencies because they represent economies with low debt, strong institutions, and resilient financial systems.

  1. When does the Japanese yen experience the sharpest moves?

The yen delivers its most aggressive gains during global deleveraging episodes. In these scenarios, the rapid unwinding of crowded carry trades accelerates the appreciation of the yen against the dollar.

  1. Is the Swiss franc still a reliable hedge for geopolitical tension?

Yes, the Swiss franc remains a preferred destination for defensive capital due to Switzerland’s fiscal strength and political neutrality. It behaved as the dominant G10 risk off currency throughout 2025.

Start trading now – Click here to create your real VT Markets account

Dollar Pauses After a Strong Safe-Haven Run

Key Points

  • USDX trades at 99.636, down 0.025 (-0.03%), while Reuters reported the broader dollar index at 99.79, still close to recent highs.
  • Traders now price a 64.4% probability that the Fed stays on hold in December, up from 60.2% a day earlier.
  • USDJPY trades near 158.73 to 159.45, with the yen recovering from this year’s low at 160.46 as intervention fears ease and BOJ hike expectations build.

The dollar eased slightly in Asian trade, but it has not lost its broader footing. Reuters reported the USDX at 99.79, down marginally on the day after a strong prior-session gain, while your chart shows USDX at 99.636, down 0.03%.

The move reflects a market that has stopped chasing the dollar higher for now, but has not found a clear reason to abandon it either.

Ceasefire hopes are the immediate reason for the pause. Traders have become a little less aggressive about buying dollars as headlines suggest Washington may be looking for an off-ramp in the Iran war.

At the same time, mixed signals from the White House, the Pentagon, and regional allies have kept conviction low. Markets are still trading headline to headline rather than building strong directional positions.

A softer dollar here looks more like consolidation than reversal. The greenback still holds support from its safe-haven status and from the fact that the US is better insulated from oil disruption than major importers. Reuters noted that the dollar has benefited from that relative position since the conflict began in late February.

Fed Expectations Have Shifted Toward a Longer Hold

The rates market has changed the tone. Fed funds futures now imply a 64.4% probability that the Fed remains on hold in December, up from 60.2% the day before. That is a clear sign that traders are backing away from the idea of an easier policy later this year.

Oil has driven much of that repricing. The closure of the Strait of Hormuz pushed energy prices sharply higher, and that forced markets to revisit inflation assumptions.

A ceasefire and a sharp drop in oil could remove the inflation premium from rates quickly, but until that happens, traders are still reacting to the shock already in the system.

That backdrop keeps the dollar supported even as it pauses. Higher-for-longer Fed pricing makes it harder for the greenback to weaken much unless the data softens or oil drops decisively.

Euro Has Started to Stabilise

The euro has found a little support as the dollar stalls. Reuters reported EURUSD at $1.1565, while your chart shows 1.14696, which suggests the market has been volatile across sessions. In Reuters’ reporting, the euro has started to stabilise after the ECB opened the door to rate hikes if war-driven inflation lasts.

Societe Generale said a euro bounce is possible if the ECB hikes while the Fed stands aside.

That does not mean the euro has a clean path higher. Europe still faces greater energy-shock exposure than the US, so any sustained advance in EURUSD would likely require both lower oil prices and a firmer ECB stance.

Technical Analysis

US Dollar Index (USDX) is trading near 99.63, pulling back slightly after testing highs around the 100.40–100.50 region. Price action shows the dollar pausing just below resistance, with the recent rally losing some momentum as the market consolidates near the upper end of its range.

From a technical standpoint, the trend remains mildly bullish. Price is holding above the 20-day (99.34) and 30-day (98.90) moving averages, which continue to slope upward and provide underlying support. The 5-day (99.81) and 10-day (99.46) are clustered close to current levels, reflecting short-term indecision as price compresses just below resistance.

Key levels to watch:

  • Support: 99.30 → 98.90 → 97.90
  • Resistance: 100.40 → 100.70 → 101.00

The index is currently consolidating below the 100.40–100.50 zone, which has capped recent upside attempts. A sustained break above this level could trigger further gains toward 100.70 and potentially 101.00, especially if momentum builds.

On the downside, 99.30 is acting as immediate support. A break below this level could lead to a pullback toward 98.90, though such a move would likely remain corrective as long as the broader structure holds.

Overall, the USDX remains in a gradual uptrend, with current price action suggesting consolidation rather than reversal. However, with price sitting just below key resistance, traders should watch closely for either a breakout or a deeper pullback as the next directional move develops.

What Traders Should Watch Next

Friday’s US jobs report is the next big macro test. Reuters said economists expect 60,000 jobs added in March after an unexpected 92,000 loss in February. A weak print would likely revive Fed cut expectations and pressure the dollar. A firmer print would reinforce the current higher-for-longer stance.

The other driver is still oil. A clear de-escalation that reopens Hormuz and pushes crude lower would take some of the inflation premium out of rates and remove support from the dollar. Another escalation would do the opposite.

Learn more about trading Indices on VT Markets today.

Trader Questions

Why is the US Dollar Holding Near 100 Instead of Breaking Higher?

The dollar is still supported by safe-haven demand and a more cautious Fed outlook, but ceasefire hopes have reduced the urgency of fresh defensive buying. Reuters reported the dollar index near 99.79, while your chart shows USDX at 99.636, both still close to recent highs.

What is Keeping the Dollar Supported Right Now?

Three forces are doing most of the work: Middle East uncertainty, higher-for-longer Fed pricing, and the US economy’s relative insulation from oil shocks as a net energy exporter. Reuters said those factors have kept the greenback supported since the conflict began in late February.

Why Did the Dollar Ease if Geopolitical Risks Are Still High?

Markets started to price a possible off-ramp in the conflict after comments from US officials suggested the war could end within weeks. At the same time, Pentagon and regional headlines still pointed to escalation risk, which left traders cutting back aggressive dollar longs rather than fully reversing them.

What Do Markets Expect From the Federal Reserve Now?

Fed funds futures imply a 64.4% probability that the Fed stays on hold in December, up from 60.2% a day earlier. That shift shows traders are still leaning toward a longer hold because oil-driven inflation risk has not cleared.

Why Do Oil Prices Matter So Much for the Dollar Index?

Higher oil prices lift inflation expectations and reduce the chance of near-term Fed easing. That tends to support the dollar, especially when the US is less exposed to imported energy than Europe or Japan. Reuters said traders are still reacting to the inflation premium created by the Hormuz shock.

Start trading now – Click here to create your real VT Markets account

Nikkei 225 Jumps as Falling Oil Lifts Stocks

Key Points

  • The Nikkei 225 rose 3.58% to 52,889.85, while the broader Topix gained 2.5% to 3,648.78.
  • The BOJ Tankan showed large manufacturers’ sentiment at +17 versus a +16 forecast, while large non-manufacturers came in at +36 against a +33 forecast.
  • WTI crude fell $1.28, or 1.24%, to $101.60, easing some pressure on Japan’s import-heavy economy.

Japanese equities bounced hard after oil prices pulled back and Wall Street delivered a strong lead. The Nikkei 225 climbed 3.58% to 52,889.85, snapping a four-session losing streak, while the Topix rose 2.5% to 3,648.78.

Lower crude prices gave traders a reason to buy risk again. Japan imports most of its energy, so a drop in oil cuts pressure on company costs, household spending, and inflation expectations. Reports that Washington was willing to push for a diplomatic reopening of the Strait of Hormuz helped drive WTI down $1.28 to $101.60 per barrel.

The rebound was strong, but the market is still trading off headline risk. Oil remains high, and the Middle East conflict has not been resolved.

Tankan Data Supports the Bounce

The latest BOJ Tankan survey gave the market a second reason to rally. Large manufacturers’ sentiment rose to +17 in March from +15 in December, beating the +16 forecast. Large non-manufacturers improved to +36 from +34, ahead of the +33 forecast.

The survey showed firms were holding up better than expected even after the energy shock. Reuters also reported that large companies plan to raise capital expenditure by 3.3% in fiscal 2026, above the 3.0% median forecast.

That mix supported the rebound because it suggested the corporate sector had not rolled over. The outlook components were softer, though, so companies are still preparing for a tougher backdrop if energy prices rise again.

Global Markets Add Support

Wall Street handed Asia a strong lead. The Nasdaq rose 3.8%, the S&P 500 gained 2.9%, and the Dow added 2.5%. European markets also closed higher, with the CAC 40 up 0.6% and both the DAX and FTSE 100 up 0.5%.

The yen also moved away from the most pressured part of its recent range. Reuters reported it traded near 158.55 per dollar, firmer than the 160.46 low seen earlier this year.

A steadier yen reduces some of the stress around imported inflation, even if it trims part of the export boost from a weaker currency.

Technical Analysis

Nikkei 225 is trading near 53,130, attempting a modest rebound after a sustained pullback from the 60,077 high. Price action shows the market trying to stabilise after a series of lower highs and lower lows, though upside momentum remains limited as the index continues to trade below key resistance levels.

From a technical standpoint, the trend has shifted to neutral to bearish in the short term. Price is trading below the 10-day (52,609) and 20-day (53,380) moving averages, which are now acting as overhead resistance, while the 30-day (54,761) continues to slope downward, reinforcing the loss of upward momentum. The 5-day (52,234) is beginning to turn higher, suggesting a short-term bounce, but this remains corrective unless stronger follow-through develops.

Key levels to watch:

  • Support: 50,500 → 48,000 → 47,000
  • Resistance: 53,400 → 54,700 → 57,500

The index is currently testing the 53,300–53,400 zone, which aligns with the 20-day average and has capped recent recovery attempts. A sustained break above this area could open the way toward 54,700, where the 30-day average may present stronger resistance.

On the downside, 50,500 remains the key near-term support. A break below this level would signal renewed selling pressure and could expose a move toward 48,000.

Overall, the Nikkei 225 is in a corrective phase following its earlier rally, with price still struggling to reclaim key moving averages. Unless the index can push decisively above the 53,400 level, rallies are likely to face resistance, keeping the near-term bias tilted to the downside.

What Traders Should Watch Next

The next move depends on whether oil stays off the highs, whether the Iran conflict cools further, and whether Japanese data keeps showing resilience. Another drop in crude would support importers, banks, and domestic cyclicals. A fresh spike in energy prices would put inflation and margins back under pressure quickly.

Learn more about trading Indices on VT Markets today.

Trader Questions

Why Did the Nikkei 225 Rise So Strongly?

The Nikkei 225 rose 3.58% to 52,889.85 as lower oil prices eased pressure on Japan’s import-heavy economy and stronger global equities improved risk appetite.

How Did Falling Oil Prices Help Japanese Stocks?

Japan imports most of its energy, so lower crude prices reduce cost pressure on companies, ease imported inflation, and support household spending. WTI fell $1.28, or 1.24%, to $101.60 in the move that helped lift sentiment.

What Did the Tankan Survey Show?

The BOJ Tankan showed large manufacturers’ sentiment at +17 versus a +16 forecast, while large non-manufacturers came in at +36 against a +33 forecast. Large firms also planned 3.3% capex growth for fiscal 2026, ahead of the 3.0% median forecast.

Why Did Exporters, Banks, and Chip Stocks Lead the Rally?

Exporters benefited from improved global sentiment, banks tracked the rebound in cyclical risk appetite, and chip names followed the strong move in US tech. The session also showed broad participation, which gave the rebound more strength than a narrow bounce.

Why Did Inpex Lag The Market?

Lower oil prices reduced support for energy producers, and Inpex fell 2.6% while most of the broader market rallied.

Start trading now – Click here to create your real VT Markets account

Dividend Adjustment Notice – Mar 31 ,2026

Dear Client,

Please note that the dividends of the following products will be adjusted accordingly. Index dividends will be executed separately through a balance statement directly to your trading account, and the comment will be in the following format “Div & Product Name & Net Volume”.

Please refer to the table below for more details:

Dividend Adjustment Notice

The above data is for reference only, please refer to the MT4/MT5 software for specific data.

If you’d like more information, please don’t hesitate to contact info@vtmarkets.com.

Notification of Trading Adjustment – Mar 31 ,2026

Dear Client,

The trading hours of some MT4/MT5 products will change due to the upcoming Daylight-Saving Time change in Australia.

Please refer to the table below outlining the affected instruments:

Notification of Trading Adjustment

The above information is provided for reference only; please refer to the MT4/MT5 software for specific data.

If you’d like more information, please don’t hesitate to contact info@vtmarkets.com

EURUSD Slips as Oil Shock Reshapes ECB Outlook

Key Points

  • EURUSD trades at 1.14696, up +0.00071 (+0.06%), but the euro ended March below $1.15 after losing more than 2% against the dollar during the month.
  • Markets now expect at least two ECB rate hikes in 2026, replacing earlier pricing that implied a 40% chance of a rate cut.
  • Rising energy costs and a largely blocked Strait of Hormuz are feeding inflation fears across Europe and weighing on the euro.

The euro closed March below $1.15, leaving the single currency close to its weakest level in nearly two weeks. The broader picture is more telling than the small day-to-day moves. Over the month, the euro lost more than 2% against the dollar as traders worked through the economic fallout from the deeper Middle East conflict.

That decline reflects a market that has become less confident in Europe’s near-term growth outlook. When energy costs rise sharply, the euro zone tends to feel the pain quickly because it remains heavily exposed to imported energy.

That mix can hurt growth, keep inflation high, and leave the euro caught between weak activity and tighter policy expectations.

If energy prices stay elevated and the conflict remains unresolved, EURUSD may struggle to build a strong rebound and could stay heavy around the mid-1.14 area.

Oil Shock Forces a Sharp Rethink on ECB Policy

The biggest shift this month has been in rate expectations. Soaring oil prices have pushed inflation fears higher across Europe, and that has forced markets to radically reprice the European Central Bank path.

Investors now anticipate at least two interest rate hikes in 2026. Earlier, the market had been pricing a 40% chance of a rate cut instead. That is a sharp swing in expectations, and it tells you just how much the energy shock has changed the tone.

In theory, more rate hikes should help the euro. In practice, the euro has still weakened because the market sees the hikes as defensive rather than growth-positive. Tighter policy in response to an oil shock does not necessarily improve the outlook for risk assets or the currency if the economy is also slowing.

French central bank chief François Villeroy de Galhau reinforced that cautious tone by saying the ECB remains committed to containing energy-driven inflation, but also warned it is “too early” to say when any move will come.

If ECB officials keep sounding worried about inflation but reluctant to commit on timing, EURUSD may remain range-bound rather than stage a clean recovery.

Middle East Tensions Keep Pressure on the Euro

Geopolitics remains at the centre of the move. A Wall Street Journal report said former US President Donald Trump had signalled a possible end to the US military campaign against Iran, even if the Strait of Hormuz remained largely blocked.

That is important because the market is no longer trading just the risk of war. It is trading the risk of an energy bottleneck that may outlast the most intense phase of direct military action. A blocked or partially blocked Strait keeps freight, insurance, and crude costs elevated. Europe feels that quickly.

This helps explain why the euro has not benefited much from any relief headlines. Traders are looking past diplomatic tone and focusing on physical energy flows.

Even if the conflict cools at the political level, EURUSD may stay under pressure if oil routes remain disrupted and inflation stays sticky.

Technical Analysis

EURUSD is trading near 1.1470, hovering just above recent lows as the pair struggles to recover from its broader decline following the rejection from the 1.2080 high. Price action shows continued downside pressure, with rallies failing to hold and sellers stepping in on strength, keeping the pair under sustained resistance.

From a technical standpoint, the trend remains bearish. Price is trading below all key moving averages, with the 5-day (1.1506) and 10-day (1.1535) positioned just above current levels, acting as immediate resistance. The 20-day (1.1550) and 30-day (1.1620) continue to slope downward, reinforcing the weakness in the broader structure and confirming that momentum remains tilted to the downside.

Key levels to watch:

  • Support: 1.1410 → 1.1350 → 1.1300
  • Resistance: 1.1500 → 1.1550 → 1.1620

The pair is currently consolidating below the 1.1500–1.1550 zone, which has capped recent upside attempts. A break above this region would be needed to ease immediate bearish pressure and open a move toward 1.1620, though momentum would still need to build to sustain a broader recovery.

On the downside, 1.1410 remains the key near-term support. A break below this level could trigger a move toward 1.1350, with further downside risk if selling accelerates.

Overall, EURUSD remains in a clear downtrend, with price action suggesting continued pressure on support levels. Unless the pair can reclaim the 1.1550 area, rallies are likely to be sold into, keeping the bias skewed to the downside in the near term.

What Traders Should Watch Next

The euro now sits at the intersection of three forces: energy prices, ECB repricing, and geopolitical headlines. For the next move, traders will need to see whether oil stays high, whether the ECB becomes more explicit about the new rate path, and whether the Strait of Hormuz remains effectively constrained.

If oil cools and freight risk eases, EURUSD could stabilise quickly. If Europe keeps importing an energy shock while policy turns more defensive, the euro may stay under pressure even with rate-hike expectations rising.

Learn more about trading Forex Pairs on VT Markets here.

Trader Questions

Why Did EURUSD End March Below 1.15?

EURUSD ended March below $1.15 because the euro lost more than 2% against the dollar during the month as traders priced the economic damage from the Middle East conflict and the inflation shock caused by higher energy costs.

Why Can the Euro Fall Even if Markets Expect Ecb Rate Hikes?

The euro can still weaken when rate hikes are driven by an oil shock rather than stronger growth. Markets now expect at least two ECB rate hikes in 2026, but the euro zone is also more exposed to expensive imported energy, which hurts growth and offsets the usual support from higher rates.

What Has Changed in ECB Expectations?

Markets have swung from pricing a 40% chance of a rate cut earlier to pricing multiple ECB hikes in 2026. Reuters reported that markets are now forecasting three rate hikes in 2026, with the first expected by June, which shows how sharply the energy shock has changed rate expectations.

Why Does the Strait of Hormuz Matter So Much for EURUSD?

The Strait of Hormuz matters because it carries about 20% of the world’s oil and a large share of LNG. If it stays largely blocked, Europe faces higher import costs, higher inflation, and weaker growth, which can keep pressure on the euro.

Did Relief Headlines Around Trump Help the Euro?

Only briefly. Reuters reported that the Wall Street Journal said Trump was open to ending the military campaign even if Hormuz stayed shut, which gave markets some relief. But oil stayed elevated and traders kept focusing on energy flows rather than political tone alone.

What Did François Villeroy De Galhau Say About ECB Policy?

Villeroy said the ECB is ready to act against energy-driven inflation, but that it is too early to discuss the timing of any rate hike. That message supports a hawkish bias, but it does not yet give traders a firm timetable.

Start trading now – Click here to create your real VT Markets account

Bitcoin Holds Near $67k to New Crypto Rule

Key Points

  • The US Labour Department has proposed a rule that would give 401(k) fiduciaries a process-based path to consider alternative assets, including crypto, rather than steering them away from specific asset classes.
  • BTCUSD trades near 67,504.63, up +865.24 (+1.30%), after failing to hold moves above $68,000 earlier in the week.
  • The proposal focuses on prudence, fees, liquidity, valuation methods, benchmarks, and complexity, which could support long-term institutional access without guaranteeing immediate inflows.

Although the Bitcoin market remains cautious in the near term, the policy environment has just changed in a significant way in the long run.

The US Department of Labour, through the Employee Benefits Security Administration, has proposed a regulation that would set out the steps 401(k) plan managers should take when considering alternative assets in plan menus.

The proposal also creates process-based safe harbours for fiduciaries selecting designated investment alternatives.

In simple terms, it does not tell fiduciaries to buy crypto, but it does give them a clearer route to consider it without the same level of regulatory ambiguity that weighed on the market before.

That is a meaningful shift from the department’s 2022 guidance, which urged “extreme care” around adding crypto to 401(k) plans. The department formally rescinded that 2022 guidance in May 2025, saying it had departed from ERISA’s historically neutral, principles-based approach.

This does not create an instant demand shock for Bitcoin, but it does improve the long-term policy narrative. If the rule moves forward in something close to its current form, it could gradually lower one of the institutional barriers that have limited retirement-plan adoption.

What the Rule Actually Does

The proposal is process-driven, not promotional. The Labour Department says fiduciaries would need to evaluate potential alternatives using factors such as expected performance, fees, liquidity, valuation methods, appropriate performance benchmarks, and complexity. The department also stresses that the rule is asset-class neutral.

That distinction matters for Bitcoin. It means crypto would be assessed alongside other alternatives under a prudent framework rather than singled out for unusual treatment. It also means fiduciaries still carry real responsibility. They would need to justify how any crypto-related option fits participant needs, risk controls, cost structure, and operational oversight.

For the Bitcoin market, that is more constructive than a blanket warning, but it is still far from a green light for reckless inclusion.

Larger plans and better-resourced fiduciaries may be more willing to study crypto exposure first, while smaller plans may still wait due to governance, operational, and reputational concerns.

Why This Matters for Bitcoin Even Without Immediate Buying

Bitcoin often reacts hardest to ETF flows, macro liquidity, and Fed expectations in the short term. Retirement-plan policy works differently. It changes the addressable market slowly.

A formal framework for 401(k) fiduciaries could matter because retirement assets sit in one of the deepest pools of long-duration capital in the United States. Even a small future allocation rate would change how investors think about Bitcoin’s structural demand profile.

At the same time, the market is unlikely to price all of that in at once. Fiduciaries move slowly. Committees move slowly. Consultants move slowly. Recordkeepers and plan providers move slowly. That is why this news can be strategically important without being immediately explosive for the price.

The proposal can support the “institutional maturation” story for Bitcoin over time, but traders will still need a cleaner macro backdrop before they price in a stronger, sustained move.

Technical Analysis

Bitcoin (BTCUSD) is trading near 67,500, attempting to stabilise after a sharp decline from the 97,900 high and a subsequent low around 60,000. Price action shows the market trying to base within a broad range, but upside momentum remains limited, with the pair struggling to reclaim higher ground.

From a technical standpoint, the trend is currently neutral to slightly bearish. Price is trading around the short-term moving averages, with the 5-day (67,151) and 10-day (68,635) clustered near current levels, offering little directional clarity. The 20-day (70,072) and 30-day (69,701) remain above price and are starting to flatten or slope lower, indicating that the broader trend has weakened following the earlier breakdown.

Key levels to watch:

  • Support: 65,000 → 60,000 → 58,000
  • Resistance: 68,600 → 70,000 → 72,000

Price is currently consolidating within the 65,000–70,000 range, with repeated rejections near the 68,600–70,000 zone capping upside attempts. A sustained break above 70,000 would be needed to shift momentum back toward the upside, potentially opening a move toward 72,000 and beyond.

On the downside, 65,000 is acting as immediate support. A break below this level could expose the 60,000 region, with further downside risk toward 58,000 if selling pressure accelerates.

Cautious Outlook

Overall, Bitcoin remains in a consolidation phase following its earlier correction, with price lacking strong directional conviction.

While the broader structure is not decisively bearish, the inability to reclaim higher resistance levels suggests that momentum remains fragile, and traders should watch for a breakout from the current range to guide the next move.

Create a live VT Markets account today to access our platform features, including market insights and educational content.

Trader Questions

What is the New 401(K) Crypto Proposal?

The proposal introduces a framework allowing retirement plans to consider alternative assets like Bitcoin (BTCUSD) under strict evaluation rules.

Does the Rule Allow Direct Investment in Bitcoin?

Yes, but indirectly. Plan fiduciaries can include crypto as an option if they follow a prudent, process-driven assessment.

What Are Safe-Harbour Rules in This Context?

Safe-harbour rules provide legal protection to plan managers who follow defined steps when evaluating and offering crypto investments.

What Must Fiduciaries Assess Before Adding Crypto?

They must review performance expectations, fees, liquidity, valuation methods, benchmarks, and the complexity of the asset.

Why Was Crypto Previously Limited in 401(K) Plans?

Earlier guidance discouraged crypto exposure due to regulatory uncertainty and fiduciary risk concerns.

How Does This Proposal Change the Landscape?

It shifts the focus from restricting asset classes to ensuring a disciplined evaluation process, giving fiduciaries more flexibility.

How Might This Impact Bitcoin Prices?

Greater institutional access through retirement funds could support long-term demand, though short-term moves still depend on macro factors.

Start trading now – Click here to create your real VT Markets account

Dividend Adjustment Notice – Mar 30 ,2026

Dear Client,

Please note that the dividends of the following products will be adjusted accordingly. Index dividends will be executed separately through a balance statement directly to your trading account, and the comment will be in the following format “Div & Product Name & Net Volume”.

Please refer to the table below for more details:

Dividend Adjustment Notice

The above data is for reference only, please refer to the MT4/MT5 software for specific data.

If you’d like more information, please don’t hesitate to contact info@vtmarkets.com.

Holiday Trading Adjustment Notice – Mar 30 ,2026

Dear Client,

Affected by international holidays, the trading hours of some VT Markets products will be adjusted. Please check the following link for the affected products:

Holiday Trading Adjustment Notice

Note: The dash sign (-) indicates normal trading hours.

Friendly Reminder:
The above data is for reference only, please refer to the MT4/MT5 software for specific data.

If you’d like more information, please don’t hesitate to contact info@vtmarkets.com.

Oil Holds Above $100 as Supply Risks Intensify

Key Points

  • WTI rises to $100.98, while Brent climbs 2.6% to $115.45.
  • Brent is up nearly 60% for the month, reflecting severe supply risks.
  • Saudi pipeline capacity of 6 million barrels per day now in focus.

Oil prices continued to climb in early trading, with WTI holding above $100 at $100.98, while Brent rose 2.6% to $115.45 per barrel.

The rally reflects mounting concern that the Middle East conflict is expanding, with Yemen’s Houthi rebels now entering the fray.

This development has shifted market focus away from just supply disruption toward the vulnerability of alternative export routes.

Oil may remain elevated if the conflict spreads further or disrupts key infrastructure.

Strait of Hormuz Closure Forces Route Diversification

With the Strait of Hormuz effectively closed, producers are turning to alternative pathways.

Saudi Arabia is now utilising its east-west pipeline to transport up to 6 million barrels per day to the Red Sea.

This route has become a critical lifeline for global oil flows, helping to offset some of the disruption.

However, the shift introduces new risks.

Analysts warn that this infrastructure could become a target, particularly as the conflict broadens.

Any disruption to this pipeline could trigger another sharp leg higher in oil prices.

Geopolitical Risks Deepen Market Uncertainty

Geopolitical tensions continue to escalate on multiple fronts.

Reports indicate that the U.S. is considering a military operation to extract nearly 1,000 pounds of uranium from Iran, raising the risk of further escalation.

At the same time, attacks linked to regional actors are increasing the threat to energy infrastructure and shipping routes.

This backdrop is reinforcing a risk premium in oil markets, with traders pricing in the potential for prolonged disruption.

Energy Shock Builds Inflation Pressures

The surge in oil prices is feeding directly into global inflation concerns.

With Brent up nearly 60% for the month, energy costs are rising sharply across the board.

This creates a challenging environment for central banks, as higher inflation may force policymakers to delay or abandon plans for easing.

The result is a tightening of financial conditions, which can weigh on broader economic growth.

Persistent high oil prices may keep inflation elevated and constrain policy flexibility.

Technical Analysis

Crude oil is trading near 102.00, holding firm after its recent surge toward the 119.40 high, with price now stabilising just above the psychological 100 level. The market is showing signs of consolidation following the sharp rally, but the underlying structure continues to reflect sustained bullish pressure, with buyers still active on dips.

From a technical standpoint, the trend remains firmly bullish. Price is trading well above all key moving averages, with the 5-day (95.30) and 10-day (95.20) positioned comfortably below current levels, providing immediate support. The 20-day (90.97) and 30-day (82.70) continue to slope upward, reinforcing the strength of the broader uptrend.

Key levels to watch:

  • Support: 100.00 → 95.00 → 90.00
  • Resistance: 102.00 → 105.00 → 110.00

Price is currently consolidating just above the 100–102 zone, which is acting as a short-term pivot. A sustained break above 105.00 could trigger renewed upside momentum toward 110.00, with further extension possible if buying pressure builds.

On the downside, 100.00 is acting as immediate support. A break below this level could lead to a deeper pullback toward 95.00, though such a move would likely remain corrective unless broader sentiment shifts.

Overall, crude oil remains in a strong uptrend, with current price action suggesting a pause rather than a reversal. However, with price holding near elevated levels after a rapid advance, traders should remain alert to potential volatility as the market works through this consolidation phase.

What Traders Should Watch Next

Oil markets remain highly sensitive to geopolitical developments. Key drivers include:

  • Security of alternative export routes, especially Saudi pipelines
  • Further escalation involving regional actors like the Houthis
  • Potential U.S. military actions and their impact on supply
  • Inflation expectations and central bank responses

For now, oil prices remain elevated, with supply risks and geopolitical tensions firmly in control of market direction.

Learn more about trading Energies on VT Markets here.

Trader Questions

Why Are Oil Prices Trading Above $100?

Oil prices have risen due to escalating Middle East tensions and disruptions to key supply routes like the Strait of Hormuz.

How Much Has Oil Increased Recently?

Brent crude is up nearly 60% for the month, while WTI is trading around $100.98 per barrel.

What Role Does the Strait of Hormuz Play in Oil Markets?

The Strait handles a large share of global oil shipments. Its disruption tightens supply and pushes prices higher.

How is Saudi Arabia Responding to Supply Disruptions?

Saudi Arabia is using its east-west pipeline to move up to 6 million barrels per day via the Red Sea.

Why is the Saudi Pipeline Important Right Now?

It serves as a key alternative route, but it may also become a target, increasing overall supply risk.

What Impact Could Further Escalation Have on Oil Prices?

Any attacks on infrastructure or expanded conflict could drive prices higher due to reduced supply.

Start trading now – Click here to create your real VT Markets account

Back To Top
server

Hello there 👋

How can I help you?

Chat with our team instantly

Live Chat

Start a live conversation through...

  • Telegram
    hold On hold
  • Coming Soon...

Hello there 👋

How can I help you?

telegram

Scan the QR code with your smartphone to start a chat with us, or click here.

Don’t have the Telegram App or Desktop installed? Use Web Telegram instead.

QR code