Back

USDJPY Holds as BOJ Doubt Keeps Yen Weak

Key Points

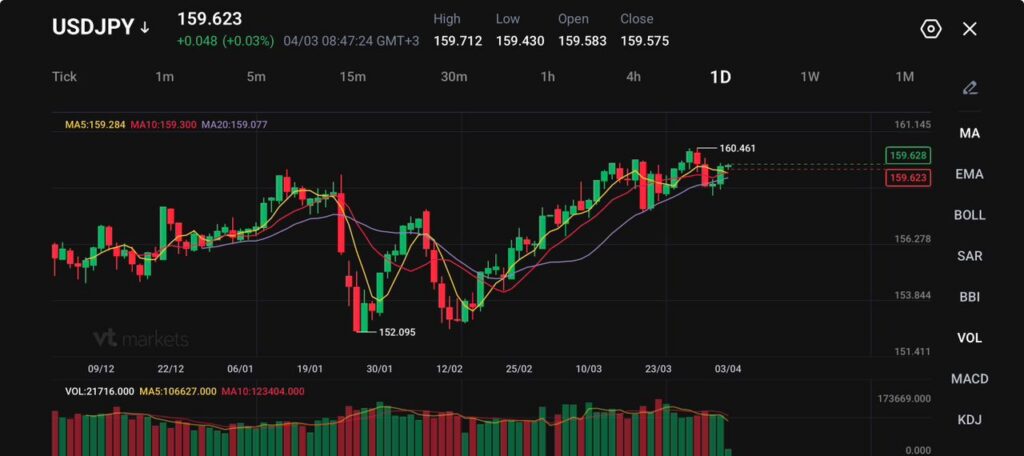
  • USDJPY trades at 159.623, up 0.048 (+0.03%), with price still pressing the upper end of the recent range.
  • Traders price roughly a 70% chance of a BOJ rate increase, which means a hold could jar markets already on edge.
  • Finance Minister Satsuki Katayama warned that speculative activity has increased in both currency and crude oil markets.

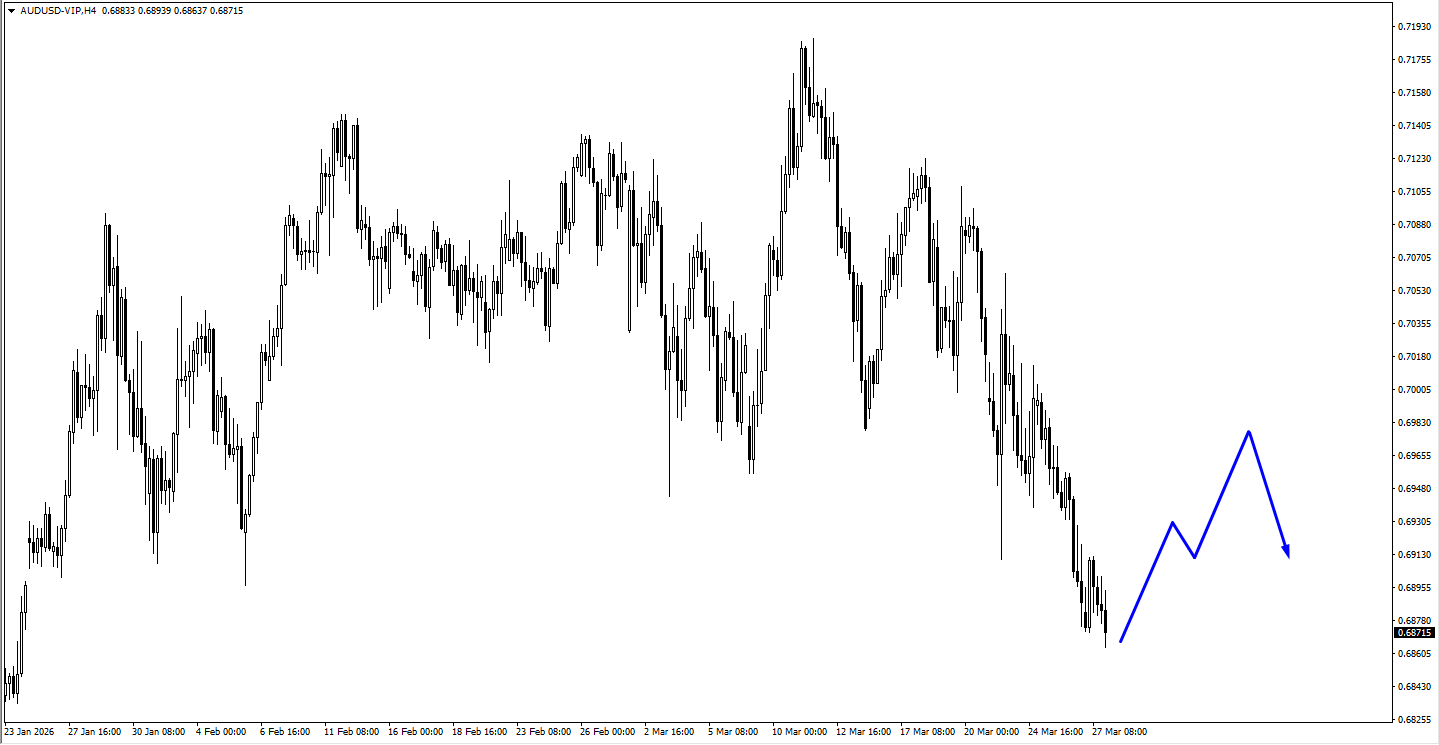
The yen is back near the level that keeps Tokyo on alert. USDJPY is trading at 159.623, close to the 160 area that previously triggered intervention fears, while the pair remains well above the January low at 152.095 shown on the chart.

The move reflects a market that still prefers the dollar when energy prices are high and geopolitical risk remains live. Japan imports most of its energy, so a weak yen and firmer oil work in the same direction. They lift import costs, worsen the terms of trade, and keep pressure on households and corporate margins.

The pair is not exploding higher today, but it is sitting close enough to 160 to keep officials, macro funds, and short-term traders focused on the next headline. A cautious near-term view still favours elevated levels unless oil cools or the BOJ gives markets a firmer signal.

BOJ Uncertainty is Driving the Trade

The Bank of Japan remains the main domestic variable. The market expects a meaningful chance of a rate increase at the next meeting, yet uncertainty over guidance is keeping the yen exposed. The BOJ left rates at 0.75% in March while maintaining a tightening bias, and pricing around the next step has stayed live into April.

That leaves USDJPY in an unstable balance. Expected tightening gives the yen some support underneath. A vague hold, or even a cautious hike without strong forward guidance, could still disappoint traders who want a clearer policy path.

Governor Kazuo Ueda has also signalled that exchange-rate moves now feed into inflation more directly than before, because companies are more willing to pass on higher costs.

Oil Keeps Tilting the Balance Against the Yen

Oil is still shaping the currency story. Higher crude prices have increased inflation pressure in Japan while also darkening the growth outlook. That weakens the yen’s usual defensive appeal. In a standard risk-off move, the yen often benefits from haven demand.

In this environment, high oil prices dilute that effect because the same shock is also increasing Japan’s import bill.

That explains why USDJPY can stay elevated even while broader markets worry about conflict. The dollar still has the cleaner relative-growth and energy-security story. A cautious forecast still favours upside pressure in USDJPY if oil stays high and the BOJ remains hesitant.

Tokyo is Raising the Volume on Intervention Warnings

Japanese officials have become more explicit. Finance Minister Satsuki Katayama said speculative activity in both oil futures and currency markets had increased significantly and warned that the government was prepared to respond if disruptions persisted.

Officials have also started describing parts of the yen move as speculative, which is firmer language than Tokyo used at the start of the conflict.

The warning may not reverse the trend by itself, but it can slow momentum and trigger sharp pullbacks if traders become too aggressive above 160. The bar for direct intervention still looks higher than in earlier episodes because this move is tied less to a one-way carry trade and more to oil, geopolitics, and broad dollar demand.

Technical Analysis

USDJPY is trading near 159.62, holding just below recent highs as the pair continues to press against the upper end of its range. Price action reflects steady bullish pressure, with higher lows forming since the February bottom around 152.09, and the market now testing resistance near the 160.00–160.50 zone, where upside has recently stalled.

From a technical standpoint, the trend remains constructive. Price is trading above the key short-term moving averages, with the 5-day (159.28) and 10-day (159.30) tightly clustered around current levels, acting as immediate support.

The 20-day (159.07) is also trending higher, reinforcing the ongoing upward structure, although momentum appears to be slowing slightly as price consolidates near resistance.

Key levels to watch:

  • Support: 159.30 → 159.00 → 157.95
  • Resistance: 160.50 → 161.10 → 162.00

The pair is currently consolidating just below 160.50, a level that has capped recent upside attempts. A clean break above this resistance could open the path toward 161.10, with further upside potential if momentum builds.

On the downside, 159.30 is acting as immediate support. A break below this level could trigger a pullback toward 159.00, though any decline is likely to remain corrective while the broader structure holds above the 157.95 region.

Overall, USDJPY remains in a steady uptrend with controlled pullbacks, reflecting persistent demand for the dollar against the yen.

However, with price hovering near the 160 handle, traders should remain alert to potential volatility or intervention risks, as this zone continues to attract heightened attention.

What Traders Should Watch Next

The next move in USDJPY depends on three things lining up. First, whether oil stays elevated. Second, whether the BOJ signals conviction ahead of the April 27–28 meeting window. Third, whether Tokyo’s warnings remain verbal or turn into action.

If oil remains firm and the BOJ stays vague, the market may test 160.461 again. If the BOJ sharpens its guidance or officials escalate intervention language further, USDJPY may keep moving sideways rather than breaking cleanly higher.

Learn more about trading Forex Pairs on VT Markets here.

Trader Questions

Why is USDJPY Staying So Close to 160?

USDJPY is staying elevated because the market still favours the dollar when oil prices are firm, geopolitical risk is live, and the Bank of Japan has not yet given traders a fully convincing policy signal. Your chart shows USDJPY at 159.623, still close to the recent high at 160.461.

Why Does Higher Oil Weaken the Yen?

Japan imports most of its energy, so higher crude prices raise import costs, worsen the trade balance, and increase inflation pressure without improving domestic growth. That combination usually works against the yen when energy shocks persist.

What Are Markets Expecting From the BOJ Right Now?

Markets are pricing a meaningful chance of another BOJ move, with recent reporting putting the probability in roughly the 60% to 70% range for the next step around the April meeting window. That supports the yen underneath, but it also raises the risk of disappointment if the BOJ holds or gives cautious guidance.

Why Would a BOJ Hold Be Negative for the Yen?

A hold would matter because traders already expect a decent chance of a hike. If the BOJ stays at 0.75% and sounds vague again, the market may treat that as a softer outcome than current pricing assumes, which could push USDJPY back toward the highs.

Why Has Tokyo Started Talking More About Speculation?

Officials are trying to slow one-way positioning before it becomes disorderly. Finance Minister Satsuki Katayama said speculative activity has increased in both FX and crude markets and warned the government is prepared to respond if disruption continues.

Start trading now – Click here to create your real VT Markets account

USDCNH Slips as Hormuz Hopes Lift Yuan

Key Points

  • USDCNH trades at 6.88362, down 0.00544 (-0.08%), while the offshore yuan edges firmer around 6.88 per dollar.
  • China’s composite PMI fell to 51.5 in March from 55.4 in February 2026, with manufacturing at 50.8 versus 52.1 and services at 52.1 versus 56.7.
  • The yuan is set for a weekly gain after four straight weekly losses, helped by hopes that pressure on the Strait of Hormuz may ease.

The offshore yuan edged higher on Friday, with USDCNH at 6.88362, as traders trimmed some of the safe-haven demand that had pushed the dollar higher through the Middle East crisis. The immediate shift came from improving sentiment around the Strait of Hormuz. Iran and Oman may begin monitoring transit through the waterway, which gave markets a reason to ease back from the most defensive positions.

That does not mean the risk has gone away. The market is still treating the Strait as a live threat to energy flows. The move in the yuan reflects a softer dollar tone and a little more confidence that the worst-case supply shock may not deepen straight away.

A cautious path from here still depends on shipping. If the Strait stays open enough to reduce oil panic, USDCNH can keep drifting lower. If the route tightens again, the dollar may regain support quickly.

China’s PMI Data Limits the Upside

The yuan’s gains have run into a softer domestic growth signal. The figures you shared showed China’s composite PMI at 51.5 in March, down from 55.4 in February 2026. The slowdown was broad, with manufacturing at 50.8 versus 52.1 and services at 52.1 versus 56.7.

Weaker domestic demand and slower export momentum have added to the downturn of private-sector and industrial services.

That leaves the currency in a narrow balance. Better sentiment around Hormuz supports the yuan. Softer Chinese activity keeps that support from becoming a stronger trend.

External Diplomacy Is Doing Part Of The Work

The broader backdrop has become more multipolar. India and the Philippines are reportedly negotiating with Tehran on vessel safety, while China and Pakistan are pushing their own diplomatic framework. That matters for the yuan because Beijing is not only exposed to oil prices.

It also has a direct interest in keeping trade lanes functional and freight costs contained.

China is one of the largest importers of oil moving through Hormuz, but it is also better placed than many peers to absorb some disruption through diverse supply sources, large inventories, and state-directed controls.

That gives the yuan some resilience when markets calm, but it does not turn the currency into a clean winner. China can absorb stress better than some importers, yet it still pays a growth cost when energy and logistics stay expensive.

Technical Analysis

USDCNH is trading near 6.8836, holding within a tight consolidation range after a prolonged downtrend from the 7.07 highs.

Price action shows the pair attempting to stabilise following the sharp decline into the 6.82 low, with recent candles reflecting indecision rather than strong directional conviction. The market is now moving sideways, suggesting a pause in bearish momentum as traders assess the next macro driver.

From a technical standpoint, the broader structure still leans bearish. Price remains capped below the key moving averages, with the 5-day (6.8896) and 10-day (6.8956) acting as immediate resistance, while the 20-day (6.8910) continues to flatten, signalling a loss of trend strength but not yet a reversal.

The inability to reclaim and hold above these levels keeps downside pressure intact, even as short-term momentum stabilises.

Key levels to watch:

  • Support: 6.8800 → 6.8260 → 6.8000
  • Resistance: 6.8950 → 6.9200 → 6.9500

In the near term, price is compressing around the 6.88–6.89 zone, with neither buyers nor sellers fully in control. A break below 6.8800 would likely reopen the move toward the 6.82 lows, while a sustained push above 6.8950 could trigger a short-term recovery toward 6.92.

Overall, USDCNH remains in a soft downtrend, but the current consolidation suggests momentum is fading. Traders should watch for a breakout from this narrow range, as it will likely dictate the next directional move.

What Traders Should Watch Next

The next move in USDCNH depends on whether Hormuz relief turns into actual flow stability and whether China’s softer March private PMI becomes a one-month pause or the start of a broader slowdown.

The latest China PMI reporting already showed weaker domestic demand and slower export orders in services, while manufacturing faced sharper input costs and longer delivery times.

A cautious forecast suggests that the exchange rate will remain within a narrow range around current levels. A significant decrease in USDCNH is likely to depend on a combination of calmer oil prices, stronger economic data from China, and a weaker dollar. However, any new disruptions in shipping could quickly push the pair back under upward pressure.

Learn more about trading Forex Pairs on VT Markets here.

Trader Questions

Why is USDCNH falling toward 6.88?

USDCNH eased because sentiment improved around the Strait of Hormuz and traders pulled back some defensive dollar positions. Reuters reported that hopes of monitored transit through the waterway helped support the yuan after four straight weekly losses.

What is supporting the offshore yuan right now?

The yuan is getting support from a softer dollar tone and from hopes that oil-shipping risks may ease. Reuters said the currency was heading for a weekly gain as markets reacted to signs that pressure around Hormuz could moderate.

Why has China’s PMI data limited yuan gains?

China’s March data showed slower momentum. The figures you provided showed the composite PMI at 51.5 versus 55.4 in February, with manufacturing at 50.8 versus 52.1 and services at 52.1 versus 56.7. Reuters also reported weaker private-sector demand and softer export momentum, which capped yuan upside.

Does a PMI above 50 still support the yuan?

Yes, but only partly. Readings above 50 still point to expansion, yet the slowdown from February means growth is losing speed. Currency markets usually reward improving momentum more than simple expansion.

Why does the Strait of Hormuz matter for USDCNH?

China imports a large amount of oil that moves through Hormuz. If the route stays disrupted, energy costs rise, freight costs stay high, and growth pressure builds. Reuters reported that China can absorb some of the shock through inventories and diversified supply, but it still faces a real economic cost.

What is the difference between the private PMI and China’s official PMI?

The private readings in your note softened sharply, while China’s official March data looked firmer. Reuters reported official manufacturing PMI at 50.4 and non-manufacturing PMI at 50.8, which suggests the economy is still expanding even though private surveys point to slower demand and rising cost pressure.

What does the USDCNH chart show right now?

The chart shows USDCNH at 6.88362, below the short-term moving averages at MA5 6.88960, MA10 6.89558, and MA20 6.89099. That keeps the short-term bias slightly softer for the dollar, though the move still looks like a cautious drift rather than a strong breakdown.

Start trading now – Click here to create your real VT Markets account

ORCL Stock: How Oracle Is Positioning Itself in the AI Boom

Key Points:

  • ORCL stock is increasingly being revalued through an AI lens, driven by the growth of its cloud infrastructure business and its positioning within enterprise data environments.
  • Oracle is emerging as an AI infrastructure enabler, not just a legacy software provider.
  • Its cloud platform is benefiting from rising enterprise demand for AI workloads.
  • ORCL offers lower-volatility exposure to the AI theme compared to high-momentum names.

Oracle has long been associated with databases and enterprise software, but that identity is evolving. As artificial intelligence (AI) reshapes how companies operate, the market is beginning to reassess where ORCL fits within this new landscape.

The AI boom is not just about models or chips. It is about the infrastructure that allows those systems to run at scale. This includes compute, storage, and data environments—areas where Oracle is becoming increasingly relevant.

  • AI adoption is driving demand beyond just software.
  • Infrastructure providers are gaining importance alongside chipmakers.
  • Enterprise data is becoming central to how AI is deployed.

This shift is what is quietly bringing ORCL stock back into focus.

From Legacy Software to Cloud Infrastructure

Oracle’s transformation begins with its move away from traditional licensing and toward cloud-based services. Historically, the company generated most of its revenue from database licences and enterprise software contracts. These provided stability, but limited growth.

The pivot to Oracle Cloud Infrastructure (OCI) changes that trajectory.

OCI is designed to support modern workloads, particularly those tied to AI and large-scale data processing. These workloads are far more demanding than traditional enterprise applications, requiring both scale and performance.

  • AI workloads require high compute density and fast data access.
  • Enterprises need secure, scalable environments to run models.
  • Cloud infrastructure turns usage into recurring, scalable revenue.

Oracle has responded by expanding its data centre footprint and investing heavily in performance optimisation. As a result, cloud revenue has become one of the fastest-growing parts of the business, often delivering double-digit growth.

This is not just a business shift. It is a valuation shift. The more Oracle looks like a cloud infrastructure provider, the more it gets compared to growth-driven tech names rather than legacy software firms.

Oracle’s Role in the AI Stack

The AI ecosystem is layered, even if the market often simplifies it.

At a high level, it can be broken into three parts:

  • Hardware layer: Led by companies like NVIDIA, supplying the chips that power AI systems
  • Infrastructure layer: Where Oracle operates, hosting and scaling AI workloads
  • Application layer: Companies like Microsoft are integrating AI into their products

Oracle’s positioning sits in that middle layer, and that is where its advantage lies.

Many enterprises already store critical data in Oracle systems. As AI adoption grows, companies want to run models on that data without migrating everything elsewhere.

  • Data already lives within Oracle environments
  • AI workloads tend to follow where data is stored
  • Infrastructure demand increases as usage scales

This creates a natural pathway for Oracle to capture AI-related demand without needing to dominate the entire cloud market.

How ORCL Compares to Other AI Stocks

Oracle is part of the AI trade, but it behaves differently from the names that typically dominate headlines.

A company like NVIDIA offers direct exposure to chip demand. Its growth is closely tied to how quickly AI infrastructure is being built out, which makes it highly sensitive to expectations and sentiment.

Meanwhile, Microsoft and Amazon combine infrastructure with platform and application layers, giving them broader exposure across the AI value chain.

Oracle may not lead the AI headlines, but it sits within the same infrastructure cycle driving the broader tech rally. Track AI-linked equities, cloud providers, and semiconductor names through CFD Shares on the VT Markets app.

Oracle sits in a narrower but still important position.

  • More enterprise-focused than consumer-facing.
  • More infrastructure-driven than application-led.
  • Less dependent on short-term AI hype cycles.

This gives ORCL a different trading profile. It tends to move with the broader AI theme, but with less extreme volatility.

For traders, that creates a second-order opportunity. ORCL may not lead rallies, but it can benefit from the same structural drivers.

Oracle’s Position in Geopolitics and Sovereign AI

One of the more underappreciated aspects of Oracle’s positioning in the AI race is its deep and long-standing relationship with governments and defence institutions.

While much of the market focuses on commercial AI adoption, a growing share of demand is coming from what is often referred to as sovereign AI. Sovereign AIs are systems developed and deployed at a national level for security, intelligence, and infrastructure resilience.

Oracle is already embedded in this space.

The company has long been a cloud and database provider to the US government and continues to expand its footprint across defence and public-sector contracts. More recently, Oracle has been rolling out dedicated cloud regions and AI-capable infrastructure designed specifically for government and military use.

This includes deployments and partnerships across:

  • The US Department of Defence (DoD).
  • Branches such as the US Air Force and the US Army.
  • Allied defence institutions, including the UK Royal Navy.
  • International government partners, such as Singapore’s defence sector.

These contracts are not just incremental revenue streams. They represent high-trust, long-duration agreements that often involve mission-critical systems. That creates a different type of demand profile compared to commercial cloud usage.

From a market perspective, this matters for two reasons.

First, government and defence contracts tend to be:

  • Longer-term.
  • Less sensitive to economic cycles.
  • Tied to national budgets rather than corporate spending.

Second, sovereign AI is becoming a strategic priority. Countries are increasingly looking to build:

  • Domestic AI capabilities
  • Secure data environments
  • Independent cloud infrastructure

Larry Ellison has been particularly vocal about this shift. He emphasised that AI will require not just software innovation, but secure, large-scale infrastructure capable of handling sensitive data.

This focus on security and sovereign capability sets Oracle apart from some of its competitors, particularly in highly regulated or defence-related use cases.

Unlike newcomers in the AI boom, Oracle has years of state-backed demand. In the commercial AI space, traders will likely see more stable, persistent growth from the company over time.

  • Sovereign AI demand is structural, not cyclical.
  • Defence contracts provide revenue visibility and durability.
  • Government adoption reinforces Oracle’s role in high-trust infrastructure environments.

As geopolitical tensions rise and countries prioritise technological independence, this segment of the market is likely to become increasingly important.

ORCL is just one piece of a much wider AI and cloud ecosystem. Build a broader watchlist of related tech stocks and trade them through CFD Shares on the VT Markets app.

What Oracle’s Earnings Are Really Showing

Oracle’s earnings are increasingly reflecting structural demand rather than cyclical growth.

The key is not just revenue, but where that revenue comes from. In recent quarters, Oracle has reported total revenue growth in the high single digits to low double digits, but the composition of that growth tells a much clearer story. Cloud infrastructure, particularly OCI, has been expanding at a much faster pace than the rest of the business.

  • OCI growth is leading overall performance. Oracle Cloud Infrastructure has been growing at roughly 30%–50% year-on-year, significantly outpacing total company revenue. This highlights how demand for AI-related compute and enterprise cloud workloads is driving the top line.
  • Legacy segments are becoming less dominant. Traditional licensing and on-premise software have grown at a much slower pace, often in the low single digits, meaning their contribution to overall growth is steadily declining.
  • Recurring revenue is increasing visibility. Cloud services and support now account for over 70% of Oracle’s total revenue, giving the company a more predictable and scalable earnings profile compared to its historical model.

At the same time, capital expenditure is rising sharply as Oracle builds out the infrastructure needed to support AI demand.

  • Higher capex signals confidence in long-term demand: Oracle has significantly increased investment into data centres and cloud capacity, with capital expenditure rising into the multi-billion dollar range annually, reflecting strong forward demand for AI workloads.
  • It can also create short-term margin pressure: Despite strong revenue growth, operating margins have faced pressure at times due to higher infrastructure costs, as the company invests ahead of demand.

For traders, this is where interpretation matters. Strong investment is typically viewed as bullish when it is backed by sustained demand, but the market will closely watch whether that capex translates into continued OCI growth and long-term revenue expansion.

The Hidden Driver: Data and Enterprise Lock-In

One of Oracle’s strongest advantages is not always obvious in headlines. It is the concept of data gravity.

Large organisations store critical data within Oracle systems. Moving that data is difficult, expensive, and risky. This creates a form of embedded positioning.

As AI adoption increases, companies need to run models on that data. This creates a natural dynamic:

  • Data remains within existing Oracle systems.
  • AI workloads are built on top of that data.
  • Infrastructure demand grows within the same ecosystem.

This is not driven by hype. It is driven by operational efficiency. And over time, that can be more durable than sentiment-driven narratives.

What Traders Should Watch

For traders, ORCL is less about headlines and more about confirmation of trends.

The first signal is cloud growth. Sustained strength in OCI indicates that AI infrastructure demand is translating into real revenue.

The second is capital allocation. Investment into data centres and infrastructure needs to be matched by long-term usage and contracts.

Beyond that, several indicators can help frame the trade:

  • OCI growth consistency: Confirms whether AI demand is sustaining.
  • Enterprise deal flow: Signals real adoption rather than narrative.
  • Capex vs revenue balance: Shows whether investment is being monetised.
  • Relative performance vs AI leaders: Helps identify rotation or lag effects.

ORCL often follows the broader AI trade, even if it does not lead it.

How ORCL Fits Into a Broader Trading Strategy

ORCL is rarely the headline trade, but that is part of its value.

It offers exposure to the AI theme without relying entirely on high-momentum sentiment. For traders, this can make it a useful complement within a broader portfolio.

  • Can balance higher-volatility AI names
  • Offers exposure to enterprise AI adoption
  • Provides a way to track infrastructure demand trends

It also creates natural links to other tradable assets. Traders watching ORCL often track related names across semiconductors, cloud, and tech indices, building a broader view of how the AI cycle is evolving.

Bottom Line

Oracle is not the loudest name in the AI boom, but it is becoming one of the more important supporting players.

Its role in infrastructure, data, and enterprise systems places it in a position to benefit from long-term AI adoption. For traders, ORCL offers a way to participate in that trend without relying entirely on short-term hype cycles.

Create a live VT Markets account today to access our platform features, including market insights and educational content.

Article Recap

What is ORCL stock?

ORCL stock represents shares of Oracle Corporation, a technology company focused on cloud infrastructure, enterprise software, and database systems.

Is Oracle an AI stock?

Oracle is increasingly viewed as an AI-related stock because its cloud infrastructure supports enterprise AI workloads.

Why is ORCL stock gaining attention?

Growth in Oracle Cloud Infrastructure and rising demand for AI computing are driving renewed interest.

How does Oracle compare to Nvidia or Microsoft?

Oracle focuses on infrastructure and enterprise systems, while Nvidia leads in hardware and Microsoft in software integration.

Is ORCL a high-growth AI stock?

It offers AI exposure, but with a more moderate and stable growth profile compared to leading AI stocks.

Start trading now – Click here to create your real VT Markets account

Dividend Adjustment Notice – Apr 02 ,2026

Dear Client,

Please note that the dividends of the following products will be adjusted accordingly. Index dividends will be executed separately through a balance statement directly to your trading account, and the comment will be in the following format “Div & Product Name & Net Volume”.

Please refer to the table below for more details:

Dividend Adjustment Notice

The above data is for reference only, please refer to the MT4/MT5 software for specific data.

If you’d like more information, please don’t hesitate to contact info@vtmarkets.com.

Oil Above $106 Tests Trump’s Energy Confidence

Key Points

  • WTI trades at 106.402, up 7.579 or 7.67%, after printing a session high of 106.707.
  • Trump said the US has enough gas and oil to handle the shock, but Moody’s says higher prices will still hit growth and inflation.
  • Supply disruption is still driving the market. Brent above $107 after Trump’s Iran speech and said US clean fuel exports rose to a record 3.11 million bpd in March.

Oil is trading like a supply shock is still in force. WTI sits at 106.402, up 7.67%, and the chart shows buyers stepping back in after the latest pullback. The market is not questioning whether the US can produce oil. It is pricing the cost of a global disruption that keeps freight, fuel, and input prices high even when domestic supply is available.

That is why Trump’s claim that the US has plenty of gas and oil has not settled the market. The US is better positioned than major energy importers, but oil is priced globally.

When shipping lanes are impaired and replacement flows stretch across longer routes, businesses and consumers still pay more.

Domestic Supply Does Not Cancel Global Price Pressure

US fuel exports hit a record in March as Europe and Asia rushed to replace the disrupted Middle East supply. Clean petroleum product exports rose to 3.11 million barrels per day, up from 2.5 million bpd in February. Europe took 414,000 bpd, Asia took 224,000 bpd, and Africa took 148,000 bpd.

That supports one part of Trump’s argument. The US does have barrels to sell. It also shows why Moody’s pushback carries weight. Export strength helps global buyers, but it also tightens the domestic balance and keeps prices elevated. US fuel exports became politically sensitive as gasoline moved above $4 per gallon and diesel approached $5.50.

The immediate issue is cost, not scarcity. Businesses do not need to run out of fuel for growth to slow. They only need to pay enough more for fuel, freight, chemicals, and transport to cut margins and delay spending.

Inflation Pressure and Slower Growth Can Arrive Together

That is the hard part of this setup. Higher oil pushes inflation up while also dragging on activity. Moody’s Analytics argued that the US is not exposed in the same way as countries that cannot produce oil domestically, but it still cannot avoid the economic damage from disrupted supply chains and higher costs. That is the exact mix that revives stagflation fears.

Brent rose above $107, stocks fell, and the dollar strengthened as investors priced a longer disruption and a tougher inflation path.

That backdrop explains why oil above $106 carries more weight than the reassuring line that the US has enough supply. Domestic output can cushion the blow. It cannot erase the inflation premium while the wider system is still under stress.

Technical Analysis

CL-OIL is trading near 106.40, extending its aggressive upside move after a strong breakout from the consolidation phase around the mid-$90s. Price has surged sharply from the late-February base, with momentum accelerating into the recent spike toward 119.43, before entering a period of controlled consolidation just below current highs.

The latest price action shows buyers stepping back in, with the market attempting to push higher again after holding firm above key short-term levels.

From a technical standpoint, the trend remains firmly bullish. Price is trading well above all major moving averages, with the 5-day (102.55) leading higher and the 10-day (97.29) and 20-day (94.96) trailing beneath, all sloping upward. This alignment reflects strong trend continuation, while the recent consolidation above the $100 handle suggests the market is building a base for a potential next leg higher rather than showing signs of reversal.

Key levels to watch:

  • Support: 102.50 → 100.00 → 97.30
  • Resistance: 106.70 → 110.00 → 119.40

The immediate focus is on the 106.50–107.00 zone, which aligns with recent highs. A sustained break above this area could open the path toward 110.00, with further upside potential if momentum builds.

On the downside, 102.50 acts as first support, reinforced by the rising 5-day average. A break below this level would likely trigger a deeper pullback toward 100.00, though such a move would still be considered corrective within the broader uptrend.

Overall, oil remains in a strong uptrend with higher highs and higher lows intact. The current consolidation appears constructive, and unless price slips back below the $100 region, the bias remains tilted to the upside as the market continues to price in supply-side risks and sustained demand.

What Traders Should Watch Next

The next move depends on whether the market sees more real relief in fuel flows or just more confidence talk. Physical trade is adjusting through record US exports and rerouted supply, but prices remain high because the system is still strained.

Watch Brent’s reaction above $107, watch whether US product exports stay near the March record, and watch how quickly fuel costs feed into broader inflation measures. If transport and energy prices keep rising, oil can stay high even without another headline shock.

Learn more about trading Energies on VT Markets here.

Trader Questions

Why Are Oil Prices Still Rising Even Though The US Has Plenty Of Supply?

US supply helps cushion the shock, but oil is priced in a global market. When shipping routes are disrupted and freight costs rise, domestic production does not stop higher global prices from feeding into US fuel and input costs.

What Did Trump Say About The Energy Situation?

Trump said the US has plenty of gas and oil, along with supply from Venezuela, and argued the economy is well prepared to handle the current disruption.

Why Do Analysts Still See Risks For The US Economy?

Higher oil prices still raise transport, logistics, and operating costs for businesses and consumers. That can slow growth even if the US does not face an outright fuel shortage.

How Do Higher Oil Prices Affect Inflation?

Oil feeds into petrol, diesel, shipping, aviation, and manufacturing costs. When those costs rise, broader inflation tends to follow, especially if the move lasts more than a few weeks.

Why Can Growth Slow Even If The US Produces Its Own Oil?

Domestic production reduces vulnerability, but it does not shield the economy from globally higher prices. Companies still pay more for fuel and supply chains still get more expensive.

Start trading now – Click here to create your real VT Markets account

Trump’s Iran Speech Leaves Markets With More Questions

Trump’s Iran Speech Leaves Markets With More Questions

On the evening of 1 April 2026, President Donald Trump addressed the nation from the White House Cross Hall in what was billed as an “important update” on the war in Iran. It was his first formal primetime address since Operation Epic Fury began on 28 February and markets were watching closely for signs of clarity.

Instead, the 20-minute speech left investors with more uncertainty. Trump praised battlefield progress, extended the war’s timeline, threatened to bomb Iran’s power grid, and left the Strait of Hormuz question wide open. Oil jumped nearly 4% within minutes of him leaving the podium.

Key takeaways

  • Trump’s 1st April speech was his first formal address since Operation Epic Fury began on 28 February
  • Trump signalled that the US would strike Iran “extremely hard” over the next two to three weeks, lifting Brent crude above $104 and reversing the market’s pre-speech optimism
  • The Strait of Hormuz remains severely disrupted, placing at risk a corridor that carries roughly one-fifth of global oil supply, with no clear US plan to restore normal shipping conditions
  • Bank of America economists expect oil to remain near $100 per barrel through the rest of 2026, alongside slower growth and firmer inflation

The War at a Glance: Five Weeks In

The US–Israeli military campaign against Iran has now entered its fifth week. What began as a targeted strike operation focused on Iran’s missile programme, destroying its navy, and eliminating its path to a nuclear weapon has evolved into a broad regional conflict with significant humanitarian, economic, and diplomatic fallout.

The fallout is no longer limited to Iran itself. Attacks on vessels and the growing security risk in the Strait of Hormuz have severely disrupted commercial traffic through one of the world’s most important energy chokepoints. Israeli strikes have extended to Beirut, while Yemen’s Houthi rebels have launched missile attacks on Israel and threatened further escalation. The reported kidnapping of a US journalist in Baghdad has added to concerns that the conflict is spreading well beyond its original theatre.

Why Trump Speech Mattered to Markets

For the past five weeks, traders and analysts have been trying to make sense of a steady stream of conflicting signals from Washington. Treasury Secretary Scott Bessent said the US would “retake control of the straits.” Trump, by contrast, suggested other nations may need to “fend for themselves.” 

He also claimed that Iran’s president had requested a ceasefire, a statement Iran dismissed as “false and baseless.” At other points, Trump threatened to strike Iran’s oil infrastructure, before later saying the US was “not going to have anything to do with” what happens in the strait.

Markets had rallied strongly in the two days before the speech on growing optimism the war might end soon. That rally unwound fast once Trump’s speech content became clear.

As the first formal primetime presidential address of the conflict, the speech carried more weight than a passing remark to reporters. It signalled a deliberate effort to project control and shape both public perception and market expectations.

What Trump Was Trying to Achieve Politically

Polling consistently shows American patience wearing thin. The war has pushed average US petrol prices above $4 per gallon. Bank of America economists forecast slower growth, higher inflation, and oil at $100 per barrel through the rest of 2026. Trump enters midterm-election territory with an increasingly unpopular war on his hands.

The speech’s political architecture was clear:

  • Restate the four objectives of Operation Epic Fury as achieved or near-achieved — destroying Iran’s missiles, navy, terror-proxy network, and nuclear capability
  • Compare the conflict’s brevity favourably to past US wars (WW1, WW2, Korea, Vietnam, Iraq)
  • Reassure the public the war is “nearing completion” and will end “very shortly”
  • Project strength by threatening to hit Iran’s electricity grid and oil infrastructure if no deal is struck within two to three weeks

White House officials later said they were pleased with the address. But the reaction was far from uniform. Former Representative Marjorie Taylor Greene offered a much harsher verdict, saying the speech was all about war and did nothing to address the rising cost of living.

The Mixed Signal Problem — and Why It’s the Real Risk

The central challenge for markets is that the White House has been sending contradictory signals almost daily.

The speech was supposed to bring clarity. Instead, it added another layer of uncertainty. That leaves markets trying to price not one clear outcome, but several competing ones.

Three near-term scenarios now matter most:

ScenarioTriggerMarket implicationProbability signal
Near-term ceasefire or dealIran reopens Hormuz; back-channel talks succeedOil sharp selloff; risk-on rally; gold retreatsLow — Iran denies requesting ceasefire
Continued military action (2–3 weeks)No deal; US hits power grid and oil targets as threatenedOil above $110; inflation expectations rise; equities slideHigh — explicitly telegraphed in speech
Escalation beyond IranHouthi or Hezbollah escalation; China–Pakistan dynamics; NATO fractureSafe-haven surge; gold, yen, USD bid; broad risk-offRising — conflict has already spread to Beirut and Kuwait

Trump‘s statement that other countries must “fend for themselves” on the Strait of Hormuz is particularly significant. It suggests the US could step back while the Strait of Hormuz remains disrupted. For markets, that would still be a problem because even if US involvement eases, the supply risk would not go away.

How the War Is Already Affecting Fuel, Trade, and Sentiment

Energy

Brent crude reached $104.44 per barrel on 1 April, rising more than 3% on the day of the speech. US crude traded at $102.36. Countries in Asia that rely heavily on Middle Eastern oil could face fuel pressure in the weeks ahead, with Europe also exposed if disruption continues. The supply risk has already become more visible, with reports of a Kuwaiti oil tanker being hit by Iranian drones near Dubai and a QatarEnergy-chartered tanker struck by a missile off Qatar.

Trade and shipping

The Strait of Hormuz disruption represents the largest oil supply shock in recorded history. Container rerouting, insurance surcharges, and supply chain delays are cascading into fertiliser, aluminium, and consumer goods pricing. The UK announced a 35-nation diplomatic conference to address maritime security, but any lasting solution will still depend on how the conflict develops.

Sentiment

Equity markets had rallied in the two days before the speech on hopes that a ceasefire might be close. That mood reversed once Trump confirmed that military action could continue for another two to three weeks. Crude futures jumped more than 5% in after-hours trading, while US stock futures moved lower. A speech that was meant to reassure instead reinforced the market’s view that disruption may last longer than expected.

For traders tracking how war headlines move safe-haven assets, the dynamics at play here echo patterns we’ve covered previously — see why gold and the dollar react to Trump headlines and how US equities have been tracking Iran escalation fears.

Will Speech Calm Doubts or Deepen Them?

The honest answer: it has deepened them, at least in the short term. A formal national address naturally raised expectations of clarity. Instead, Trump largely restated positions the market had already heard: progress was claimed, threats were renewed, the timeline was repeated, and the conditions for an exit remained unclear.

Senator Mark Warner said the address “did little to answer the most basic questions the American people deserve when our nation is engaged in a costly and dangerous conflict.” For markets, the central question is not simply whether the war will end, but when it will end and under what conditions the Strait of Hormuz will reopen. On that point, the speech offered little clarity.

Oil prices jumped almost 4 percent as traders no doubt saw the president’s speech as a sign that the war will not end quickly.” — The Washington Post, 1 April 2026

The next two to three weeks will be decisive. Markets will be watching for any move against Iran’s electricity infrastructure, the diplomatic track being led by UK Foreign Secretary Yvette Cooper, and any signal that Hormuz traffic is resuming. Until then, volatility is likely to remain the clearest message for investors.

Refresher

1. How did markets react to Trump’s Iran speech?

Markets reacted negatively, with oil prices rising and equities coming under pressure. Investors shifted to a risk-off sentiment due to heightened geopolitical uncertainty and lack of clarity in the speech.

2. Why did oil prices surge after the speech?

Oil prices climbed because traders feared prolonged conflict and potential disruptions to global supply, especially around the Strait of Hormuz. This key shipping route is critical for global energy flows.

3. What made investors uncertain after Trump’s address?

The speech delivered mixed signals—suggesting progress in the war but also indicating continued military action without a clear timeline. This ambiguity left investors unsure about the duration and risks of the conflict.

4. How did the speech impact currency and safe-haven assets?

The US dollar strengthened as investors sought safety, while other risk-sensitive assets faced pressure. In broader market trends, geopolitical tensions typically support safe-haven flows and increase volatility.

5. What role does the Strait of Hormuz play in market reactions?

The Strait of Hormuz is a crucial global oil transit chokepoint. Any threat to its operations raises concerns about supply shortages, which directly impacts oil prices and global inflation expectations.

6. What should traders watch following the speech?

Traders should monitor geopolitical developments, especially any escalation or de-escalation signals, oil price movements, and central bank responses to rising inflation risks. Market volatility is likely to persist until clearer direction emerges.

Start trading now – Click here to create your real VT Markets account

S&P 500 Slides as Stagflation Risk Revives

Key Points

  • S&P 500 futures fell 1%, while the cash index in your chart trades at 6517.28, down 65.71 (-1.00%).
  • Brent rose about 5% to $106.16 a barrel after Trump gave no clear signal on when the Strait of Hormuz might reopen.
  • The US dollar index rose 0.3% to 99.858, while the euro slipped 0.25% to $1.156 as traders moved back into defensive positions.

Markets went back into defence after President Donald Trump said the US would hit Iran “extremely hard” within weeks and did not give traders the timeline they wanted for an end to the conflict.

That shift matters for the S&P 500 because the rebound over the prior two sessions had relied on hopes that the war might wind down soon. Trump’s comments removed that support.

Traders started selling equities again because the market is still trying to price two things at once: higher energy costs and weaker growth. That combination is what keeps dragging the discussion back toward stagflation.

The market is no longer asking whether the conflict is serious. It is asking how long the energy disruption lasts and how much economic damage builds while it stays in place.

Oil Above $106 Reopens the Inflation Problem

The sharpest signal came from crude. Reuters reported that the front-month Brent contract rose about 5% to $106.16 per barrel after the speech failed to offer reassurance on the Strait of Hormuz. Our research desk believes the only thing that really matters is whether the Strait reopens soon, and Trump’s remarks did not suggest that would happen quickly.

For equities, that is the problem in one line. Expensive oil lifts inflation, squeezes margins, and cuts into consumer spending power. The S&P 500 can absorb a geopolitical shock for a while if energy stays contained. It struggles much more when crude moves back toward crisis levels and the market cannot see a clear reopening path for a major fuel artery.

That also explains why the earlier optimism faded so fast. A war can continue politically and still leave markets calm if oil routes function. Once supply routes stay impaired, the macro cost rises quickly.

Dollar Strength Tightens Conditions Again

The dollar also turned higher as traders moved back into the usual haven trade. Reuters reported that the dollar index rose 0.3% to 99.858 after falling nearly 1% over the prior two days on ceasefire optimism. The euro weakened 0.25% to $1.156.

That adds another layer of pressure to the S&P 500. A firmer dollar tightens financial conditions and weighs on multinational earnings when overseas revenue is translated back into dollars. It also signals that traders are reducing risk rather than preparing to re-enter cyclicals and growth names.

When equities are already under pressure from higher yields and higher energy costs, a stronger dollar usually makes the rebound harder.

Technical Analysis

S&P 500 is trading near 6517, attempting a modest rebound after a sharp decline that pushed price down to the 6318 low. The broader structure remains under pressure following the rejection from the 7017 high, with price still struggling to regain upward momentum. Recent candles show a short-term bounce, but the recovery lacks strength, suggesting the move is more corrective than a true reversal.

From a technical standpoint, the trend remains bearish in the near term. Price is trading below the 10-day (6516) and 20-day (6610) moving averages, which are both sloping downward and acting as overhead resistance. The 5-day (6467) is beginning to turn higher, reflecting the current bounce, but this remains fragile unless price can reclaim higher levels. The broader structure continues to show lower highs and sustained selling pressure.

Key levels to watch:

  • Support: 6400 → 6318 → 6200
  • Resistance: 6520 → 6610 → 6700

The index is currently testing the 6515–6520 zone, which aligns closely with the 10-day average and is acting as immediate resistance. A sustained move above this level could open a recovery toward 6610, though stronger resistance is likely to emerge there.

On the downside, 6400 remains the first key support. A break below this level would expose the recent low at 6318, with further downside risk if selling resumes.

Overall, the S&P 500 remains in a short-term downtrend, with the current bounce showing limited conviction. Unless price can reclaim the 6610 area, rallies are likely to face resistance, keeping the bias tilted to the downside while the market works through this corrective phase.

What Traders Should Watch Next

The next move depends on oil, not speeches alone. Brent holding near $106.16, the status of the Strait of Hormuz, and the dollar’s reaction will drive the tone into the next session more than any single earnings or sector story. Both USD and oil should move higher while risk is shed, and that remains the cleanest way to frame the market right now.

A cautious path from here is clear. If crude stays high and the dollar keeps firming, the S&P 500 may struggle to recover more than a short relief bounce.

If oil falls back and the market sees real progress on shipping routes, the index can start rebuilding from the 6517 area toward resistance near 6610.

Learn more about trading Indices on VT Markets today.

Trader Questions

Why Did the S&P 500 Drop Again After Two Better Sessions?

The market had been hoping for a clearer end to the Iran conflict, but Trump’s speech offered no firm timeline and repeated threats to hit Iran “extremely hard” within weeks. That pushed traders back into defence and sent S&P 500 futures down 1%.

Why Are Oil Prices So Important for the S&P 500 Right Now?

Higher oil prices push up inflation, raise business costs, and squeeze consumer spending. Reuters reported Brent up about 5% to $106.16 a barrel after the speech, which brought the inflation problem back to the centre of equity pricing.

What is Driving Stagflation Fears in Markets?

Traders are now dealing with a weaker growth outlook amid high energy-driven inflation. That is the classic stagflation setup, and Reuters said Trump’s comments revived those concerns after the market had briefly hoped the war might wind down.

Why Did the Dollar Strengthen While Stocks Fell?

Traders moved back into the US dollar because the speech raised the odds of a longer conflict and kept energy supply fears alive. Reuters reported the dollar index up 0.3% to 99.925, showing that traders were rotating back into havens.

How Does the Strait of Hormuz Affect Us Equities?

The Strait of Hormuz is one of the most important fuel shipping routes in the world. If it stays blocked or restricted, energy prices stay high for longer. Reuters said the speech gave no real reassurance about when or how the strait would reopen, leaving markets on edge.

Start trading now – Click here to create your real VT Markets account

Modifications on Leverage for Shares (33 > 20) – Apr 01 ,2026

Dear Client,

To provide a favorable trading environment to our clients, VT Markets will modify the trading setting of all Shares products. Please refer to the following details:

1. All US Shares products leverage will be adjusted to 20:1.

Modifications on US Shares

2. MT5 All Shares products dynamic leverage: New positions opened within 30 minutes before market closing and after market opening will start with a leverage of 5:1. After the mentioned period, the leverage will be resumed to original leverage and will not be adjusted back to 5:1.

Modifications on US Shares

The above data is for reference only, please refer to the MT4/MT5 software for specific data.

Friendly reminders:

1. All specifications for Shares CFD stay the same except leverage during the mentioned period.

2. The margin requirement of the trade may be affected by this adjustment. Please make sure the funds in your account are sufficient to hold the position before this adjustment.

If you’d like more information, please don’t hesitate to contact info@vtmarkets.com.

Week Ahead: The 2026 Waiting Game

Key Points

  • USOil near $100 to $150 keeps inflation risk live and limits room for the Fed.
  • USDX stays firm as Strait of Hormuz tension blocks cleaner risk recovery.
  • SP500 remains vulnerable while high oil prices squeeze growth expectations.
  • BTCUSD still behaves like risk, even as the CLARITY Act starts to reshape crypto.
  • JOLTS and Non-Farm Payrolls will test whether growth is slowing further.
  • XAUUSD faces a push and pull between safe haven demand and dollar strength.

The market is not waiting for data first. It is waiting for oil to blink.

The conflict remains the main source of market anxiety. A 15-point peace proposal has been floated through intermediaries in Pakistan, but Tehran says no talks have happened and rejects the plan.

Iran is demanding full sovereignty over the Strait of Hormuz and a halt to all US-Israeli operations before any dialogue begins. That stand-off is keeping USDX elevated, leaving the S&P 500 under pressure and preventing traders from committing to a clearer risk-on view.

The core macro tension is now easy to spot. Each time peace hopes fade, oil jumps. Once oil holds near $100 to $150, the market stops treating this as just a war story and starts pricing it as a global cost-of-living and stagflation problem.

The Stagflation Trade

The market is no longer treating this as a headline-driven war scare that will fade in a few sessions. It is starting to price the slower damage that comes when conflict keeps energy markets tight for too long.

That is the shift underneath the tape. Each time peace hopes wobble, oil pushes up again. Once crude sits in a $100 to $150 range, the issue gets bigger than geopolitics. It starts to feed into freight, production, food, and household costs. That is when traders stop asking whether there is a war premium in oil and start asking whether the global economy is being pushed into a stagflation problem.

That is also why the mood feels heavy even on quieter days. The market is not waiting for one dramatic escalation. It is watching a more grinding risk build in the background, where growth slows but inflation does not cool in the way central banks would want.

Read more about the movement of oil prices and how it affects the global economy here.

The Fed and Why Risk Cannot Relax

This is where the old market playbook starts to break down. In a normal slowdown, traders would look to central banks for support. In this environment, that support looks less certain because high energy prices can keep inflation alive even as activity softens.

That leaves policymakers in an awkward position. They may want to lean more supportive if growth weakens, but they cannot do that freely if oil is still feeding price pressure through the system. The result is a market that feels stuck between two problems at once. Growth looks more fragile, but inflation risk has not gone away.

That is why risk sentiment still struggles to settle. Traders are not just nervous about weaker data. They are nervous about weaker data arriving in a world where policy relief may come later and do less when it does arrive.

The CLARITY Act and a Market Still Trading Risk

At the same time, while the old world of stocks, bonds, and commodities is being pulled around by war and inflation fears, the crypto market is being forced into a more formal structure.

On March 20, 2026, Senators Tillis and Alsobrooks reached a compromise on the CLARITY Act around stablecoin yields. The key change is simple. Direct yield earned just by holding a stablecoin, in the style of a bank deposit, would be prohibited for non-bank entities. Yield tied to actual use, such as payments, transfers, or platform loyalty, would still be permitted.

In the short term, that can take some heat out of the market because passive yield had become part of the growth story for parts of crypto. In the longer term, though, it may end up making the space easier for larger institutions to engage with. The compromise draws a clearer line between what looks like a deposit substitute and what looks like usable financial infrastructure.

Read more about blockchain technology here.

That is why the reaction is mixed rather than cleanly negative or positive. Some parts of the market may lose momentum first. But the broader framework becomes easier to defend if the rules are firmer and the biggest objections from the traditional banking side start to fade.

Key Symbols to Watch

USDX | USOil | BTCUSD | SP500 | USDJPY

Upcoming Events Table

DateCurrencyEventForecastPreviousAnalyst Remarks
30 Mar 2026USDFed Chair SpeaksTone matters more than guidance while oil drives pricing
31 Mar 2026USDJOLTS Jobs Openings6.90M6.95MSofter labour demand could dent USDX after a strong run
03 Apr 2026USDNon Farm Employment Change56K-92KA weak rebound would deepen the growth scare
03 Apr 2026USDUnemployment Rate4.40%4.40%Any rise would add pressure to equities and risk FX

For a full view of upcoming economic events, check out VT Markets’ Economic Calendar.

Key Movements Of The Week

AUDUSD

  • AUDUSD has already broken 0.68965, which keeps the near-term structure tilted lower.
  • AUDUSD now needs to consolidate before another move down can develop cleanly.
  • AUDUSD remains exposed while USDX stays firm and the market leans defensive.

USDJPY

  • USDJPY broke above 159.89 and then cleared the 160.00 handle.
  • USDJPY is now trading in a follow-through zone, with 161.943 as the most recent high.
  • USDJPY can stay supported while the dollar holds up, though the pair is entering a more sensitive area.

BTCUSD

  • BTCUSD is sitting at a crucial area with 2 possibilities now in play.
  • BTCUSD could move higher first, but the rally needs to be impulsive and buying should be dialled down above 74,000.
  • BTCUSD risks another leg lower if it turns into consolidation, with 60,502 the deeper downside level.
  • BTCUSD still carries an overall downward bias unless price breaks higher with force.

SP500

  • SP500 has already turned lower as sellers regained control.
  • SP500 still looks vulnerable if the next move is another consolidation phase.
  • SP500 remains tied to oil, growth fears and whether the Fed stays trapped by inflation.

Will April Bring A Turning Point?

The next date hanging over the market is April 6. That marks the end of the current 10-day tactical pause on strikes against Iranian energy plants. The working assumption in the market is that April could bring a more decisive turning point, even if that still falls short of full peace.

There is also a harder military and economic logic behind that view. One-third of Iran’s missile stockpile is said to be destroyed, another third buried or damaged.

The presence of the 31st MEU, with 3,500 Marines aboard the USS Tripoli, adds to the sense that pressure could ramp up quickly if talks fail. At the same time, there is a very clear economic incentive in the background, which is the push to get Brent crude back below $80 a barrel.

That leaves the market in a familiar place for now. Traders can see the outline of a possible endgame, but they still do not know whether it brings de-escalation, a harder strike phase, or a slower proxy conflict that drags through the rest of 2026.

Create a live VT Markets account today to access our platform features, including market insights and educational content.

Trader FAQs

Why is Oil More Important Than Data Right Now?

Because oil is shaping inflation, growth and rate expectations at the same time. That makes it the market’s main transmission channel this week.

Why is Bitcoin Still Weak if Regulation is Improving?

Because the short-term macro backdrop is still tight. CLARITY Act progress may help later, but for now BTCUSD is still trading like risk.

What is the Main Market Risk This Week?

The main risk is that oil stays elevated while US data softens. That would deepen the stagflation trade and keep pressure on equities and risk assets.

Dividend Adjustment Notice – Apr 01 ,2026

Dear Client,

Please note that the dividends of the following products will be adjusted accordingly. Index dividends will be executed separately through a balance statement directly to your trading account, and the comment will be in the following format “Div & Product Name & Net Volume”.

Please refer to the table below for more details:

Dividend Adjustment Notice

The above data is for reference only, please refer to the MT4/MT5 software for specific data.

If you’d like more information, please don’t hesitate to contact info@vtmarkets.com.

Back To Top
server

Hello there 👋

How can I help you?

Chat with our team instantly

Live Chat

Start a live conversation through...

  • Telegram
    hold On hold
  • Coming Soon...

Hello there 👋

How can I help you?

telegram

Scan the QR code with your smartphone to start a chat with us, or click here.

Don’t have the Telegram App or Desktop installed? Use Web Telegram instead.

QR code