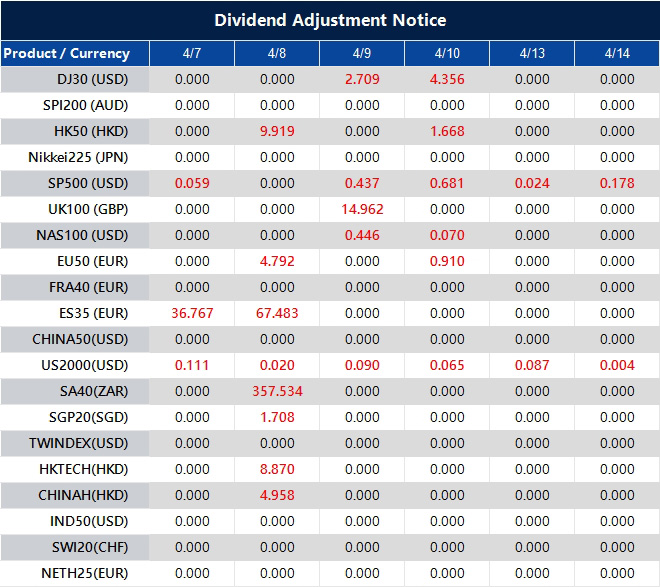
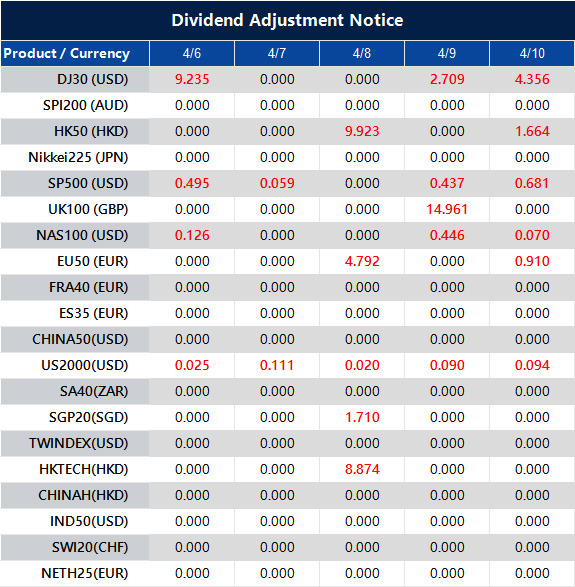
Please note that the dividends of the following products will be adjusted accordingly. Index dividends will be executed separately through a balance statement directly to your trading account, and the comment will be in the following format “Div & Product Name & Net Volume”.
Please refer to the table below for more details:
The above data is for reference only, please refer to the MT4/MT5 software for specific data.
If you’d like more information, please don’t hesitate to contact info@vtmarkets.com.
7 April 2026, Bangkok, Thailand– VT Markets, hosted its premier regional flagship event of the year, the “2026 APAC Gala: Future in Motion.” Held in the heart of Bangkok, the evening served as a prestigious celebration of the strategic partnerships and momentum driving the company’s success and continued expansion across Asia-Pacific.
VT Markets started 2026 with a record $1.5 trillion in January trading volume, and a 246% increase in active users compared to the same quarter last year. Driven by strategic regional support, Thailand’s trading volume tripled, Vietnam’s gross revenue surged 397%, and first-time trades in the Philippines skyrocketed 450% – signalling a decisive shift in regional market share. This follows its 10th anniversary year in 2025 where the firm secured over 30 industry awards, including ‘Best Global Multi-Asset Broker’ and ‘Most Reliable Trading Platform”.
The event also provided a moment of reflection following a meaningful community visit earlier to the Baan Nokkamin Foundation, where VT Markets and its partners delivered essential supplies to support local underprivileged youth and individuals to leave a lasting local impact that extended well beyond the financial markets.
“We titled this gala ‘Future in Motion’ because that is exactly where VT Markets is right now,” said Dandelyn Koh, Head of Global Marketing at VT Markets. “Our growth across APAC is explosive, but we never want to lose sight of our partners who fuel that engine. Whether we are donating essentials to the community or unveiling next-gen infrastructure, we are moving forward together, and this is just the beginning for us”.
The evening’s highlights included:
The Awards Excellence Ceremony: Dedicated to recognizing the partnerships and and performance that have made VT Markets a leader in APAC.
The Signature Lucky Draw: The night’s most anticipated segment featured a curated selection of luxury rewards. From flagship tech gadgets to bespoke travel experiences to Newcastle, United Kingdom, the prizes reflect the high-value partnerships VT Markets shares with its top-tier affiliates.
The 2026 Roadmap Reveal: An exclusive first look at the next generation of trading infrastructure where guests were given an exclusive preview of the products and features set to be rolled out progressively.
As VT Markets continues to scale its presence regionally, the 2026 APAC Gala reinforces its position as a forward-thinking broker that prioritises both technological advancement and the long-term success of its global partner community.
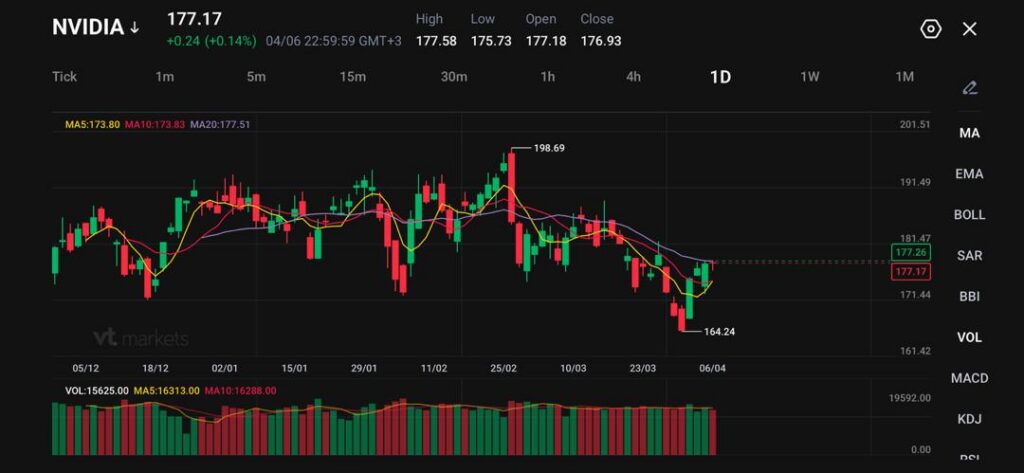
NVIDIA trades at 177.17, up 0.24 (+0.14%), while the wider market heads into earnings season with leadership still concentrated in technology and financials.
S&P 500 profits are forecast to rise 14.4% year on year to just under $609 billion, with Information Technology expected to grow more than 46% to $182.8 billion.
Financial sector earnings are expected to rise 18% to around $98.5 billion, helped by capital markets activity and trading volatility.
The earnings story going into first-quarter reporting still runs through the same two groups that carried much of the market before the war shock. S&P 500 profits are forecast to rise about 14.4% from a year earlier to just under $609 billion, and the largest contribution is still coming from technology.
Information Technology alone is expected to generate $182.8 billion in earnings, up more than 46% from last year and roughly 30% of the full S&P 500 total. When Communication Services is added, that share rises to 40%. Adding Consumer Discretionary pushes it to 47%.
That concentration matters for NVIDIA because it keeps the stock at the centre of the earnings trade even after months of consolidation. Traders were hoping the market would broaden enough to reduce its dependence on mega-cap technology. The forecast says that it has not happened yet. The market still needs tech to deliver.
NVIDIA Still Sits Inside the Main Profit Engine
NVIDIA remains one of the biggest symbols of that setup. The sector backdrop is still strong, and NVIDIA’s own operating momentum has remained well ahead of the index. The company reported quarterly revenue of $68.1 billion, up 73% year on year, while Data Centre revenue reached $62.3 billion, up 75%. Full-year revenue came in at $215.9 billion, up 65%.
For the current quarter, NVIDIA guided to about $78 billion, plus or minus 2%, above the analyst estimate of $72.6 billion at the time.
The issue is no longer whether NVIDIA can grow. The market is asking how much of that growth is already priced in, how durable margins remain, and whether management can keep justifying the scale of AI capex across the ecosystem. That is why commentary matters as much as the headline numbers.
Banks Are the Other Major Leg of the Trade
The other source of earnings support is financials. Sector profits are expected to rise 18% to about $98.5 billion, with deal flow, trading activity, and fundraising all supporting the numbers. Several large transactions and higher volatility in stock and bond markets have improved the near-term revenue backdrop for the big banks.
BlackRock has added to bearish positions on German bonds, betting that a “pretty large inflation uptick” across Europe will push borrowing costs back above the 15-year highs reached last week https://t.co/dAmtNqxKjY
That creates an important read-through for NVIDIA and the rest of the large-cap tech. If banks deliver solid numbers and management teams sound constructive, traders may become more willing to re-enter cyclical growth trades. If financials beat but warn on the broader economy, the market may keep rewarding earnings resilience while still limiting valuation expansion.
War Risk Has Not Broken the Earnings Base
The most constructive part of the setup is that forward earnings estimates have continued moving higher even while the market has pulled back. That combination is rare. It suggests analysts still see companies protecting margins and preserving operating leverage even with oil prices high and sentiment weaker.
Romania is set to leave European Union’s highest interest rates steady as the surge in oil prices will likely fuel inflation that’s already running at close to double digits https://t.co/V2z8P5N5Og
The market has already started to re-rate some of that risk. NVIDIA’s valuation multiple has compressed sharply. A recent market review showed NVIDIA’s price-to-earnings ratio had fallen to its lowest level in about seven years, even as analysts still expected NVIDIA’s current fiscal-year earnings growth to run above 70%, compared with about 19% for the S&P 500 overall.
That does not remove risk. It does mean the stock is no longer trading with the same stretched premium it carried at earlier peaks.
Technical Analysis
NVIDIA is trading near 177.17, attempting a modest rebound after the recent decline that saw price fall to the 164.24 low. Price action shows a short-term recovery forming, with buyers stepping in after the sell-off, but the broader structure still reflects weakness following the rejection from the 198.69 high.
The current move higher appears corrective, with price now testing a key near-term resistance zone.
From a technical standpoint, the trend remains neutral to slightly bearish. Price is hovering around the short-term moving averages, with the 5-day (173.80) providing immediate support, while the 10-day (173.83) and 20-day (177.51) are flattening and acting as overhead resistance. This compression suggests the market is in a transition phase, where momentum is stabilising but has yet to confirm a bullish reversal.
Key levels to watch:
Support: 173.80 → 171.40 → 164.20
Resistance: 177.50 → 181.50 → 190.00
The immediate focus is on the 177.50–178.00 zone, which aligns with the 20-day average and recent rejection levels. A sustained break above this area could extend the recovery toward 181.50, where stronger resistance is likely to emerge.
On the downside, 173.80 is acting as near-term support. A break below this level could see price revisit 171.40, with further weakness exposing the 164.20 low.
Overall, NVIDIA is attempting to stabilise after a corrective pullback, but the broader structure still lacks strong bullish confirmation.
Unless price can reclaim and hold above 177.50–181.50, the move higher is likely to remain corrective within a wider consolidation phase.
What Traders Should Watch Next
The next move depends less on whether tech can post strong numbers and more on what management says about the second half. Traders already know technology and banks are driving the first-half earnings story.
They want to hear whether AI demand is still broadening, whether margins can absorb the oil shock, and whether executives think war-related disruption remains temporary.
For NVIDIA specifically, the cleanest path higher needs two things together: steady AI demand and a market willing to reward that demand with a higher multiple again.
If earnings season confirms both, the stock can start pushing through the 177.5 zone and build toward the upper end of the recent range. If guidance turns more cautious, the recovery may stall even if the headline numbers still look strong.
Create a live VT Markets account today to access our platform features, including market insights and educational content.
Trader Questions
Why is Nvidia So Important to This Earnings Season?
Nvidia sits inside the part of the market driving the biggest share of profit growth. Technology is expected to generate $182.8 billion in earnings, up more than 46% from last year, which keeps Nvidia at the centre of the reporting season story.
Why Are Investors Still Focused on Tech and Banks?
Those two groups are carrying most of the earnings growth. S&P 500 profits are forecast to rise 14.4% to just under $609 billion, while financial earnings are expected to rise 18% to about $98.5 billion.
What Does This Mean for Nvidia Stock Specifically?
It means Nvidia still has to deliver more than strong numbers. Investors will also want clear guidance on AI demand, margins, capex durability, and how management sees the second half.
Why Does Guidance Matter More Than the Headline Beat?
The market already expects strong growth from mega-cap tech. The bigger question is whether that growth can stay strong if oil prices remain high, financial conditions stay tight, or corporate spending becomes more selective.
Is Nvidia Still Growing Fast Enough to Justify Attention?
Yes. The latest figures cited in the article showed quarterly revenue at $68.1 billion, up 73% year on year, with data centre revenue at $62.3 billion, up 75%. Full-year revenue reached $215.9 billion, up 65%.
Start trading now – Click here to create your real VT Markets account
Written on April 6, 2026 at 11:28 pm, by josephine
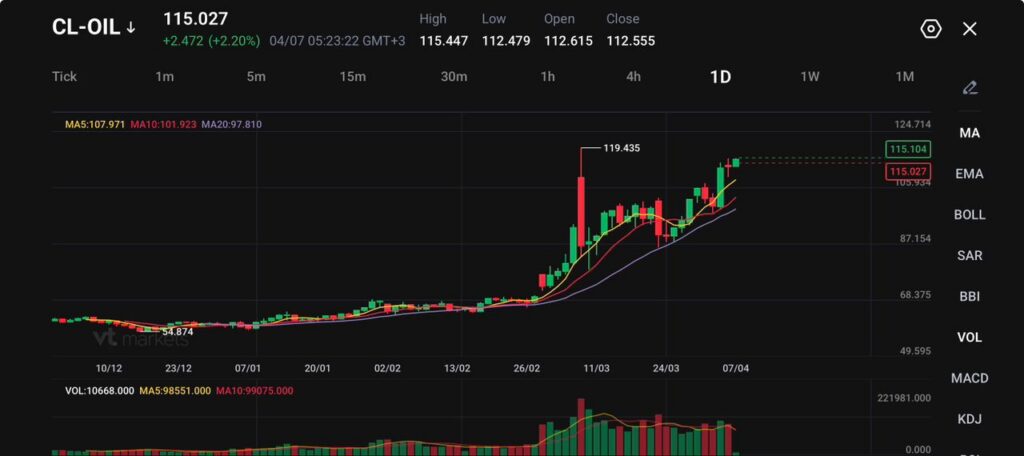
CL-OIL trades at 115.027, up 2.472 (+2.20%), after printing a session high of 115.447.
Brent crude rose 0.4% to $110.19, while WTI futures climbed 0.8% to $113.31 as traders waited for Tuesday’s deadline.
The Strait of Hormuz still carries about one-fifth of the world’s oil and natural gas supply, keeping the market focused on physical disruption rather than diplomacy alone.
Crude is still trading like supply risk has not eased. CL-OIL is holding above 115, and the broader futures market stayed firm as traders waited for Trump’s Tuesday deadline for a deal with Iran.
Brent held near $110.19 and WTI near $113.31, which kept the market in the upper end of the recent war-driven range.
The price action shows that the market is not willing to remove the risk premium ahead of an event that could escalate again within hours. Traders have seen enough failed diplomacy and partial relief headlines over the past month to keep paying for protection until Hormuz flows are clearly safer.
A cautious near-term view still favours elevated prices while the deadline remains live and the shipping picture stays unclear.
Hormuz Still Sets the Tone
The market is still trading the Strait of Hormuz first and everything else second. The route carries about 20% of global oil and natural gas supply, so any restriction there quickly feeds into shipping rates, insurance costs, and prompt crude pricing.
Iran has signalled that it wants a lasting outcome rather than a temporary ceasefire, and pressure to reopen the waterway has not yet produced a breakthrough.
Iran said it wanted a lasting end to the war with US-Israel, and pushed back against pressure to reopen the Strait of Hormuz while President Trump warned the country could be 'taken out' if it did not meet his Tuesday night deadline to reach a deal https://t.co/f6MWzfz103pic.twitter.com/1TP4tDkB0l
That leaves physical supply as the main variable. A market can tolerate aggressive rhetoric for a while. It reacts much more sharply when the main export artery for Gulf energy stays constrained.
That is why oil has stayed firm even when equities have tried to stabilise. The market still lacks a credible path to normal flows.
Equities Waver While Oil and the Dollar Stay Firm
Broader risk sentiment reflects the same hesitation. Asian equities moved in mixed fashion, with MSCI Asia-Pacific ex-Japan up 0.4%, while the Nikkei slipped 0.2%. At the same time, US stock futures fell 0.55%, showing traders were still reducing risk rather than fully buying the truce story.
The dollar also stayed supported. The dollar index held around 100.06, while the euro traded at $1.1538 and USDJPY hovered near 159.91, close to the level that keeps Tokyo sensitive to intervention risk.
That pattern is consistent with a market still pricing inflation pressure and slower growth together. Oil remains high enough to keep that stagflation mix in focus.
Inflation Risk is Starting to Show Up in US Data
The macro backdrop has started to absorb the energy shock. US services-sector growth slowed in March, while business prices paid rose at the fastest pace in more than 13 years, giving markets an early read on how the Iran war is feeding inflationary pressure.
That helps explain why traders are no longer pricing Fed cuts this year. Oil at these levels does not just hit fuel bills. It feeds into logistics, chemicals, transport, and broader input costs. Once that happens, central banks lose flexibility quickly.
A cautious forecast still points to tighter financial conditions if crude remains around current levels into the next inflation prints.
Technical Analysis
CL-OIL is trading near 115.03, continuing its strong upward trajectory after the sharp breakout from the late-February base. Price action shows sustained bullish momentum, with the market pushing steadily higher following the surge toward 119.43, and now consolidating just below that recent peak.
The structure remains clean, with higher highs and higher lows forming, indicating buyers are still in firm control.
From a technical standpoint, the trend remains firmly bullish. Price is trading well above all key moving averages, with the 5-day (107.97) leading the move higher, followed by the 10-day (101.92) and 20-day (97.81), all sloping upward in strong alignment. This reflects a persistent trend strength, while the current consolidation above the $110 region suggests the market is continuing to build rather than showing signs of exhaustion.
Key levels to watch:
Support: 110.00 → 105.90 → 101.90
Resistance: 115.50 → 119.40 → 124.70
The immediate focus is on the 115.50 area, which is acting as short-term resistance. A clean break above this level could open the path toward a retest of 119.40, with further upside potential if momentum accelerates.
On the downside, 110.00 is the key psychological and structural support. A break below this level could trigger a pullback toward 105.90, though such a move would likely remain corrective within the broader uptrend.
Overall, oil remains in a strong uptrend with consolidation at elevated levels. As long as price holds above the $110 zone, the bias stays firmly to the upside, with the market positioning for a potential continuation move toward recent highs.
What Traders Should Watch Next
The next move depends on whether the deadline produces a real reopening path for Hormuz or another escalation headline. Brent and WTI are already trading at levels that keep inflation fears alive, while the dollar and rates market continue to price that stress into the macro outlook.
If the deadline passes without progress and the waterway stays constrained, oil can keep pressing toward the recent highs.
If a deal emerges and traffic begins to normalise, the market can unwind part of the premium quickly, but it will likely need proof in flows rather than promises.
Learn more about trading Energies on VT Markets here.
Trader Questions
Why is Oil Still Holding Above $110?
Oil is holding high because traders still see a real risk of further disruption to Gulf energy flows while the Iran deadline remains unresolved. Brent was recently quoted at $110.19 and WTI at $113.31 in the wider futures market, which shows the risk premium is still firmly in place.
Why Does The Iran Deadline Matter So Much For Oil Prices?
A fixed deadline forces the market to price a near-term escalation risk. If no deal is reached and the Strait of Hormuz stays constrained, traders have to assume supply disruption could last longer and push prices higher.
Why is the Strait of Hormuz So Important for Crude?
The Strait carries about one-fifth of the global oil and natural gas supply, so even a partial disruption can lift freight costs, insurance premiums, and prompt crude prices very quickly.
Why Has Oil Stayed Firm Even Though Talks Are Still Happening?
The market is no longer reacting to diplomacy alone. It wants proof that energy flows will normalise. Until shipping risk clearly falls, traders are reluctant to strip out the premium from crude.
How Are Higher Oil Prices Affecting Broader Markets?
Higher crude prices are feeding inflation fears, tightening financial conditions, and keeping pressure on equities and central banks. Markets have already started pricing slower growth and firmer inflation together, which is why stagflation concerns keep resurfacing.
Why is the Dollar Staying Supported Alongside Oil?
The dollar is holding firm because investors are still using it as the main haven trade while the conflict remains live. The dollar index was recently around 100.06, which shows traders are still leaning defensive rather than moving fully back into risk assets.
Start trading now – Click here to create your real VT Markets account
Please note that the dividends of the following products will be adjusted accordingly. Index dividends will be executed separately through a balance statement directly to your trading account, and the comment will be in the following format “Div & Product Name & Net Volume”.
Please refer to the table below for more details:
The above data is for reference only, please refer to the MT4/MT5 software for specific data.
If you’d like more information, please don’t hesitate to contact info@vtmarkets.com.
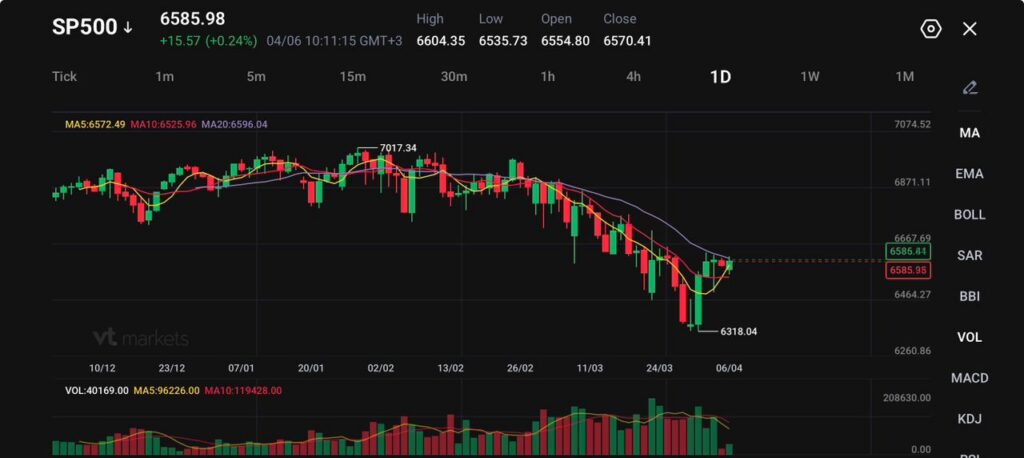
S&P 500 trades at 6585.98, up 15.57 (+0.24%), after last week’s nearly 6% rally, its best weekly gain since late November.
Futures turned softer on Monday, with Dow futures down 105 points (-0.2%), S&P 500 futures down 0.1%, and Nasdaq futures down 0.2%.
March payrolls came in at 178,000, well above the 59,000 consensus, which improved the growth picture but made rate-cut hopes harder to rebuild.
US equities opened the week trying to hold onto a powerful rebound, but the tone stayed cautious. A report that US, Iranian, and regional mediators were discussing a potential 45-day ceasefire helped trim the earlier losses in futures, yet markets did not move into a clean risk-on mode because the chances of a full deal before Trump’s deadline were still seen as slim.
The market is still trading the gap between headline optimism and the reality that shipping, energy flows, and military threats remain unresolved.
That left the S&P 500 in a familiar spot. Buyers are willing to defend part of last week’s rally, but they are not treating the ceasefire story as a full resolution. Any rebound built on diplomacy alone still has to survive the next oil move and the next political headline.
The Tuesday Deadline Keeps Pressure on Sentiment
The market is also reacting to a very specific risk marker. Trump said Tuesday would be “Power Plant Day, and Bridge Day” in Iran if the Strait of Hormuz is not reopened, which gave traders a hard deadline to price. That kind of event risk keeps traders defensive because it compresses the window for negotiation and increases the chance of another sharp move in oil or yields.
US allies are reportedly pressing for a last-minute deal with Iran, as Trump extended his deadline to Tuesday for Tehran to reopen the Strait of Hormuz, keeping markets on edge over whether a breakthrough can be reached https://t.co/MvIddpnZNa
That is why futures only partly recovered. Traders are not just asking whether talks are happening. They are asking whether a deal arrives in time to stop another escalation in infrastructure attacks and another jump in crude.
Last Week’s Rally is Now Being Properly Tested
The S&P 500 surged nearly 6% last week, while the Dow rose 3% and the Nasdaq jumped 4.4%. That rebound snapped a five-week losing streak and gave the market its strongest weekly performance since late November.
Monday’s session became the first real test of whether traders would defend those gains once geopolitical risk returned to the front of the tape.
US stocks ended slightly mixed after paring deeper losses, as diplomatic signals from the Middle East helped calm markets rattled earlier by Trump's threats of tougher action against Iran ahead of a long holiday weekend https://t.co/B2FFpClOD7pic.twitter.com/jis72uD61S
That test matters because sharp weekly rebounds inside unstable macro conditions often fail unless the market gets confirmation from lower oil, calmer yields, or stronger growth data. Right now, traders only have one of those three in partial form.
Payrolls Improved the Growth Story, but Tightened the Rate Debate
The March jobs report added another layer of tension. Payrolls rose 178,000, triple the 59,000 consensus. That reduced the fear of an immediate growth rollover, but it also made it harder to argue for faster Fed easing. In this environment, better growth data is supportive for earnings, but it also works against valuation support if it keeps yields firm and delays rate cuts.
That leaves the S&P 500 balancing two opposing forces. The labour market is holding up better than feared, which helps the economic backdrop. At the same time, oil remains the bigger variable, and a stronger growth print does not help if it keeps the Fed cautious while energy prices stay elevated.
SP500 Technical Outlook
The S&P 500 is trading near 6586, attempting a modest rebound after the sharp sell-off that drove price down to the 6318 low. Recent price action shows a short-term recovery, with buyers stepping in after the decline, but the move higher remains tentative.
The broader structure still reflects a loss of momentum from the earlier highs near 7017, with the market now trying to stabilise rather than fully reverse.
From a technical standpoint, the trend has shifted to a more neutral-to-bearish tone. Price is still trading below the 20-day moving average (6596), which is flattening and acting as overhead resistance, while the 5-day (6572) and 10-day (6526) have started to turn higher, supporting the current bounce. This suggests short-term recovery momentum is building, but the broader trend has yet to confirm a reversal.
Key levels to watch:
Support: 6535 → 6464 → 6318
Resistance: 6600 → 6675 → 6870
The immediate focus is on the 6600 level, which aligns with the 20-day average and recent rejection zone. A sustained break above this area could extend the recovery toward 6675, where stronger resistance is likely to emerge.
On the downside, 6535 is acting as near-term support. A break below this level could see price retest the 6464 region, with further weakness exposing the 6318 low.
Overall, the S&P 500 is in a corrective phase following its earlier uptrend. The current rebound looks like an early-stage recovery, but unless price can reclaim and hold above 6600–6675, the risk remains tilted toward further consolidation or another leg lower.
What Traders Should Watch Next
The next move depends on whether diplomacy produces a real pause before Tuesday’s deadline, whether oil stays contained, and whether yields react more to jobs strength or war risk. If crude stays calm and the market keeps absorbing the 178,000 payroll print without a sharp rise in yields, the S&P 500 can keep defending last week’s gains. If the deadline passes without progress and oil jumps again, the index may struggle to hold the 6570 to 6600 area.
Why Are S&P 500 Futures Soft Again After Last Week’s Strong Rally?
Futures turned lower because the market is trying to price two opposing forces at once: a possible 45-day ceasefire and Trump’s Tuesday deadline tied to Iran and the Strait of Hormuz. That kept traders from chasing risk higher even after last week’s nearly 6% S&P 500 rally.
What is the Main Risk the Market is Watching Right Now?
The main risk is whether diplomacy arrives before the deadline or whether the conflict widens and hits energy infrastructure again. Markets are treating that as an oil-and-yields problem first, not just a geopolitical headline problem.
Why Does the Tuesday Deadline Matter So Much for Stocks?
A fixed deadline compresses the market’s window for optimism. If no deal emerges before then, traders may quickly reprice the odds of another escalation in oil, inflation, and risk aversion.
How Does the Strait of Hormuz Feed Into the S&P 500?
The Strait affects energy supply. If flows stay constrained, oil prices stay high, inflation pressure lingers, and companies face higher input and transport costs. That usually weighs on margins and makes equities harder to support.
Why Does the Jobs Report Complicate the Market Outlook?
March payrolls came in at 178,000 versus a 59,000 consensus. That supports the growth outlook, but it also makes Fed rate cuts harder to justify quickly, which limits valuation support for stocks.
Start trading now – Click here to create your real VT Markets account
Written on April 5, 2026 at 11:50 pm, by josephine
US natural gas futures are around $2.84 per MMBtu, still close to their lowest level since August 2025.
The EIA reported a 36 Bcf injection for the week ending March 27, versus a five-year average 4 Bcf withdrawal for the same week.
Middle East tension is lifting oil and LNG risk, but US gas remains cushioned because domestic fundamentals stay loose and export terminals are already running near capacity.
US natural gas is trying to bounce, but the broader tone remains soft. NG-C trades at 2.893, up 0.035 or 1.22%, while broader pricing sits around $2.84 to $2.89 per MMBtu. Even with the small uptick, futures are still sitting close to the weakest levels since August 2025.
Turkey is weighing whether to raise electricity and natural gas prices, sources say, as surging global energy costs risk increasing the burden of state subsidies https://t.co/SilfHtCNWS
Spring weather is doing most of the work. Mild temperatures are cutting heating demand just as the market shifts from winter withdrawals into refill season. That soft demand backdrop is strong enough to overpower a large part of the geopolitical premium.
A cautious near-term view still favours a heavy market unless weather turns hotter or supply tightens more clearly.
Storage Data Keeps Balance Loose
The latest storage report reinforced the bearish setup. Working gas in storage rose by 36 Bcf in the week ending March 27, taking inventories to 1,865 Bcf. For the same week, the five-year average shows a 4 Bcf withdrawal.
That contrast is the key point. At this stage of the calendar, the market would usually still be drawing gas from storage. Instead, inventories are already building. That tells traders supply is outrunning current demand by a wide enough margin to keep pressure on prices.
Japan’s order for hundreds of Tomahawk missiles from the US is under threat as the American-Israeli war with Iran burns through inventories https://t.co/dsmJd3eWBz
That is why natural gas has struggled to rally even while broader energy markets remain tense.
Iran Risk Matters Less for Henry Hub Than for Oil
The geopolitical threat is still real. Trump warned that the US could strike Iranian infrastructure if the Strait of Hormuz is not reopened, and that has kept oil and global LNG markets on edge.
Henry Hub reacts differently. Oil is directly exposed to Hormuz. US natural gas is much less exposed because domestic production remains abundant and LNG export terminals are already operating near practical limits.
A purchase agreement between Commonwealth LNG and Japan’s top liquefied natural gas buyer, Jera, has been terminated, according to a document filed with the US Department of Energy https://t.co/nvea5tc3Sc
A global gas shock can lift sentiment, but it does not automatically create room for materially higher US exports when the export system is already close to full.
That caps the international spillover into US gas pricing.
A cautious forecast still allows for short-lived spikes on war headlines, but the market needs a domestic tightening signal before it can hold them.
Export Constraints Are Limiting the Upside Response
The export ceiling is what keeps the market grounded. A disrupted Hormuz route threatens a large share of global crude, products, and LNG flows, which supports international gas prices. US natural gas still cannot fully capture that upside when liquefaction capacity is already near max.
More than four-dozen empty Qatari liquefied natural gas tankers are idling across Asia, as the nation’s export plant remains shut and the Strait of Hormuz largely closed because of the war in the Middle East https://t.co/I021MHMatG
Without a meaningful new export outlet, extra overseas demand does not translate into the same kind of runaway move seen in crude. Domestic balances still matter more than foreign panic.
That leaves US gas in a different category from oil. Oil is trading on the shipping shock directly. Natural gas is trading with weather, storage, and export bottlenecks first, then adding a modest geopolitical premium on top.
Technical Analysis
Natural gas (NG) is trading near 2.89, hovering just above recent lows as the market continues to struggle for direction following its sharp decline from the 5.69 peak earlier in the year. Price action remains subdued, with the latest candles reflecting weak rebounds and a lack of sustained buying interest.
The recent low around 2.83–2.84 is holding for now, but the broader structure still shows a series of lower highs and lower lows, keeping pressure on the downside.
From a technical standpoint, the trend remains bearish. Price is trading below all key moving averages, with the 5-day (2.90) and 10-day (2.95) acting as immediate resistance, while the 20-day (3.08) continues to slope downward, reinforcing the underlying weakness. The compression of price near recent lows suggests consolidation, but without a clear reversal signal, this appears more like a pause within a broader downtrend.
Key levels to watch:
Support: 2.84 → 2.80 → 2.70
Resistance: 2.95 → 3.10 → 3.40
In the near term, price is consolidating just above 2.84, a level that has provided recent support. A break below this zone could trigger another leg lower toward 2.80 and potentially 2.70 if selling accelerates.
On the upside, 2.95 is the first level to reclaim. A move above this could lead to a short-term recovery toward 3.10, though any upside is likely to remain corrective unless price breaks and holds above the 3.40 region.
Overall, natural gas remains under sustained bearish pressure, with weak rallies and persistent selling defining the structure. Unless buyers can reclaim key resistance levels, the bias stays tilted to the downside, with consolidation near current levels likely preceding the next directional move.
What Traders Should Watch Next
The next move depends more on domestic balance than on foreign headlines. Weather comes first, then the next EIA storage report, then any change in LNG feedgas flows.
If injections keep running this far above normal, the market can stay pinned near the lows even with oil and global LNG under pressure. If hotter forecasts arrive or output slips enough to tighten balances, natural gas can recover from the $2.84 to $2.89 area. If mild weather persists and storage continues to build early, the market may remain trapped near the recent floor at around 2.837.
Learn more about trading Energies on VT Markets here.
Trader FAQs
Why is US Natural Gas Weak Even With Iran Risk in the Background?
US natural gas is trading more off domestic fundamentals than Middle East headlines. Mild weather has reduced heating demand, storage is building early, and LNG export capacity is already near full use. That combination has limited the risk premium.
What is the Main Reason Prices Are Near Their Lowest Since August 2025?
The biggest reason is loose supply-demand balance. The market is moving out of winter with weak weather demand, while inventories are already rising instead of falling.
What Did the Latest Storage Report Show?
The latest EIA data showed a 36 Bcf injection for the week ending March 27, compared with a five-year average 4 Bcf withdrawal for the same period. That is a much looser result than normal for this time of year.
Why Does a 36 Bcf Injection Matter So Much?
It shows supply is comfortably outpacing demand. At this stage of the calendar, traders would usually expect storage to still be drawing down or at least building more slowly.
Why is Natural Gas Not Rallying Like Oil?
Oil is directly exposed to Hormuz disruption. US natural gas is less exposed because domestic production is strong and LNG export terminals are already operating near maximum capacity. Global gas stress helps sentiment, but it does not translate into unlimited extra US demand.
Start trading now – Click here to create your real VT Markets account
Intel is buying back Apollo’s 49% stake in Fab 34 for $14.2 billion, restoring full ownership of the Ireland facility.
Intel shares jumped more than 9% after the announcement, showing how strongly the market responded to the deal.
Fab 34 is a strategic site tied to Intel 4 and Intel 3 production, including Core Ultra and Xeon processors.
Intel’s latest reported quarter showed $13.7 billion in Q4 2025 revenue, down 4% year over year, with adjusted EPS of $0.15.
Intel will report Q1 2026 earnings on April 23, 2026, which may become the next major catalyst for the stock.
Intel is back in focus after announcing a $14.2 billion deal to repurchase Apollo’s 49% stake in Fab 34, its advanced manufacturing joint venture in Ireland.
Intel agreed to pay $14.2 billion to buy back half of a plant in Ireland that it had previously sold to Apollo Global Management. https://t.co/usmMFsrHti
The news sent Intel shares up more than 9%, but the bigger story is the change in perception around the company. Instead of focusing only on Intel’s past struggles, investors are beginning to ask whether this marks a more credible phase in its recovery.
Intel shares jump 9% after buying back Ireland chip fab in sign of renewed strength https://t.co/qM5mviVPq4
That shift matters because Intel is no longer being judged only as a legacy chipmaker tied to PCs and servers. The market is increasingly focused on whether the company can rebuild its manufacturing edge, support its foundry ambitions, and compete more effectively in a semiconductor industry being reshaped by AI demand. In that discussion, Fab 34 now sits near the centre of Intel’s turnaround narrative.
Intel’s Strategic Position in a Changing Semiconductor Market
Intel remains one of the most established names in the global semiconductor industry. The company designs and manufactures processors and related technologies used across personal computers, enterprise systems, data centres, and cloud infrastructure.
What makes Intel different from many of its peers is that its story still depends heavily on manufacturing ownership, not just chip design. That is a strength when execution is working, but it also makes Intel more exposed when capital spending is high and returns take time to emerge. This is an inference based on Intel’s business model and how analysts are framing the stock today.
That is also why the Fab 34 repurchase is being treated as more than a routine transaction. For Intel, this is not simply an asset buyback. It is a move that suggests management wants fuller ownership of a site that is increasingly central to the company’s product roadmap and manufacturing credibility.
Reuters noted that the plant produces chips on Intel 4 and Intel 3, while market commentary has framed the buyback as a signal of confidence in Intel’s foundry prospects.
Fab 34 Gives Intel a Stronger Story, but Not a Free Pass
Intel’s decision to repurchase Apollo’s stake matters because it reflects a clear change in posture. In 2024, Apollo’s $11.2 billion investment gave Intel financing flexibility when the company was under heavier pressure and trying to fund a costly manufacturing buildout without weakening its balance sheet further.
The Wall Street Journal reported that the original arrangement helped Intel avoid more expensive funding at a more fragile point in the cycle. By taking the stake back, Intel is signalling that the company is strong enough to own the facility outright again.
Intel CFO David Zinsner said the company is in a stronger financial position now than it was two years ago. Intel also said the deal should help improve profits and strengthen its credit profile by 2027.
This helps explain why the market responded positively. The deal improves Intel’s story in a few ways:
It shows more confidence in Intel’s manufacturing business
It makes the recovery story easier to understand
It shows Intel wants full ownership of an important asset
It gives investors a clearer view of Intel’s manufacturing and foundry plans
Furthermore, analysts have taken the deal as a positive signal. UBS analyst Timothy Arcuri, cited by MarketWatch, saw it as a sign of confidence in Intel’s manufacturing plans, while Barron’s said the move helped improve investor sentiment at a time when the broader tech market was still under pressure.
The deal price also matters. Apollo paid $11.2 billion for the stake in 2024, while Intel is now paying $14.2 billion to buy it back. That means Intel is willing to pay a meaningful premium to regain full ownership, which suggests management sees stronger long-term value in the asset today.
Why Fab 34 Carries More Weight Than a Typical Factory
The deal carries added weight because of the role Fab 34 plays within Intel’s manufacturing network. Based in Leixlip, Ireland, the facility is one of Intel’s key advanced fabs, producing chips on Intel 4 and Intel 3, including Core Ultra and Xeon processors. It was also the company’s first high-volume site to use EUV lithography for Intel 4.
Its importance goes beyond production capacity alone. Intel’s recovery depends not only on product demand, but also on rebuilding confidence in its manufacturing execution. In that sense, Fab 34 is directly tied to Intel’s broader effort to restore credibility in advanced process technology.
Reuters also noted that Intel is increasing its focus on 18A, which management views as a major part of its comeback strategy. Seen in that light, taking full ownership of Fab 34 suggests Intel wants closer control over the manufacturing foundation behind its next stage of recovery.
A Stronger Narrative, but Not Yet a Proven Turnaround
The bullish interpretation is fairly clear. Intel appears to be moving away from financial defence and toward more assertive strategic control. A company that previously sold part of a key fab to preserve flexibility is now buying it back, which naturally reads as a sign of greater confidence. Barron’s cited Melius Research’s Ben Reitzes, who viewed the move as a strong indicator of Intel’s improving position, especially as investors focus more on AI-driven server demand and infrastructure exposure.
Even so, the operating picture still requires caution. Intel’s latest reported quarter showed Q4 2025 revenue of $13.7 billion, down 4% year over year, while adjusted EPS came in at $0.15. Full-year 2025 revenue was $52.9 billion, flat year over year. Those numbers suggest stabilisation, but they do not yet show a clean return to strong growth.
Clearer evidence that strategic actions are translating into operating progress
In that context, the Fab 34 buyback matters because it has sharpened Intel’s story while also raising expectations. The market may reward the signal in the near term, but sustaining that confidence will depend on whether management can turn greater control into visibly better results.
Competitive Pressure Has Not Disappeared
The excitement around Intel’s stock move should also be kept in perspective. NVIDIA continues to dominate AI mindshare, while AMD remains a highly credible competitor across CPUs and data centres. Intel’s Fab 34 repurchase may strengthen its manufacturing narrative, but it does not by itself close the competitive gap.
This remains partly an analytical view, but it broadly reflects how Intel is being framed in current market coverage, as a company making progress while still trailing the sector’s leading AI names. That broader backdrop was also evident in our recent piece on Big Tech earnings and the AI cycle.
Investors therefore remain cautious. Turnaround stories that depend on heavy capital investment can draw strong buying when sentiment improves, but they can also face quick doubt if results disappoint. Intel is no longer being assessed only on its ability to stabilise. It is now being judged on whether it can regain strategic relevance in a semiconductor market shaped by AI infrastructure, manufacturing execution, and capital discipline.
Explore other stocks shaping the AI and semiconductor landscape on the VT Markets app.
The Next Earnings Report Matters Most
The next major test will be Intel’s first-quarter 2026 earnings report on April 23, 2026. That update is likely to matter more than the initial reaction to the Fab 34 deal, because it will show whether stronger control over key assets is leading to real operating progress.
If the report shows steadier demand, improving profitability, and stronger business traction, the market may treat the buyback as an early sign of a more credible turnaround. If not, the deal may end up being remembered as a bold strategic move that arrived before the numbers were ready to fully support it.
For now, Intel has improved the narrative. The next step is proving that the narrative can hold up under earnings, margins, and execution.
Bottom Line
Intel’s decision to repurchase Apollo’s stake in Fab 34 has strengthened the company’s recovery narrative by restoring full ownership of a strategically important manufacturing asset. The move suggests greater confidence in Intel’s long-term manufacturing plans and offers investors a clearer view of its strategic direction.
At the same time, the transaction does not remove the need for further proof. The market will still be looking for stronger margins, better utilisation, and more consistent operating progress before viewing this as a confirmed turning point in Intel’s recovery.
Create a live VT Markets account today to access our platform features, including market insights and educational content.
Frequently Asked Questions
1. Why did Intel stock go up?
Intel stock went up after the company announced a $14.2 billion deal to buy back Apollo’s 49% stake in Fab 34 in Ireland. Investors viewed the move as a sign of stronger confidence in Intel’s recovery strategy.
2. What is Intel’s Fab 34?
Fab 34 is Intel’s advanced chip manufacturing facility in Leixlip, Ireland. It produces chips based on Intel 4 and Intel 3, including Core Ultra and Xeon processors.
3. Why did Intel buy back Apollo’s stake in Fab 34?
Intel bought back Apollo’s 49% stake to regain full ownership of the fab. The move suggests the company sees more value in owning the facility outright as part of its long-term strategy.
4. Does the Fab 34 buyback mean Intel is recovering?
The buyback strengthens Intel’s recovery story, but it does not prove the turnaround is complete. Investors still want to see better margins, stronger earnings, and clearer operating progress.
5. When is Intel’s next earnings report?
Intel is scheduled to report first-quarter 2026 earnings on April 23, 2026. Investors will be watching that report closely for signs that the company’s recovery is gaining momentum.
6. Is Intel still behind Nvidia and AMD?
Intel remains a major semiconductor company, but it is still widely seen as trailing Nvidia in AI leadership and facing strong competition from AMD in CPUs and data centres. The Fab 34 deal improves Intel’s story, but the company still needs stronger results to narrow that gap.
Start trading now – Click here to create your real VT Markets account
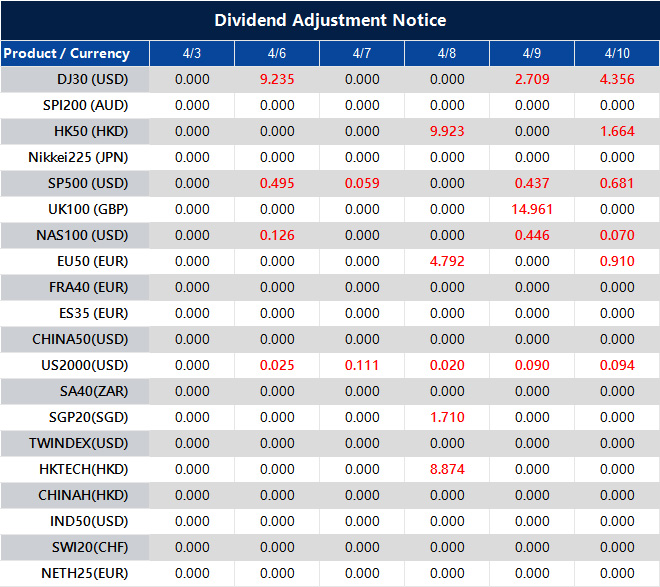
Please note that the dividends of the following products will be adjusted accordingly. Index dividends will be executed separately through a balance statement directly to your trading account, and the comment will be in the following format “Div & Product Name & Net Volume”.
Please refer to the table below for more details:
The above data is for reference only, please refer to the MT4/MT5 software for specific data.
If you’d like more information, please don’t hesitate to contact info@vtmarkets.com.
Dear Client,
To ensure fair trading conditions and manage market volatility during major economic announcements, VT Markets will apply temporary leverage adjustments on certain trading products during specific news periods and market opening/closing.
These adjustments are designed to protect clients from abnormal market fluctuations, sudden liquidity changes, and extreme price movements that may occur during high-impact news releases.
1.Products Affected
The temporary leverage adjustment may apply to the following products:
• Forex
• Gold
• Silver
• Oil
• Indices
• Commodities (including XPT and XPD)
2. Adjusted Leverage During News Releases and Market Opening/Closing
During the specified news period, maximum leverage will be adjusted as follows:
Forex: 200
Gold: 200
Silver: 50
Oil: 20
Indices: 50
Commodities: 5
Please note that each product with leverage already below the above will not be affected.
3. News Events That Can Trigger the Adjustment
Leverage adjustments may be applied during major economic announcements including:
• FOMC Interest Rate Decisions
• CPI (Consumer Price Index)
• GDP
• PMI / NMI
• PPI
• Retail Sales
• Non-Farm Payroll (NFP)
• ADP Employment Data
• Crude Oil Inventories
The above data is for reference only. Other significant macroeconomic releases from major economies may also be included.
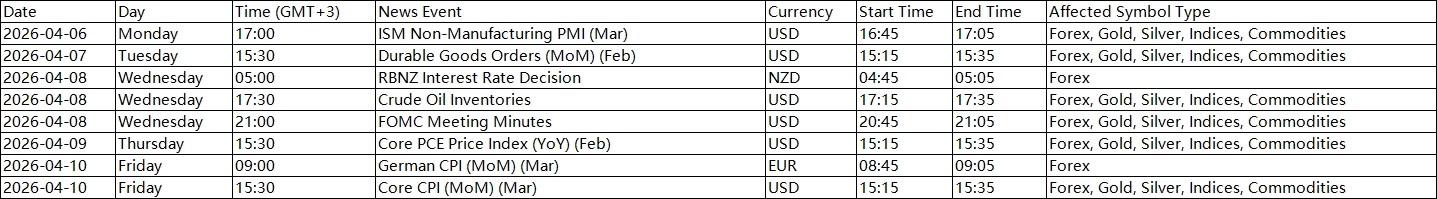
Please refer to the table below for details of the upcoming events and affected instruments:
All dates and times are stated in GMT+3 (MT4/MT5 server time).
4. Affected Period of News Releases and Market Opening/Closing
Temporary leverage adjustments apply during the following periods:
Economic News Period
• 15 minutes before the announcement
• 5 minutes after the announcement
Market Opening / Closing Period
• 3 hours before the weekly market closing (Friday)
• 30 minutes after market reopening (Monday)
• 30 minutes before daily market closing (Monday – Thursday)
After the above period ends, leverage will automatically return to the original leverage.
5. Important Rules
• The adjustment only affects new positions open during the adjustment period.
• Positions opened before the adjustment period will not be affected.
• Once the adjustment period ends, original leverage will resume automatically.
We strongly encourage clients to take these temporary leverage adjustments into account when planning trading strategies during high-impact economic events.
If you have any questions, please contact our support team: info@vtmarkets.com.