As part of our commitment to provide the most reliable service to our clients, there will be maintenance this weekend.
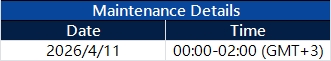
Maintenance Details:
Please note that the following aspects might be affected during the maintenance:
1. The price quote and trading management will be temporarily disabled during the maintenance. You will not be able to open new positions, close open positions, or make any adjustments to the trades.
2. There might be a gap between the original price and the price after maintenance. The gaps between Pending Orders, Stop Loss, and Take Profit will be filled at the market price once the maintenance is completed. It is suggested that you manage the account properly.
3. During the maintenance period, VT Markets APP will not be available. It is recommended that you avoid using it during the maintenance.
4. During the maintenance hours, the Client portal will be unavailable, including managing trades, Deposit/Withdrawal and all the other functions will be limited.
The above data is for reference only. Please refer to the MT4/MT5 software for the specific maintenance completion and marketing opening time.
Thank you for your patience and understanding about this important initiative.
If you’d like more information, please don’t hesitate to contact info@vtmarkets.com
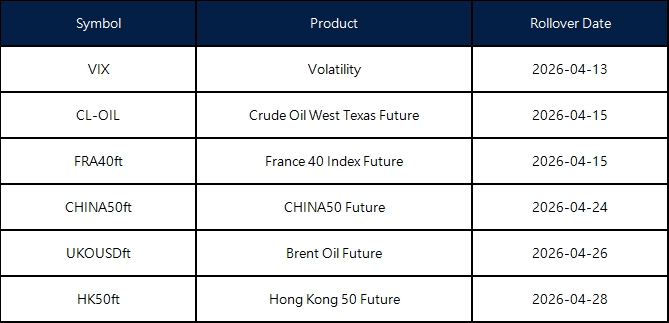
New contracts will automatically be rolled over as follows:
Please note:
• The rollover will be automatic, and any existing open positions will remain open.
• Positions that are open on the expiration date will be adjusted via a rollover charge or credit to reflect the price difference between the expiring and new contracts.
• To avoid CFD rollovers, clients can choose to close any open CFD positions prior to the expiration date.
• Please ensure that all take-profit and stop-loss settings are adjusted before the rollover occurs.
• All internal transfers for accounts under the same name will be prohibited during the first and last 30 minutes of the trading hours on the rollover dates.
The above data is for reference only. The actual rollover date shall be subject to the Liquidity Provider’s determination.
If you’d like more information, please don’t hesitate to contact info@vtmarkets.com.
ExxonMobil sits at the centre of one of the biggest market debates: whether traditional oil majors can adapt to a lower-carbon future without sacrificing profitability.
Exxon is maintaining an oil-first strategy, backed by strong global demand and cash flow
The company is investing selectively in carbon capture, hydrogen, and low-emission fuels
For traders, XOM remains closely tied to oil prices, geopolitics, and energy demand cycles
Recent headlines have highlighted a shift in sentiment across the energy sector, with oil majors moving from a period of strong gains into renewed volatility. A key trigger has been the disruption to Exxon’s operations linked to geopolitical tensions in the Middle East.
According to recent reporting, Exxon has seen around 6% of its global output affected due to conflict-related disruptions in the region. At the same time, broader energy markets have started to soften after a strong run, with oil prices pulling back as supply concerns fluctuate and demand expectations adjust.
This combination has created pressure on XOM stock in the short term:
Production disruptions raise uncertainty around near-term output.
Shifting market sentiment moves energy stocks from momentum to reassessment.
What makes this particularly important is how quickly the narrative can change. Energy stocks often move in cycles, and the same factors that drove record gains, such as tight supply and geopolitical risk, can also lead to sharp pullbacks when conditions stabilise or expectations shift.
This is where Exxon’s strategy becomes relevant again.
When the market moves from strong gains into uncertainty, investors tend to reassess:
How resilient are earnings across cycles?
Whether production growth can offset disruptions.
How well-positioned are companies for longer-term structural shifts?
In other words, the recent decline is not just about short-term headlines. It is a reminder that Exxon’s performance still sits at the intersection of oil markets, geopolitics, and long-term energy transition dynamics.
The energy transition is often described as a simple shift away from oil. Markets, however, rarely move in simple lines. The real story is more complicated, and ExxonMobil sits right in the middle of it.
XOM still generates the bulk of its earnings from oil and gas. That alone makes it highly sensitive to crude prices, geopolitical risk, and the broader supply-demand balance in global energy markets.
Exxon Mobil says 6% of its global first-quarter production was knocked out as the US-Israel war on Iran paralyzed much of the Persian Gulf energy industry https://t.co/XYGLeLdxMn
At the same time, the company is also trying to position itself for a lower-carbon future, though on its own terms and in its own chosen areas.
That creates the central tension behind XOM stock. Exxon is not trying to reinvent itself as a renewable energy company. It is trying to remain an oil giant while selectively building businesses that fit the next phase of energy demand.
Exxon’s Strategy: Oil First, Transition Second
Exxon’s strategy stands out because it is more cautious and more selective than that of some of its peers. Rather than making an aggressive public pivot into wind and solar, the company has chosen to keep its core oil and gas engine firmly in place.
That decision reflects the company’s view that the world will continue to need large volumes of hydrocarbons for decades, even as lower-emission technologies gain ground.
In practice, that means Exxon is still allocating substantial capital toward upstream production, particularly in areas where it believes returns are strongest and project economics remain attractive.
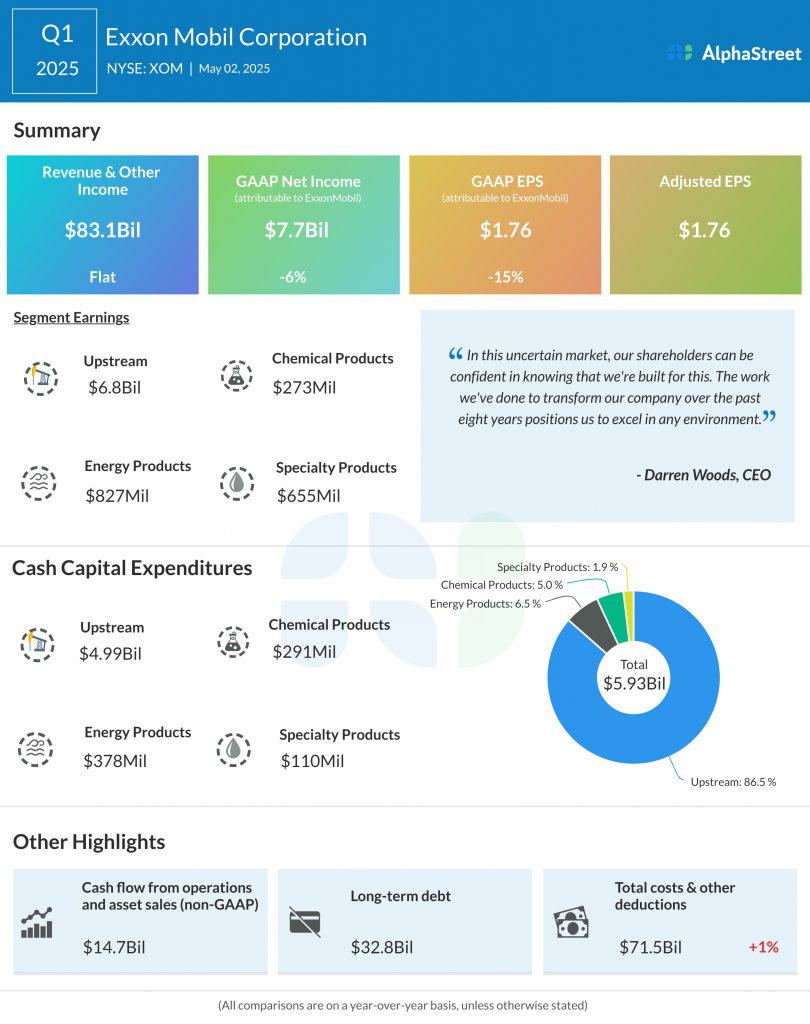
Its expansion in places such as Guyana and the Permian Basin reflects that approach. These are not side projects. They are central to Exxon’s current earnings power and long-term production strategy.
Source: AlphaStreet
This oil-first model gives the company a few important advantages:
High cash flow during strong energy cycles: When crude prices rise, Exxon’s traditional operations generate the cash needed to support dividends, buybacks, and long-term investment.
Operational familiarity and scale: The company understands large-scale hydrocarbon production better than almost anyone in the industry.
Capital discipline: Management can continue investing in areas where returns are visible, rather than chasing growth in unfamiliar markets.
The trade-off, of course, is perception. Exxon can look slower to transition than its peers that market themselves more aggressively around renewables. But the company appears comfortable with that distinction. Its message is clear: remain strong in oil first, then build transition exposure in areas where it believes the returns are commercially durable.
A Different Take on the Energy Transition
That does not mean Exxon is ignoring the energy transition. It means it is approaching it in a different way.
Rather than spreading itself across a broad range of renewable technologies, Exxon has concentrated its lower-emission strategy around a narrower set of industrial opportunities. These are areas where it believes its engineering capability, industrial scale, and energy infrastructure experience can provide a competitive edge.
The company’s transition focus is concentrated in several key areas:
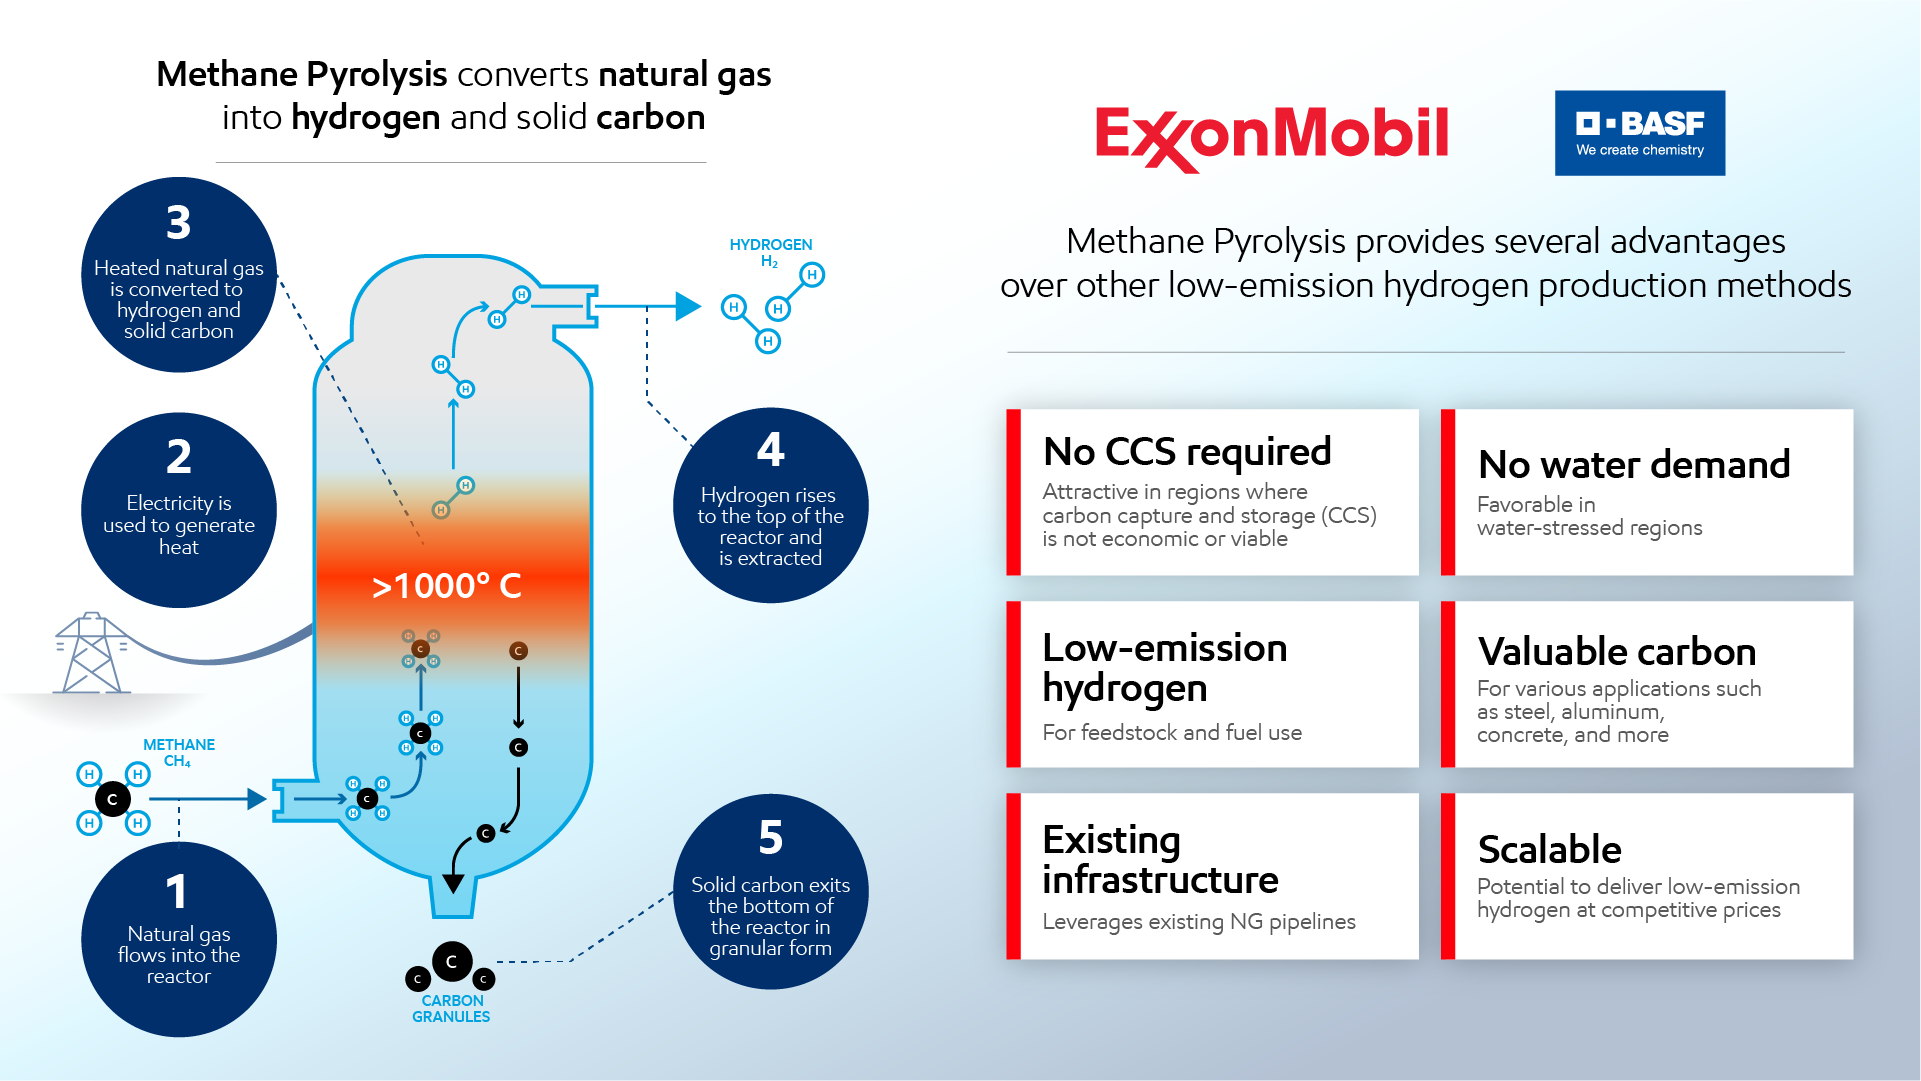
Carbon capture and storage (CCS): Exxon sees carbon capture as one of the most commercially viable pathways for reducing industrial emissions at scale.
Hydrogen: The company is building exposure to hydrogen as a fuel source for sectors that are difficult to electrify.
Low-emission fuels: This includes fuels aimed at industrial and heavy transport use cases where conventional electrification may be less practical.
Source: ExxonMobil
This is an important distinction. Exxon is not trying to win the consumer-facing renewable race. It is targeting industrial decarbonisation, where projects tend to be larger, longer-duration, and more aligned with the company’s existing capabilities.
That selective approach also helps explain why the market remains divided on Exxon’s transition story. Some investors see discipline and realism. Others see hesitation. In truth, the company is making a deliberate bet that the most profitable parts of the transition will not necessarily be the loudest ones.
As Darren Woods, CEO of ExxonMobil, has repeatedly argued, the world still needs a secure energy supply at scale, and reducing emissions must happen in a way that fits industrial reality rather than political slogans alone.
Oil Demand Is Still the Foundation
One of the reasons Exxon can maintain this strategy is that oil demand remains more resilient than many early transition narratives assumed.
Even as cleaner technologies gain market share, large parts of the global economy still depend on hydrocarbons. Aviation, shipping, freight, petrochemicals, and heavy industry continue to rely heavily on oil and gas. Emerging economies also remain major engines of incremental energy demand, particularly where infrastructure for alternatives is still developing.
This means Exxon’s core business still rests on a powerful foundation:
Global oil demand remains above 100 million barrels per day: That level of consumption continues to support large-scale upstream investment.
Demand is proving sticky in hard-to-electrify sectors: Industrial transport and heavy manufacturing still rely on traditional fuels.
Energy security remains politically important: Governments continue to prioritise stable access to oil and gas, especially during periods of geopolitical tension.
This matters for XOM stock because it reinforces the relevance of Exxon’s core earnings engine. The transition may be real, but so is the continued need for hydrocarbons. For now, Exxon is operating in the overlap between those two realities.
Cash Flow Is the Real Advantage
Exxon’s transition strategy only works because its traditional business continues to generate the cash to support it.
That cash flow is arguably the company’s biggest strategic advantage. In stronger oil environments, Exxon has the ability to fund shareholder returns and future-facing projects at the same time. That is a powerful position, particularly when compared with transition strategies that rely more heavily on external capital or lower-margin growth areas.
The company’s financial strength supports several priorities at once:
Dividend support: XOM remains attractive to income-focused investors because of its long-standing dividend profile.
Shareholder returns: Buybacks and balance-sheet flexibility are easier to sustain when operating cash flow is strong.
Transition investment: New spending on carbon capture, hydrogen, and low-emission technologies can be funded internally.
However, this also creates a subtle tension. Strong oil profits give Exxon more flexibility, but they can also reduce the market urgency to diversify. In other words, the better the oil cycle is for Exxon, the easier it becomes to keep the transition on a selective rather than transformative path.
That is why traders need to look beyond the headline cash flow number. The real question is how effectively Exxon uses the strength of its traditional business to prepare for a changing energy mix.
Geopolitics Still Favours Oil
The energy transition is also shaped by geopolitics, and in the short to medium term, geopolitics still tends to favour oil.
Tensions in the Middle East, OPEC production decisions, sanctions, shipping disruptions, and supply shocks all have a direct effect on crude prices. Because Exxon’s earnings remain closely linked to hydrocarbon markets, the company often benefits when supply risks push energy prices higher.
This is one of the reasons EXXON continues to hold macro relevance. It is not just a stock tied to company-specific execution. It is also a market proxy for broader energy security concerns.
Several geopolitical drivers continue to matter:
Middle East tensions: These can quickly raise supply-risk premiums in oil markets.
OPEC and producer coordination: Production cuts or discipline can support oil prices and improve earnings visibility for Exxon.
Sanctions and trade routes: Disruptions to global flows can reinforce the value of established producers with global scale.
From a trading perspective, this means XOM often becomes more attractive when oil volatility rises. Even if the long-term transition story remains a live debate, short-term market conditions can still swing strongly in favour of Exxon’s legacy strengths.
Exxon’s performance remains closely tied to crude oil movements. Traders often monitor XOM alongside broader energy markets and USOil to track shifts in supply and demand.
What Traders Should Watch
For traders, XOM is best understood as a stock where corporate fundamentals and macro conditions are tightly linked.
The first and most obvious variable is oil itself. Exxon’s earnings power still responds directly to crude prices, so any sustained move in WTI or Brent is likely to shape sentiment around the stock.
But the stock is not driven by oil alone. Traders should also watch whether Exxon’s capital allocation supports the case that the company is preparing intelligently for the next phase of the energy market.
A few signals matter most:
Oil price trends: These remain the strongest short-term driver of earnings expectations.
Capital expenditure discipline: The market wants to see spending support growth without eroding returns.
Transition project progress: Carbon capture and hydrogen investments matter more when they start to show commercial traction.
Dividend durability: Exxon’s appeal for many investors still depends on reliable shareholder returns.
Geopolitical developments: These can reprice the stock quickly through the oil channel, even before company-specific news arrives.
This is where interpretation matters. A trader looking at XOM is not just analysing an oil major. They are also analysing the shape of the global energy cycle, the durability of oil demand, and whether the market is rewarding traditional profitability over transition ambition.
As energy markets evolve, traders can also explore opportunities across oil, commodities, and global energy stocks through CFD Shares on the VT Markets app.
How XOM Fits Into a Broader Trading Strategy
XOM works well in a broader trading strategy because it can express multiple market views at once.
For some traders, it is primarily a crude oil proxy with equity characteristics.
For others, it is a dividend-backed energy exposure with lower volatility than pure commodity instruments. It can also serve as a way to gain exposure to inflationary or geopolitically driven market environments.
Within portfolio construction, XOM can play several roles:
Energy exposure with company-specific cash flow support
A real-asset hedge during inflationary periods
A more stable complement to commodity-linked trades
A way to monitor how the market is pricing the tension between oil demand and energy transition policy
It also creates natural links to other tradable assets. Traders following XOM often keep one eye on crude, one eye on broader energy indices, and another on transition-sensitive names across industrials and clean energy. That wider context is what makes the stock useful. It is not just a single-company story. It is a window into how markets are balancing old energy and new energy at the same time.
Bottom Line
For traders and investors, that makes XOM stock a useful name to watch. It remains deeply tied to oil markets, but it also offers insight into how one of the world’s largest energy companies is navigating the shift toward a lower-carbon future without giving up the earnings power of its traditional business.
Create a live VT Markets account today to access our platform features, including market insights and educational content.
FAQs
What is XOM stock?
XOM stock represents shares of Exxon Mobil Corporation, one of the world’s largest oil and gas companies.
Is ExxonMobil investing in clean energy?
Yes. Exxon is investing in carbon capture, hydrogen, and low-emission fuels, although it remains heavily focused on oil and gas.
Why is XOM stock tied to oil prices?
Exxon’s revenue and profits are largely driven by oil and gas production, making its stock highly sensitive to energy prices.
Is XOM a good dividend stock?
XOM is known for its strong dividend, typically offering yields in the 3% to 4% range, supported by cash flow from operations.
Can ExxonMobil adapt to the energy transition?
Exxon is pursuing a selective strategy, focusing on industrial decarbonisation while maintaining its core oil business.
Start trading now – Click here to create your real VT Markets account
Written on April 9, 2026 at 12:28 am, by josephine
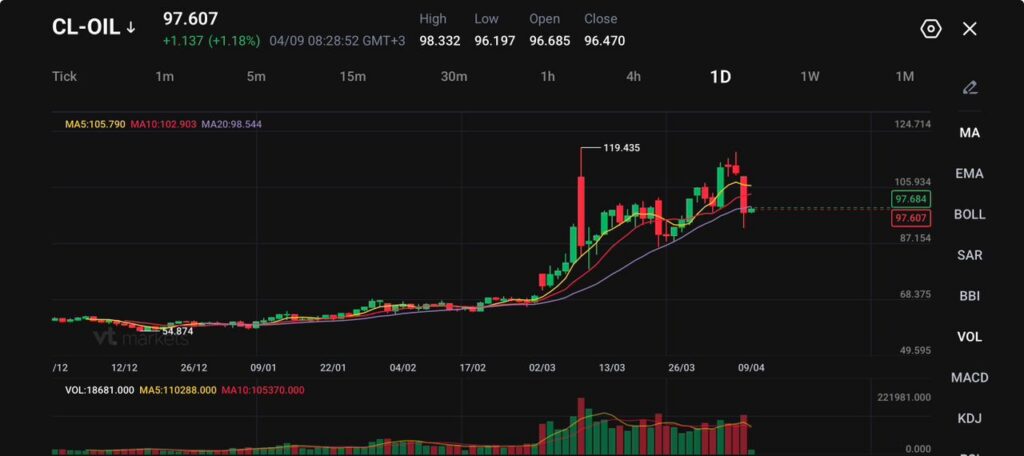
CL-OIL trades at 97.607, up 1.137 (+1.18%), after a high of 98.332 and a low of 96.197.
Forecasts still point to firm prices, with 2Q Brent seen at $98.00 and WTI at $92.50.
Shipping through the Strait of Hormuz remains constrained by security fears, insurance costs, and operational bottlenecks, which limits how much supply can return quickly.
Oil sold off hard on the first ceasefire headlines, but the rebound shows the market no longer believes a truce automatically means smooth energy flows. Prices are now rebuilding because traders are starting to focus on what happens after the headline.
Cargoes still need safe passage, insurers still need to price risk, and shipowners still need confidence that routes will stay open.
That is why the correction may have already gone too far. The market removed a large part of the war premium quickly, but physical conditions in the Gulf still look too strained for a clean return to pre-crisis movement.
A cautious near-term view still favours elevated prices while the ceasefire remains fragile and actual transit conditions lag the political message.
Hormuz is Open in Name More Than in Practice
The main issue is not whether a diplomatic pause exists. The issue is whether enough oil can move through Hormuz without disruption, delay, or extreme cost. The latest reporting shows the strait remains logistically constrained by security threats, mine risks, political control measures, and elevated insurance premiums. That keeps effective supply tighter than a ceasefire headline alone would suggest.
Traffic has improved only marginally from the worst point of the disruption. That matters because crude does not need a full shutdown to stay expensive. A market can stay tight when flows are partial, slow, expensive, or highly selective. The energy system prices reliability, not just theoretical access.
That leaves oil supported even after the steep initial drop.
LNG May Move Faster Than Crude
One exception may be LNG cargoes. The latest shipping read suggests some LNG vessels are already loaded and could move on relatively short notice if passage risk becomes manageable. That creates a split inside the energy complex.
Gas cargoes may recover somewhat faster than crude if operators judge the route passable, while oil stays more heavily affected by insurance, shipowner caution, and wider physical bottlenecks.
Asian LNG prices are set to fall after the US and Iran agreed to a two-week ceasefire that could temporarily reopen the Strait of Hormuz, bringing respite to global energy markets https://t.co/mtJ3oodoKN
That distinction matters because it limits the idea of a full energy normalisation. Some segments may recover sooner, but the oil market is still treating the supply chain as damaged rather than healed.
The Market is Repricing From Panic Into Scarcity
The move now looks less like panic and more like a slower scarcity trade. Forecasts for the second quarter still sit at $98.00 for Brent and $92.50 for WTI, which fits a market where the worst-case supply shock has eased but normal flows have not returned.
The rebound toward the high $90s lines up with that view. Prices no longer need to stay above $110 to signal stress. They only need to remain high enough to reflect limited confidence in the physical restart.
Even with a ceasefire agreement, stranded vessels and rising fuel costs are rippling through global trade, testing American guarantees of safe passage https://t.co/XmufFBaq9A
That also explains why the market is no longer trading in a straight line. The first leg was driven by war premium. The current phase is being driven by how much of that premium should remain embedded while shipping stays constrained.
A cautious forecast still points to a choppy but supported market rather than a clean collapse back toward pre-crisis levels.
CL-OIL Technical Outlook
CL-OIL is trading near 97.61, pulling back sharply after failing to sustain momentum near the recent highs around 119.43. Price action shows a clear rejection from the upper range, with the latest move breaking below short-term structure and signalling a shift from bullish continuation into a corrective phase.
The drop toward the 97–98 zone reflects increasing selling pressure as the market unwinds part of its earlier rally.
From a technical standpoint, the trend is transitioning toward neutral. Price has slipped below the 5-day (105.79) and 10-day (102.90) moving averages, both of which are now turning lower and acting as overhead resistance.
The 20-day (98.54) is being tested, and its ability to hold will be key in determining whether this remains a pullback or develops into a deeper trend reversal.
Key levels to watch:
Support: 97.00 → 93.90 → 87.15
Resistance: 100.00 → 102.90 → 105.90
The immediate focus is on the 97.00 support zone, which price is currently testing. A break below this level could open the path toward 93.90, signalling a deeper correction within the broader move.
On the upside, 100.00 is now acting as near-term resistance. A move back above this level would suggest stabilisation and could lead to a recovery toward 102.90, where stronger resistance is likely to emerge.
Overall, oil is undergoing a corrective pullback after an extended rally. The loss of short-term moving average support suggests momentum has weakened, and unless price can reclaim the 100–103 region, the risk remains tilted toward further downside or consolidation in the near term.
What Traders Should Watch Next
The next move depends on physical flow, not just diplomatic language. Watch whether ship traffic through Hormuz actually improves, whether insurance costs ease, and whether LNG movement starts to recover faster than crude.
If transport remains patchy and expensive, the market can keep oil close to current levels even without a full return to war panic. If flows normalise faster than expected, the correction can extend further.
Learn more about trading Energies on VT Markets here.
Trader Questions
Why Did Oil Prices Rebound Even After The Ceasefire Announcement?
Oil rebounded because the ceasefire reduced panic but did not restore normal supply conditions. Security concerns, high insurance costs, and operational bottlenecks are still limiting how much crude can move through the Strait of Hormuz.
Why Is The Strait Of Hormuz Still So Important For Oil Prices?
The market still treats Hormuz as the key risk point because supply is only useful if it can move safely and reliably. If transit stays partial, slow, or expensive, oil can remain supported even without a full shutdown.
Does A Ceasefire Mean Oil Prices Should Fall Straight Away?
No. A ceasefire can remove part of the war premium, but prices may stay firm if physical flows do not recover quickly. Traders are now watching actual shipping conditions more closely than diplomatic language alone.
Why Could The Initial Selloff In Oil Have Been Too Deep?
The first move lower priced in relief quickly, but the market is now reassessing whether enough supply can really return. Forecasts still point to 2Q Brent averaging $98.00 and WTI averaging $92.50, which suggests prices may not fall back to pre-crisis levels soon.
Why Might LNG Recover Faster Than Crude?
Some LNG cargoes are already loaded and may be able to move on short notice if passage conditions improve. Crude faces a heavier drag from insurance, shipowner caution, and broader operational friction.
Start trading now – Click here to create your real VT Markets account
Written on April 8, 2026 at 10:00 pm, by josephine
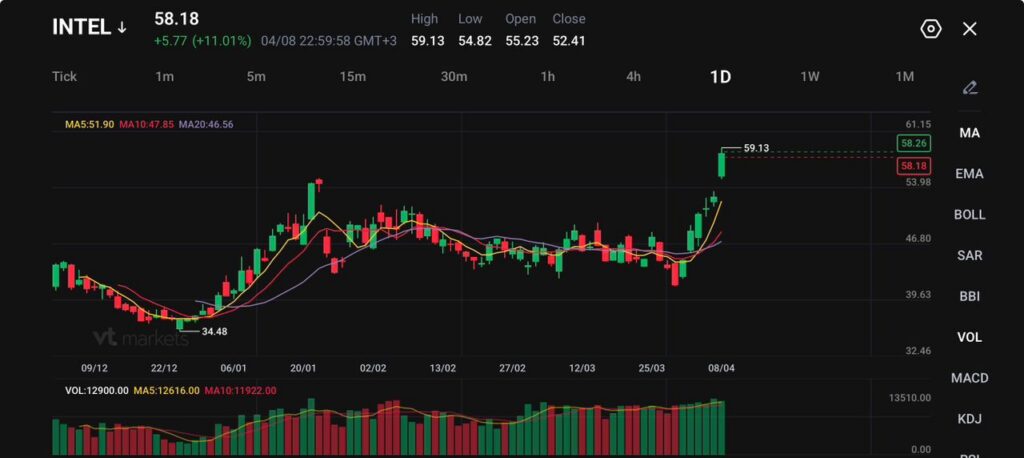
Intel rose 11% to 58.18, while AEHR jumped 26% and MRVL gained 5% as traders piled into semiconductor names.
Intel’s new inference platform with SambaNova Systems is targeted for the second half of 2026.
KeyBanc raised its Intel price target to $70 from $65 and kept an Overweight rating, citing stronger server CPU demand, pricing gains, and improving 18A yields.
Intel shares surged as traders rotated back into semiconductor stocks and looked for names with clearer AI infrastructure exposure. The stock climbed 11% to 58.18, hit an intraday high of 59.13, and closed well above the prior 52.41 close.
Intel shares jump 9% after buying back Ireland chip fab in sign of renewed strength https://t.co/qM5mviVPq4
That move came alongside a wider rally in chip stocks, with Aehr Test Systems up 26% and Marvell Technology up 5%.
The move was not just about sector momentum. Intel had fresh company-specific catalysts tied to AI compute, foundry progress, and silicon partnerships. That gave the rally more substance than a simple sympathy move.
A cautious read still applies here. A double-digit jump can pull in fast money quickly, but the market will now expect execution to match the new optimism.
SambaNova Deal Strengthens Intel’s AI Positioning
One of the key drivers was Intel’s partnership with SambaNova Systems. The companies introduced a heterogeneous inference architecture that combines GPUs, SambaNova’s reconfigurable dataflow units, and Intel’s Xeon 6 processors. The platform is expected to launch in the second half of 2026.
The partnership is key for Intel because the market has been asking where the company fits in the next wave of AI infrastructure. Xeon alone was not enough to win that argument. A broader inference stack gives Intel a more credible role in AI deployments where customers want mixed architectures rather than one-vendor systems.
The market is starting to treat Intel less like a lagging PC and server name and more like a company trying to rebuild relevance across the AI compute chain.
Terafab Adds Another Strategic Layer
Intel also gained support from its involvement with SpaceX, xAI, and Tesla around silicon fabrication technologies tied to Project Terafab. The proposed facility is designed to combine chip design, manufacturing, packaging, and testing into one AI-focused production pipeline.
Intel joins Musk's Terafab project as Tesla, SpaceX, and xAI push to produce their own chips. pic.twitter.com/K0YFrbCMEI
That project is still ambitious and still carries execution risk. Even so, it gives Intel another way to fit into the market’s biggest structural theme. Traders are willing to reward companies that can attach themselves to AI infrastructure early, especially when the story includes foundry capability and advanced packaging.
For Intel, that creates a more expansive narrative than a standard cyclical recovery in CPUs.
Analysts Are Turning More Positive
The rally also picked up speed after KeyBanc raised its Intel price target to $70 from $65 and kept an Overweight rating. The firm pointed to strong server CPU demand, pricing increases, and improving 18A yields as the Panther Lake ramp moves forward.
That combination hits the core areas traders care about most. Demand supports revenue. Pricing supports margins. Yield improvement supports credibility in Intel’s manufacturing recovery.
The market has spent months doubting whether Intel could close the gap in process execution. A better 18A story changes that conversation, even if it does not settle it yet.
Intel Technical Outlook
Intel (INTC) is trading near 58.18, surging sharply higher after a strong breakout from the recent consolidation range. Price action shows aggressive bullish momentum, with a large impulsive move pushing the stock up toward the 59.13 high. This rally marks a clear shift in sentiment, as buyers step in decisively following the period of sideways movement seen through March.
From a technical standpoint, the trend has turned firmly bullish. Price is trading well above all key moving averages, with the 5-day (51.90) leading sharply higher, followed by the 10-day (47.85) and 20-day (46.56), all sloping upward. This strong alignment reflects a powerful trend shift, with momentum accelerating as price breaks out from prior resistance levels.
Key levels to watch:
Support: 54.00 → 51.90 → 47.80
Resistance: 59.10 → 61.15 → 63.00
The immediate focus is on the 59.10 zone, which aligns with the recent high. A clean break above this level could open the path toward 61.15, with further upside potential if bullish momentum continues to build.
On the downside, 54.00 now acts as initial support, marking the breakout area. A pullback toward this level would likely be viewed as a retest, with buyers expected to defend it if the trend remains intact.
Overall, Intel is showing strong breakout momentum with clear bullish structure. As long as price holds above the 54.00 region, the bias remains to the upside, with the current move suggesting the potential for further continuation rather than a short-lived spike.
What Traders Should Watch Next
The next move depends on whether Intel can turn the new narrative into repeatable evidence. Traders will watch three things closely: updates on the SambaNova launch timeline in the second half of 2026, evidence that 18A yields continue to improve as Panther Lake ramps, and deeper detail on how Intel fits into the Terafab supply chain.
The stock has already re-rated on better expectations. The next stage will depend on execution, not just excitement.
Create a live VT Markets account today to access our platform features, including market insights and educational content.
Trader Questions
Why Did Intel Stock Jump More Than 11%?
Intel rose after investors responded to a stronger AI narrative, a new partnership with SambaNova Systems, growing excitement around Project Terafab, and a more bullish analyst target.
What Is Intel’s New AI Partnership With SambaNova?
Intel and SambaNova introduced a heterogeneous inference architecture combining GPUs, SambaNova’s reconfigurable dataflow units, and Intel’s Xeon 6 processors, with launch targeted for the second half of 2026.
Why Does The SambaNova Deal Matter For Intel?
It gives Intel a clearer role in AI inference infrastructure and helps position the company inside mixed-architecture AI deployments rather than just traditional CPU markets.
What Is Project Terafab And Why Is Intel Involved?
Project Terafab is a proposed AI-focused semiconductor facility tied to SpaceX, xAI, and Tesla, designed to combine chip design, manufacturing, packaging, and testing in one production pipeline. Intel’s involvement strengthens its AI and foundry story.
Why Did Analysts Raise Intel’s Price Target?
KeyBanc raised its target to $70 from $65 and kept an Overweight rating, citing strong server CPU demand, pricing increases, and improving 18A yields as Panther Lake ramps.
What Are 18A Yields And Why Do They Matter?
18A yields refer to how efficiently Intel can manufacture chips on its advanced process node. Better yields improve profitability, manufacturing credibility, and confidence in Intel’s foundry recovery.
How Is The Wider Chip Rally Helping Intel?
Strong moves in AEHR and MRVL show investors are buying across the AI semiconductor chain, not just a few leaders. That broader appetite makes it easier for Intel to rally as a second-wave AI infrastructure name.
Start trading now – Click here to create your real VT Markets account
Please note that the dividends of the following products will be adjusted accordingly. Index dividends will be executed separately through a balance statement directly to your trading account, and the comment will be in the following format “Div & Product Name & Net Volume”.
Please refer to the table below for more details:
The above data is for reference only, please refer to the MT4/MT5 software for specific data.
If you’d like more information, please don’t hesitate to contact info@vtmarkets.com.
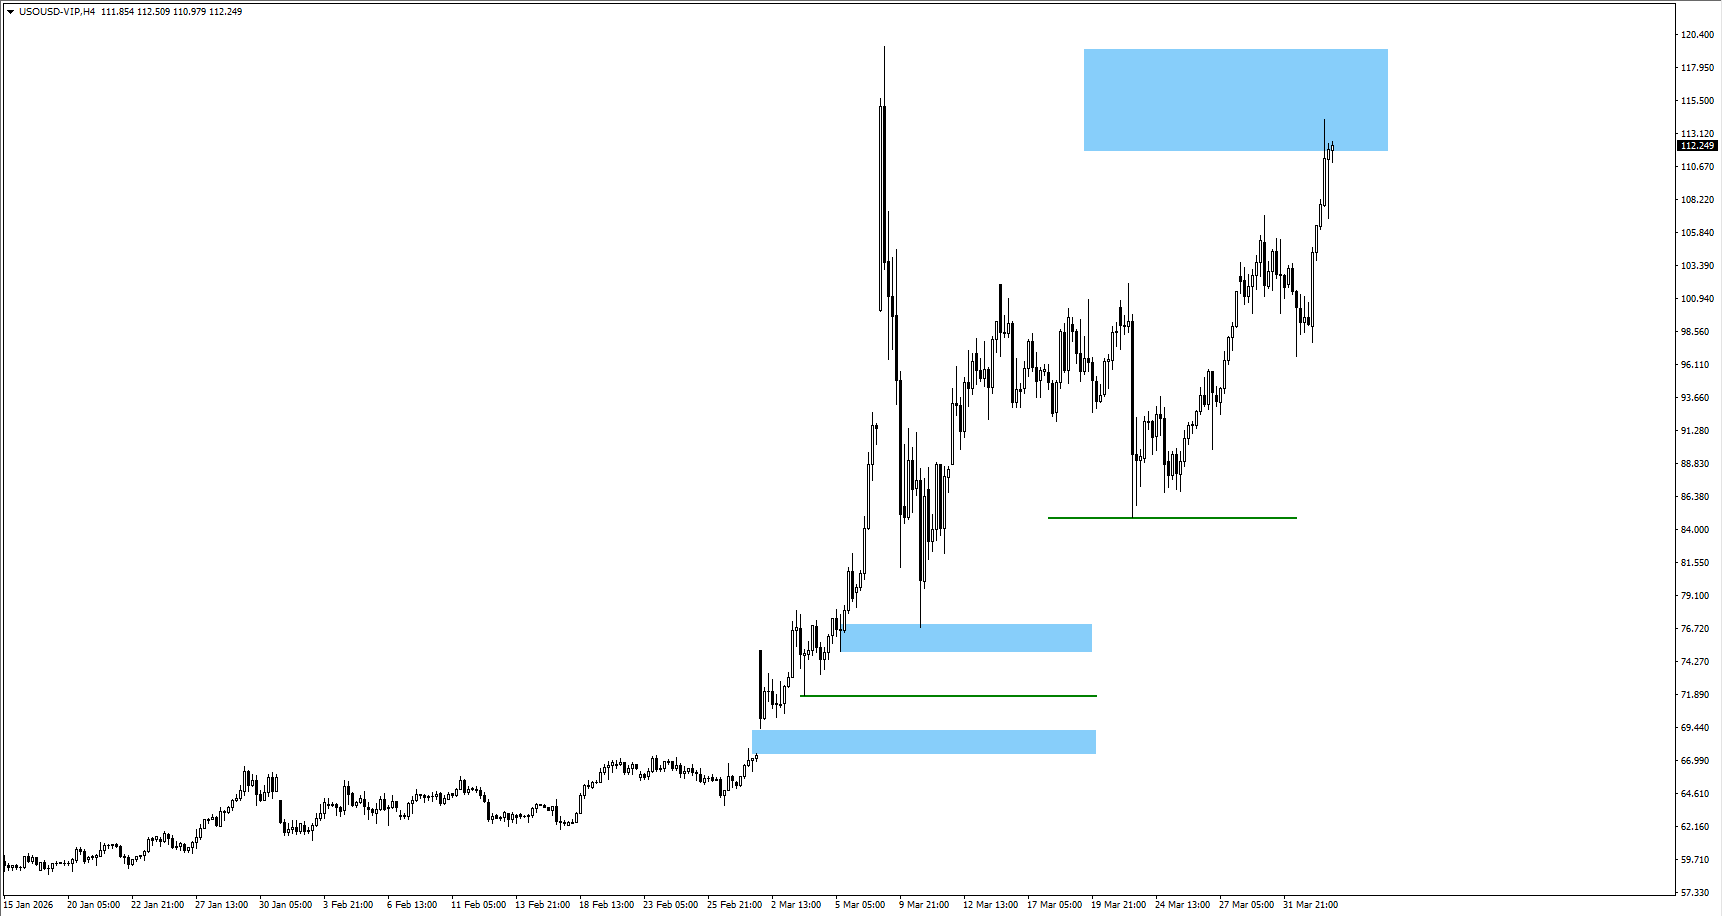
Crude remains the lead signal, Brent trades near $107 and WTI near $112 after an 11% weekly surge.
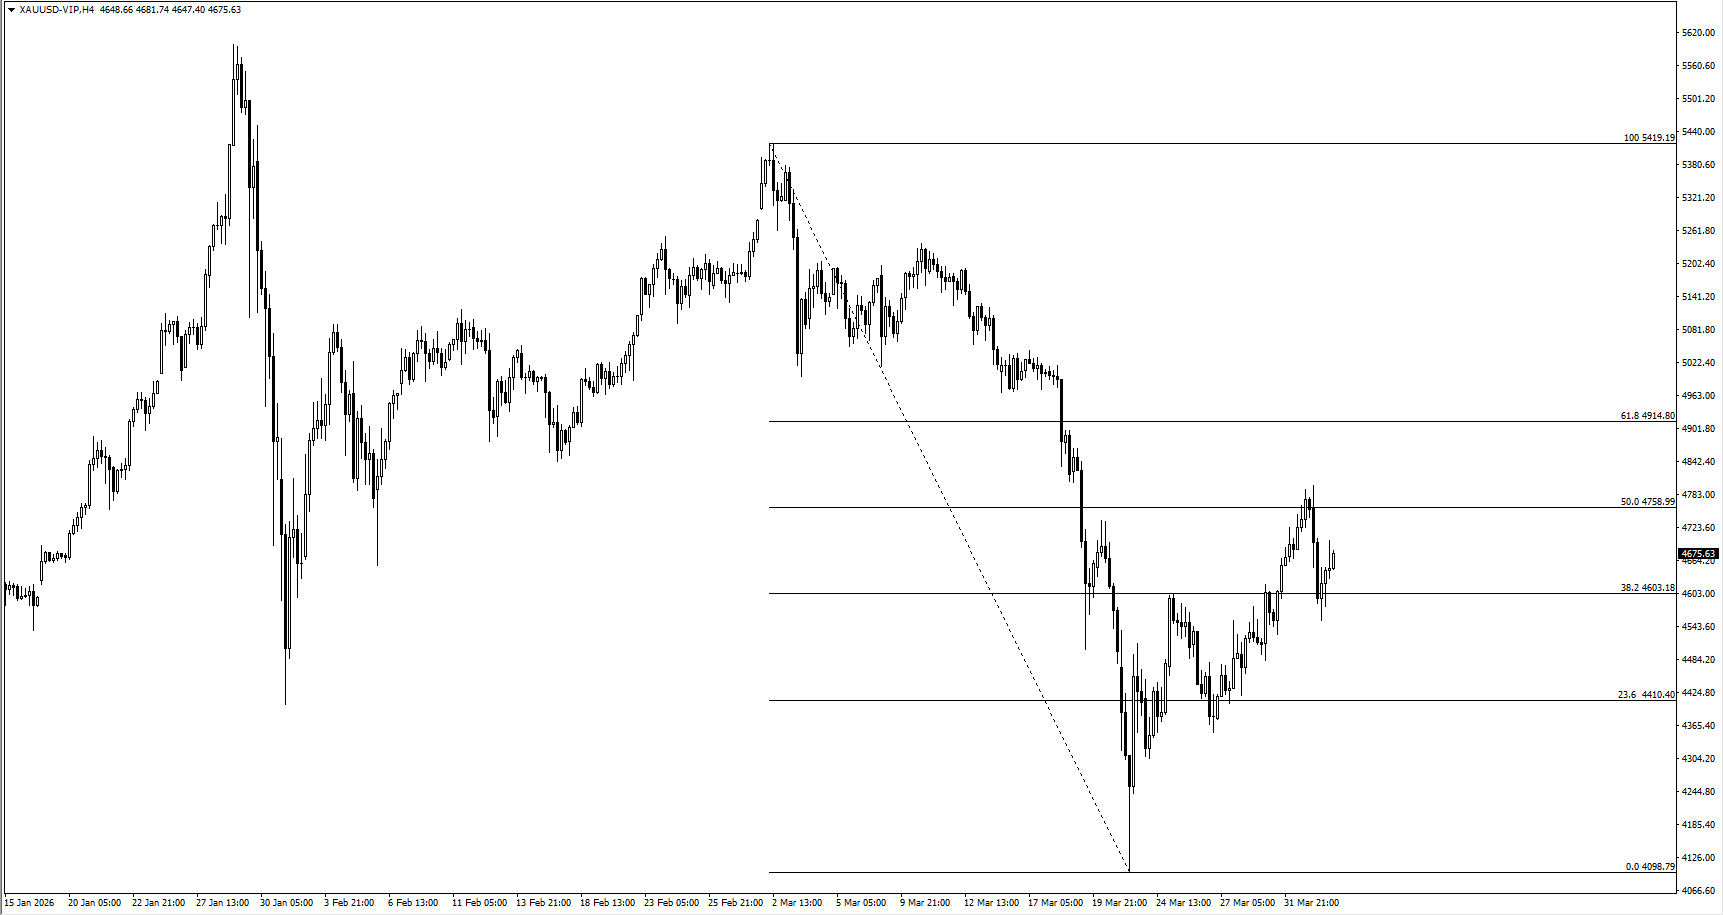
Tuesday 8pm ET Iran peace talks set the first directional move across USOil, USDX, SP500, XAUUSD and BTCUSD.
US Core PCE on Thursday and US CPI on Friday decide whether inflation fears harden into tighter rates pricing.
March NFP beat expectations at 178,000 versus 65,000, but revisions and household data still signal an uneven trend.
Markets are not treating this as a one-day headline spike. Traders keep pricing the Strait of Hormuz as the transmission channel for the entire macro story. Partial vessel passage does not equal a stable reopening of commercial energy flows, so the risk premium stays embedded in crude.
The clearest consequence shows up in the oil tape. Brent trades near $107 heading into the week, while WTI settled near $112 after a holiday-shortened week that delivered a gain of a little under 11%. The directional bias stays upward on any escalation headline, with the strike pause set to expire Tuesday evening ET and no ceasefire framework in place.
When oil stays elevated, traders stop reading the conflict as a standalone geopolitical story. The market begins to price second-order effects, higher transport costs, stickier inflation prints, and less room for policy relief.
Trump has made the timing harder for markets to dismiss. His latest comments tied the next phase of the conflict directly to the Strait of Hormuz, with a Tuesday evening deadline and the threat of fresh strikes on Iranian infrastructure if passage is not restored.
President Trump threatened to rain ‘hell’ on Tehran if it did not make a deal and reopen the Strait of Hormuz by his April 7 deadline, as he praised US special forces who rescued an airman in a high-risk mission from deep inside Iran https://t.co/1D0whPbsMRpic.twitter.com/sCCcAEcDBj
At the same time, he kept the door open to a deal. That mix of pressure and conditional diplomacy helps explain why traders are reluctant to fade the oil premium too quickly. Every hint of negotiation offers temporary relief, but each harder line pulls crude, the dollar and broader risk sentiment back toward defence.
Markets recoiled as war jitters over Iran deepened, with stocks sliding, oil surging well over $100 per barrel and the dollar firming after US President Trump dashed hopes for clarity on when the Middle East conflict might end https://t.co/O6kuzQd3d4pic.twitter.com/jkY8zyPZ8K
That also sharpens the sequence for the rest of the week. The focus is no longer just the war in broad terms, but whether the Strait itself becomes the trigger for the next move. If the rhetoric cools and diplomacy gains traction, crude can unwind and risk assets can stabilise.
If the deadline passes with the same aggressive tone, the market is more likely to treat elevated oil as a lasting inflation problem rather than a short-lived geopolitical spike. That keeps pressure on equities, supports USDX, and gives Core PCE and CPI even more weight than usual.
A Jobs Beat That Calms Growth Fear, but Tightens the Policy Setup
March nonfarm payrolls printed at 178,000 versus a 65,000 median expectation. January was revised up to 160,000, while February was revised down to negative 133,000. The headline looks strong, but the internal picture looks mixed. Combined revisions read uneven rather than accelerating.
Household data adds friction. The labour force fell, and total employment declined, while unemployment dipped slightly. Wage growth continued, but slowed, and the average workweek slipped, a pattern often seen before layoffs rise.
This setup shifts the macro balance. Payroll growth remains positive, and unemployment remains low, so the imminent labour-driven recession risk falls. At the same time, an energy shock raises inflation risk and complicates any near-term easing narrative.
Tuesday’s 8 pm ET Deadline is the First Gate for Risk
Tuesday’s Iran peace talks at 8pm ET act as the first event that can reset the week’s tone. Four broad paths sit in front of markets:
De-escalation and improved Hormuz signals can drive crude sharply lower and lift equity futures.
A status quo open allows a brief relief bid off the NFP headline, while energy stays elevated.
Escalation into the deadline can push crude higher again and pressure risk assets, particularly rate-sensitive and consumer areas.
A nervous, weaker open can develop even without new escalation as traders fade risk into the deadline.
This week does not begin with CPI. It begins with whether the oil premium expands or contracts.
Read more about Trump and how his statements have been affecting market movements here.
Core PCE and CPI Decide Whether the Oil Shock Spreads
Thursday brings US Core PCE Price Index m/m at 0.4% forecast versus 0.4% previous, alongside final GDP q/q at 0.7% forecast versus 0.7% previous. Friday follows with US CPI y/y at 3.4% forecast versus 2.4% previous.
Inflation data sits in a different context when crude stays bid. A firm print can harden rates pricing and keep the dollar supported. A softer print can open the door for risk assets to stabilise, but that relief tends to fade if oil remains elevated.
Cross-Asset Read Heading Into the Week
The dollar stays the cleanest read on defensive positioning when the market prices conflict risk and higher-for-longer policy bias. Gold stays pulled between safe-haven demand and a firmer dollar backdrop. Equities attempt to rebound, but oil and inflation risk keep pressure on the follow-through. Crypto behaves like risk, with the next impulse tied to whether the week opens with relief or stress.
Key Symbols to Watch
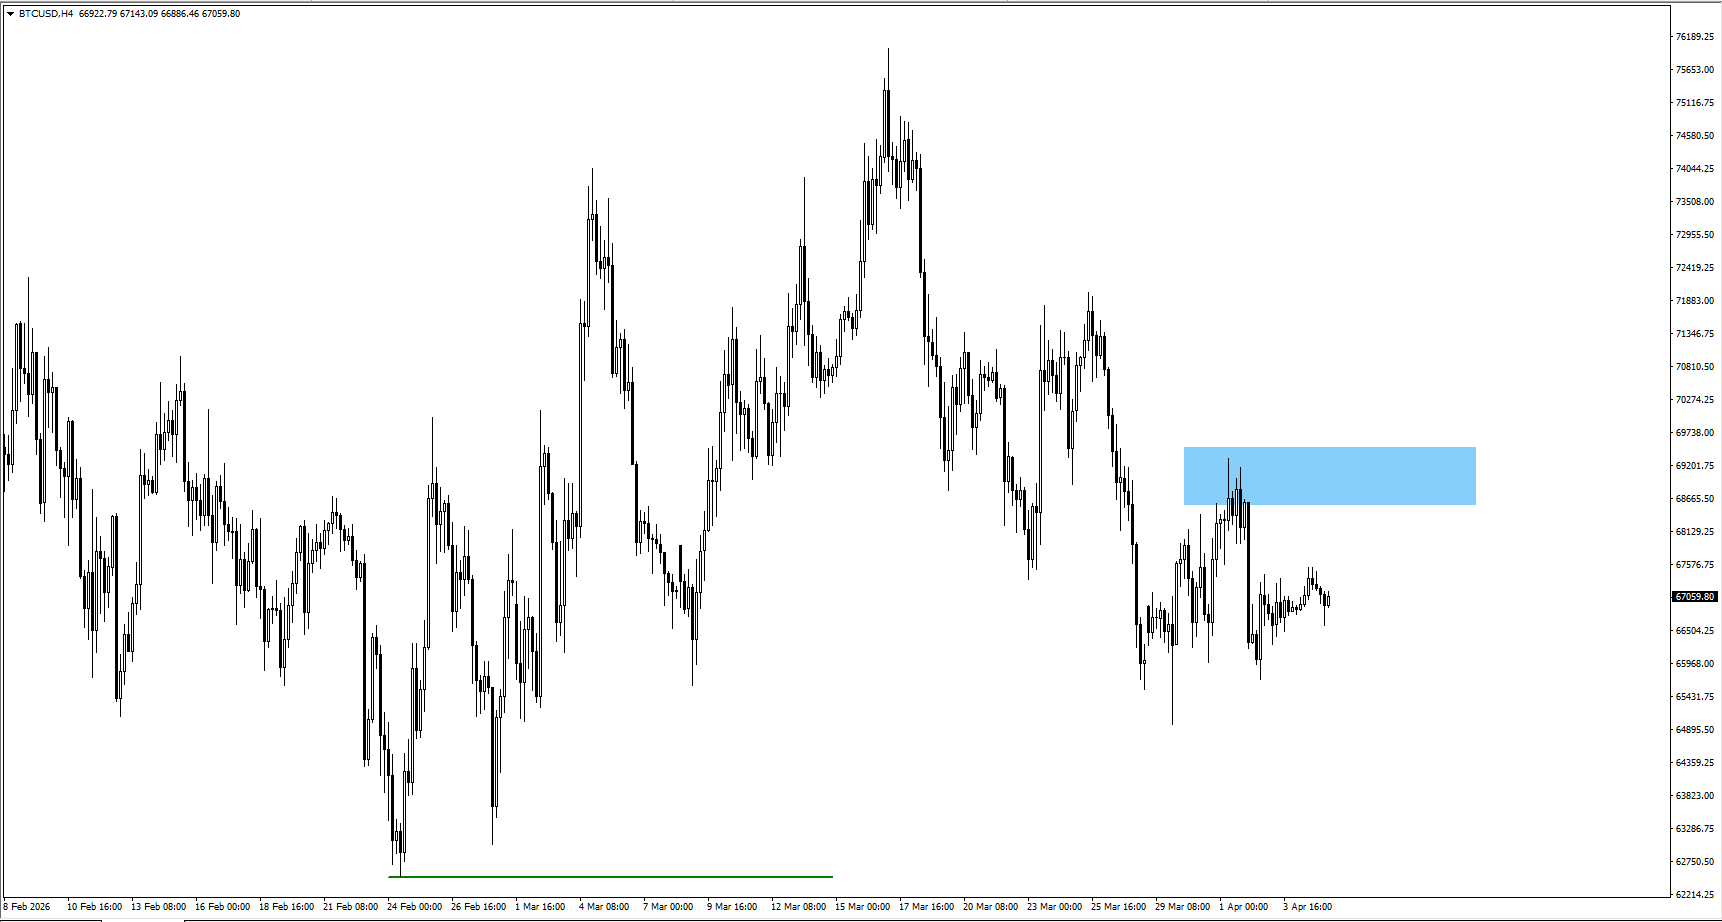
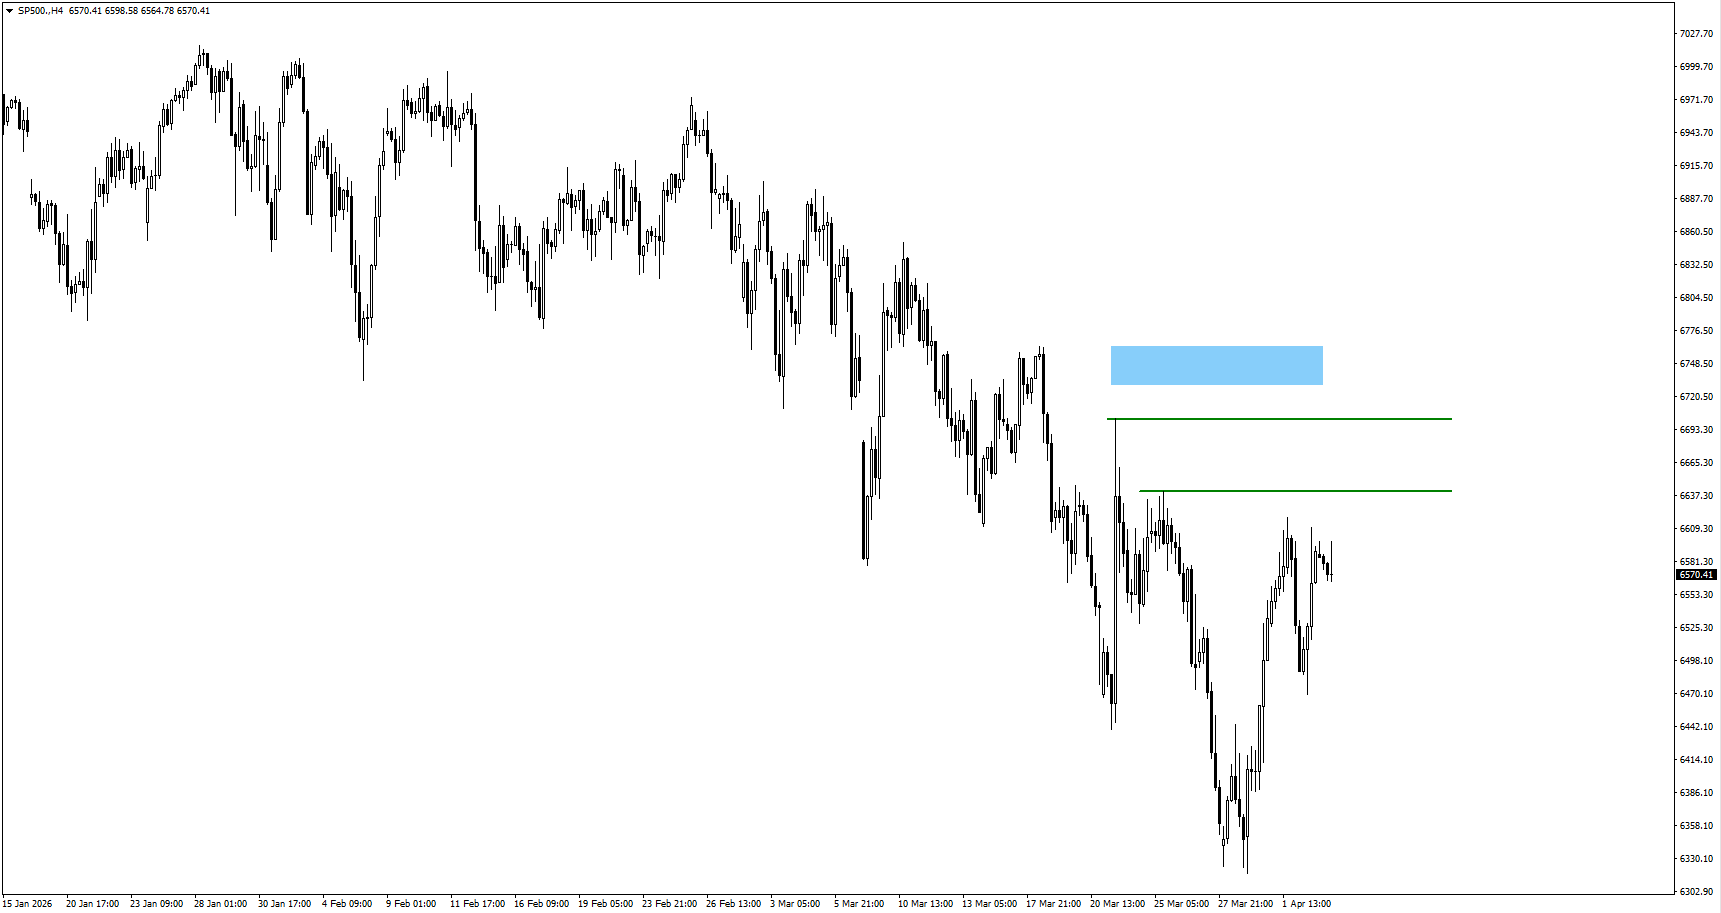
USDX | USOil | XAUUSD | SP500 | BTCUSD
Key Events of the Week
Date
Currency
Event
Forecast
Previous
Analyst Remarks
07 Apr
USD
Result of Iran Peace Talks (8pm EST)
N/A
N/A
Oil reaction sets the week’s tone for USDX and risk.
08 Apr
NZD
Official Cash Rate
2.25%
2.25%
Watch guidance for NZD volatility, not the hold itself.
09 Apr
USD
Core PCE Price Index m/m
0.40%
0.40%
A firm print supports USDX and keeps rates sticky.
09 Apr
USD
Final GDP q/q
0.70%
0.70%
Confirms the growth pulse entering the oil shock.
10 Apr
USD
CPI y/y
3.40%
2.40%
Hot CPI can harden the higher-for-longer tone quickly.
For a full view of upcoming economic events, check out VT Markets’ Economic Calendar.
Key Movements Of The Week
USDX
Price holds firm as traders price the Tuesday 8pm EST deadline into rates expectations.
Thursday’s Core PCE is the first inflation checkpoint before CPI resets the week.
A calmer oil tape after peace talks would be the clearest way to soften the bid.
USOil
Price stays elevated with supply fears tied to Hormuz and the Tuesday deadline.
A de-escalation headline can trigger a fast retracement, but it needs follow-through.
If crude holds above $110 into CPI, inflation risk stays live across assets.
XAUUSD
Gold softened as USD strength and yields reduced rate-cut hopes.
Tuesday headlines matter because oil drives the inflation hedge impulse.
CPI can quickly change demand if it validates broader inflation pressure.
BTCUSD
BTCUSD remains headline-sensitive as macro risk swings liquidity appetite.
A softer inflation tone after CPI would be a tailwind if oil also eases.
A renewed oil spike tends to tighten conditions and pressure risk exposure.
SP500
Rebound attempts face a simple ceiling while crude stays high and CPI looms.
A relief path starts with oil cooling after Tuesday’s peace talk outcome.
Hot CPI can revive the higher-for-longer trade and cap equity follow-through.
Bottom Line
This week still runs through the same sequence: oil first, then inflation, then rates. Tuesday’s 8pm EST Iran peace talks are the first real trigger because they can unwind or extend the crude risk premium that is driving the broader cross-asset tone.
If oil stays elevated into Thursday’s Core PCE and Friday’s CPI, markets will find it harder to price a clean easing path, which keeps USDX supported and caps confidence in SP500 and higher-beta risk.
If headlines cool and inflation data comes in calmer than feared, the market gets room to pivot toward relief, but the burden of proof sits with crude and the inflation prints.
Create a live VT Markets account today to access our platform features, including market insights and educational content.
Trader Questions
What Is The Market Actually Pricing Around The Iran Peace Talks?
Markets are pricing the risk premium in crude first. If the talks reduce supply anxiety, USOil can retrace and SP500 can breathe. If they fail, elevated oil keeps inflation expectations firm and supports USDX.
Why Do Core PCE And CPI Matter More When Oil Is High?
Higher oil feeds headline inflation quickly and can spill into inflation expectations. Core PCE helps show whether underlying price pressure is cooling or staying sticky. If both Core PCE and CPI run firm, traders tend to push back rate-cut bets and keep the dollar bid.
How Can Traders Read The Cross-Asset Signal Without Overthinking It?
Start with USOil, then check USDX, then SP500. If oil stays high and USDX stays firm, conditions are still defensive and risk rallies struggle to follow through. If oil cools and USDX softens, SP500 and BTCUSD usually get cleaner upside air.
What Are The Key Levels Traders Usually Watch This Week?
Traders will keep an eye on whether BTCUSD can accept above 71,000, whether USDX can hold around the 100 area, and whether USOil can stay supported near 112. XAUUSD tends to react most sharply after CPI when the market reprices inflation and rates.
The Strait of Hormuz disruption is driving oil, forex and crypto markets at the same time.
Higher energy prices support the US dollar and pressure energy-importing currencies.
Crypto acts like a risk asset in the short term but still functions as a real-time financial system.
The real driver is not the price but how long the disruption lasts.
Why the Strait of Hormuz is the Defining Macro Story of 2026
There is a narrow strip of water, roughly 21 miles wide, sitting between Iran and Oman that is currently exerting more influence on currency markets and crypto prices than any central bank decision or earnings report.
The Strait of Hormuz has become the defining macro story of early 2026. Traders in forex and crypto who have not fully mapped its implications are operating with a serious blind spot.
Beginning on March 4, Iranian forces declared the Strait closed, threatening and in some cases attacking vessels attempting to transit it. What followed was not just an oil story. It became a cascading shock across every major asset class, with second-order effects that are still unfolding and far from fully priced.
Iran and Israel traded attacks as Tehran defiantly refused to reopen the Strait of Hormuz and accept a ceasefire deal on the eve of a deadline set by President Trump to agree to his demands or get ‘taken out’ https://t.co/jPmnzK5LX5pic.twitter.com/xNHAAi2HyY
How the Strait of Hormuz Closure Impacts Global Energy and Forex Markets
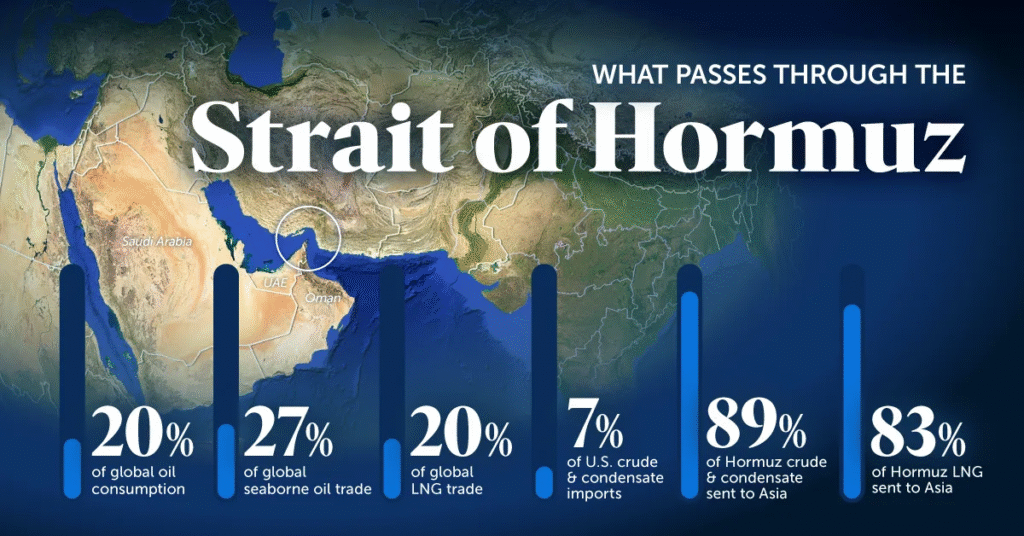
The Strait of Hormuz handles roughly 20% of global oil consumption, alongside a significant share of liquefied natural gas flows, particularly from Qatar. Any disruption here does not gently move markets. It forces a repricing.
Source: Visual Capitalist
During the recent escalation, Brent crude moved above 100 dollars per barrel for the first time in four years, peaking near 120. While exact intraday highs vary across contracts, the direction is what matters. A sharp and aggressive repricing of energy.
The Strait of Hormuz's closure and the resulting surge in global oil prices have handed financial windfalls to Iran, Oman and Saudi Arabia, while other states that lack alternative shipment routes have lost billions of dollars, a Reuters analysis found https://t.co/a8wAyrMrjS
How does the Strait of Hormuz closure impact the USD?
The impact across currencies follows a consistent structure.
The United States sits in a relatively advantaged position. As one of the world’s largest energy producers and a major LNG exporter, it benefits on a relative basis when prices rise. Higher oil supports the dollar through improved terms of trade and safe-haven demand. At the same time, elevated energy prices complicate the Federal Reserve’s path to rate cuts, reinforcing dollar strength.
The euro area faces a structural vulnerability. Heavy reliance on imported energy means rising oil and gas prices push inflation higher while pulling growth lower. This creates a stagflationary setup. The European Central Bank is left constrained and unable to ease aggressively without risking persistent inflation. The result is sustained pressure on EURUSD.
Japan and broader Asia face a similar dynamic. Economies such as Japan, South Korea, India and China remain heavily dependent on imported energy, much of it historically routed through the Gulf. When shipping risks rise and prices spike, trade balances deteriorate. This translates into depreciation pressure on currencies like JPY, KRW and INR, unless offset by policy intervention.
— Reuters Energy and Commodities (@ReutersCommods) April 7, 2026
There is also the Russia factor. Disruptions in Middle Eastern supply increase the relative importance of alternative producers. Russia’s discounted crude becomes more attractive to major importers such as India and China, supporting export revenues and indirectly stabilising trade-linked currency flows.
The takeaway is straightforward but often underestimated.
Energy is not just a commodity variable. It is a primary driver of currency markets.
Forex Chain Reaction: Impact of Strait of Hormuz Disruption
Currency
Market Position
Impact of Disruption
Economic Drivers
US Dollar (USD)
Strong / Bullish
Benefits on a relative basis as a safe haven.
US is a major energy producer/LNG exporter; high oil prices complicate Fed rate cuts.
Euro (EUR)
Weak / Bearish
Faces sustained pressure and a stagflationary setup.
Heavy reliance on imported energy; rising costs push inflation up while pulling growth down.
Japanese Yen (JPY)
Weak / Bearish
Significant depreciation pressure.
Heavily dependent on imported energy historically routed through the Gulf.
Indian Rupee (INR)
Weak / Bearish
Trade balances deteriorate, leading to currency weakness.
High dependency on Middle Eastern energy imports.
South Korean Won (KRW)
Weak / Bearish
Vulnerable to shipping risks and price spikes.
Heavy reliance on energy imports to sustain the economy.
Russian Ruble (RUB)
Stabilising
Increased importance of alternative supply.
Discounted crude becomes more attractive to major importers like China and India.
Is Bitcoin a Hedge or a Risk Asset? The Impact of Geopolitical Shocks on Crypto
Geopolitical shocks reveal what markets truly are, not what narratives suggest they should be.
In the immediate aftermath of major headlines, Bitcoin and the broader crypto market typically sell off. Liquidity tightens, volatility rises, and risk appetite fades. In these moments, crypto behaves less like a hedge and more like a high beta risk asset, closer to technology equities than digital gold.
But that is only half the story.
Crypto markets operate continuously. They do not close or pause. When geopolitical developments occur outside traditional trading hours, crypto becomes one of the only venues for real-time price discovery. This gives it a structural role that traditional markets cannot replicate.
During periods of heightened tension, trading volumes across major crypto exchanges tend to increase as participants react instantly to new information. This is observable behaviour embedded in market microstructure.
There is also a growing real economy dimension. In regions facing sanctions, capital controls or restricted access to banking infrastructure, crypto usage increases. It becomes not just a speculative asset but a functional alternative for settlement and value transfer.
Perhaps most tellingly, reports have emerged of vessels paying transit-related fees in Chinese yuan or even crypto to navigate the Strait under heightened risk conditions. These cases are still marginal, but they signal something more important. When traditional financial rails are disrupted, alternative systems are not just theoretical. They are used.
Crypto in this context carries a dual identity.
In the short term, it behaves like a risky asset.
In the longer term, it continues to evolve as a parallel financial system.
The Structural Tailwinds Beneath the Noise
Despite volatility, the broader trajectory for crypto remains intact.
Institutional participation continues to expand through Bitcoin exchange-traded funds (ETFs). Regulatory frameworks in the United States are gradually taking shape, with developments such as the CLARITY Act pointing toward a more defined operating environment. Meanwhile, stablecoins are quietly embedding themselves into the global financial system.
The scale is already significant.
In 2025, stablecoin transaction volumes exceeded 34 trillion dollars, surpassing the combined volumes of Visa and Mastercard. That figure carries more weight when viewed alongside real-world scenarios where digital assets are being used in high-friction geopolitical environments.
The underlying infrastructure is not slowing down, even when markets are.
Market Outlook: What Happens if the Strait of Hormuz Remains Closed?
Energy shocks do not hit markets in a single wave. They evolve.
At the outset, the reaction is driven by uncertainty and risk repricing. If disruptions persist, the impact becomes tangible. Shipping delays accumulate, inventories tighten, and volatility becomes sustained rather than temporary.
For traders, positioning becomes less about prediction and more about understanding the path forward.
If the situation stabilises and the Strait reopens, oil prices are likely to retrace from elevated levels. Inflation pressures ease, central banks regain flexibility, and risk assets, including equities and crypto, find support. Energy-importing currencies recover as external pressures fade.
If the disruption persists, the opposite dynamic takes hold. Elevated energy prices keep inflation stubborn, forcing central banks to maintain tighter policy for longer. Growth slows, the US dollar remains firm, and currencies tied to energy imports stay under pressure. In this environment, crypto becomes increasingly sensitive to liquidity conditions rather than acting as a defensive asset.
The market is not pricing where oil is today.
It is pricing how long this disruption will last and how deep its effects will run.
The Big Questions
1) How does the Strait of Hormuz closure impact global oil prices?
The Strait of Hormuz handles approximately 20% of global oil consumption and a significant share of liquefied natural gas (LNG). Any disruption forces aggressive repricing; during the March 2026 escalation, Brent crude spiked above 100 dollars per barrel, peaking near 120 dollars.
2) Why does the US Dollar (USD) strengthen during Middle East energy shocks?
The United States is one of the world’s largest energy producers and a major LNG exporter, which improves its terms of trade when prices rise. Additionally, elevated energy prices fuel inflation, making it harder for the Federal Reserve to cut interest rates, which further reinforces dollar strength.
3) How does the Hormuz disruption affect the Euro (EUR) and Japanese Yen (JPY)?
Both the Eurozone and Japan are heavily dependent on imported energy. Rising oil and gas prices create a stagflationary environment for the Euro—pushing inflation higher while pulling growth lower—and cause trade balances in Asia to deteriorate, leading to sustained depreciation pressure on the EUR, JPY, KRW, and INR.
4) Is Bitcoin a safe haven during geopolitical conflicts?
In the short term, Bitcoin typically behaves like a high-beta risk asset, similar to technology equities, often selling off when liquidity tightens and risk appetite fades. However, it functions as a parallel financial system in the long term, offering real-time price discovery and an alternative for settlement in regions with restricted banking access.
5) What is the role of stablecoins in global finance during disruptions?
Stablecoins are becoming a fundamental part of the global financial system, with 2025 transaction volumes exceeding 34 trillion dollars—surpassing the combined volumes of Visa and Mastercard. They provide critical infrastructure for value transfer in high-friction geopolitical environments where traditional rails are disrupted.
6) What happens to markets if the Strait of Hormuz reopens?
If the situation stabilises, oil prices are expected to retrace, inflation pressures would ease, and central banks would regain policy flexibility. This would likely lead to a recovery in risk assets, including equities and crypto, as well as energy-importing currencies.
Start trading now – Click here to create your real VT Markets account
Written on April 7, 2026 at 10:38 pm, by josephine
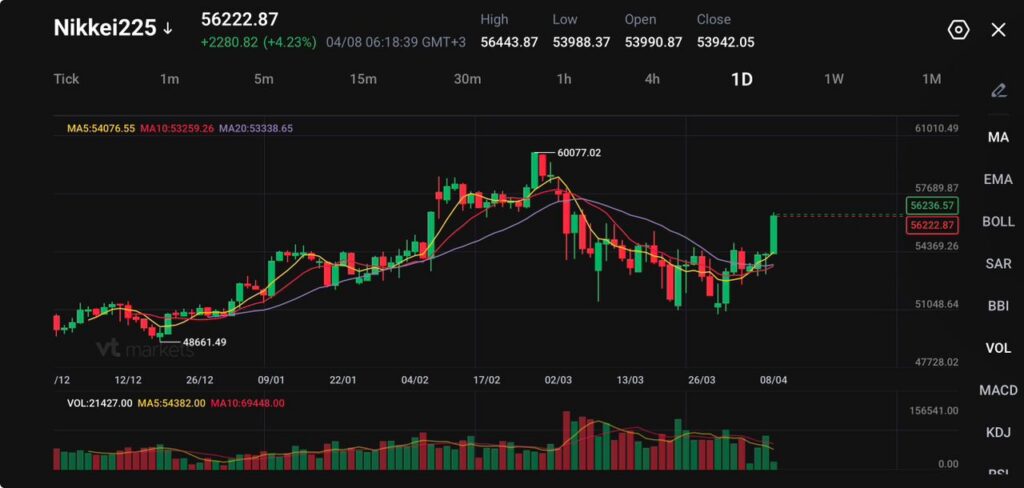
Nikkei 225 rose 4.96% to 56,078.83 in the morning session, while the broader move in the chart shows 56,222.87, up 2,280.82 (+4.23%).
A two-week ceasefire and a temporary reopening of the Strait of Hormuz triggered a relief rally across Asia and knocked back crude prices.
Japan posted a current account surplus of 3.933 trillion yen in February, above the 3.549 trillion yen forecast, with exports up 2.8% and imports up 9.7%.
Japanese equities jumped as traders rushed back into risk after the ceasefire announcement cut the immediate threat to Gulf energy flows. The Nikkei 225 rose 4.96% to 56,078.83 in the morning session, and the broader chart reading at 56,222.87 shows the strength of the rebound.
The move followed a sharp drop in crude after the United States and Iran agreed to a two-week ceasefire tied to safe passage through the Strait of Hormuz.
Lower oil is a direct tailwind for Japan. The country imports most of its energy, so a fall in crude reduces pressure on margins, cools imported inflation, and eases the drag on household spending. That shift supported a broad rally rather than a narrow bounce.
A cautious near-term view still favours follow-through while crude stays off the highs, though the market will keep treating the ceasefire as temporary until shipping flows normalise more clearly.
Exporters, Banks, and Chip Stocks Lead the Charge
The rebound spread across nearly every major cyclical group. Exporters rose as the drop in oil improved the macro backdrop. Financials moved higher as lower energy stress reduced immediate stagflation fears. Chip names and index heavyweights led the sharpest gains as traders rotated back into growth after last week’s risk-off trade.
In the session snapshot, SoftBank Group rose more than 6%, Fast Retailing gained almost 5%, Toyota climbed almost 4%, and Honda added more than 2%.
In technology, Advantest jumped more than 10%, Screen Holdings surged almost 8%, and Tokyo Electron advanced almost 9%. Banks also joined the move, with Sumitomo Mitsui Financial and Mizuho Financial up more than 4%, while Mitsubishi UFJ Financial gained almost 3%.
The laggards made sense too. Energy names slipped because the crude rally broke lower. Inpex fell more than 5%, while shipping stocks such as Mitsui O.S.K. Lines, Kawasaki Kisen Kaisha, and Nippon Yusen moved lower as the oil risk premium started to unwind.
With the Nikkei’s performance increasingly tied to global tech flows, traders may consider tracking key AI and semiconductor stocks available across our CFD Shares offering.
Wall Street Gave the Rally a Solid Base
The overnight lead from the United States also helped. The Nasdaq rose 0.1% to 22,017.85, the S&P 500 edged up 0.1% to 6,616.85, and the Dow slipped 0.2% to 46,584.46. That was not a runaway rally, but it was enough to keep the tone constructive going into the Asian session.
The bigger catalyst still came from the ceasefire and the drop in oil, but the US close removed one more obstacle to aggressive dip-buying.
US stocks ended mixed amid signs of progress in negotiations as the minutes ticked down to President Trump's deadline for Iran to open the Strait of Hormuz https://t.co/fZemHx9vEVpic.twitter.com/GxQ1ObQB2B
Across Asia, the move was broad. South Korea and Taiwan surged, while Hong Kong, China, Australia, and New Zealand all traded higher. That regional strength confirmed that traders were buying the same macro theme everywhere: lower oil, lower inflation pressure, and a temporary break in the war premium.
Nikkei 225 Technical Outlook
The Nikkei 225 is trading near 56,223, staging a sharp rebound after the recent pullback that followed the rejection from the 60,077 high.
Price action shows strong bullish momentum returning, with a wide bullish candle breaking out from the recent consolidation range and pushing back above key moving averages.
This move suggests buyers are stepping back in aggressively after the correction phase seen through March.
From a technical standpoint, the structure is shifting back toward bullish. Price has reclaimed the 5-day (54,076) and 10-day (53,259) moving averages, both of which are now turning higher and providing immediate support.
The 20-day (53,338) is also flattening and beginning to slope upward, indicating that downside pressure is fading and momentum is rebuilding. The recent push higher signals a potential trend continuation if price can sustain above current levels.
Key levels to watch:
Support: 54,300 → 53,300 → 51,000
Resistance: 56,300 → 57,700 → 60,000
The immediate focus is on the 56,300 zone, which price is currently testing as resistance. A sustained break above this level could open the path toward 57,700, with a broader move potentially retesting the 60,000 region if momentum continues to build.
On the downside, 54,300 now acts as first support, aligning with the recent breakout area. A break below this level could signal a loss of short-term momentum and lead to a pullback toward 53,300, though such a move would likely remain corrective within the improving structure.
Overall, the Nikkei is showing strong recovery momentum after its recent dip, with buyers regaining control in the short term. If price can hold above the 54,000–54,300 region, the bias shifts back toward upside continuation, with the market potentially building toward another test of prior highs.
What Traders Should Watch Next
The next move depends on whether the ceasefire turns into stable energy flows rather than another short pause. Lower crude has done most of the heavy lifting so far.
If Hormuz traffic stays open enough to keep oil under control, the Nikkei can keep rebuilding toward the upper 50,000s. If the truce frays and crude reverses higher, the same sectors driving today’s rally could give back ground quickly.
The rally came after a two-week ceasefire and a temporary reopening of the Strait of Hormuz reduced immediate energy-supply fears. Lower oil prices improved the outlook for Japan, which imports most of its energy, and that helped trigger a broad risk-on move across the region.
Why Does Falling Oil Help Japanese Stocks So Much?
Lower crude prices reduce imported energy costs, ease inflation pressure, and improve the outlook for household spending and corporate margins. That tends to support the Nikkei more than many other major indices because Japan is highly exposed to external energy prices.
Why Did Exporters, Chip Stocks, and Banks Lead the Rally?
Exporters benefited from an improving macro backdrop, chip stocks tracked stronger risk appetite and growth expectations, and banks gained as the market moved away from the worst stagflation fears. The move was broad enough to lift most cyclical sectors together rather than just one narrow theme.
Why Did Energy Stocks Lag the Nikkei?
Energy names weakened because the same drop in oil that helped the broader index reduce earnings support for producers and oil-linked shares. That is why stocks such as Inpex moved the other way while the rest of the market rallied.
What Did the Current Account Data Add to the Story?
Japan posted a 3.933 trillion yen current account surplus in February, above the 3.549 trillion yen forecast. Exports rose 2.8%, imports rose 9.7%, and the trade balance showed a 267.6 billion yen surplus. That data added to the sense that Japan’s external position was holding up better than feared.
Start trading now – Click here to create your real VT Markets account
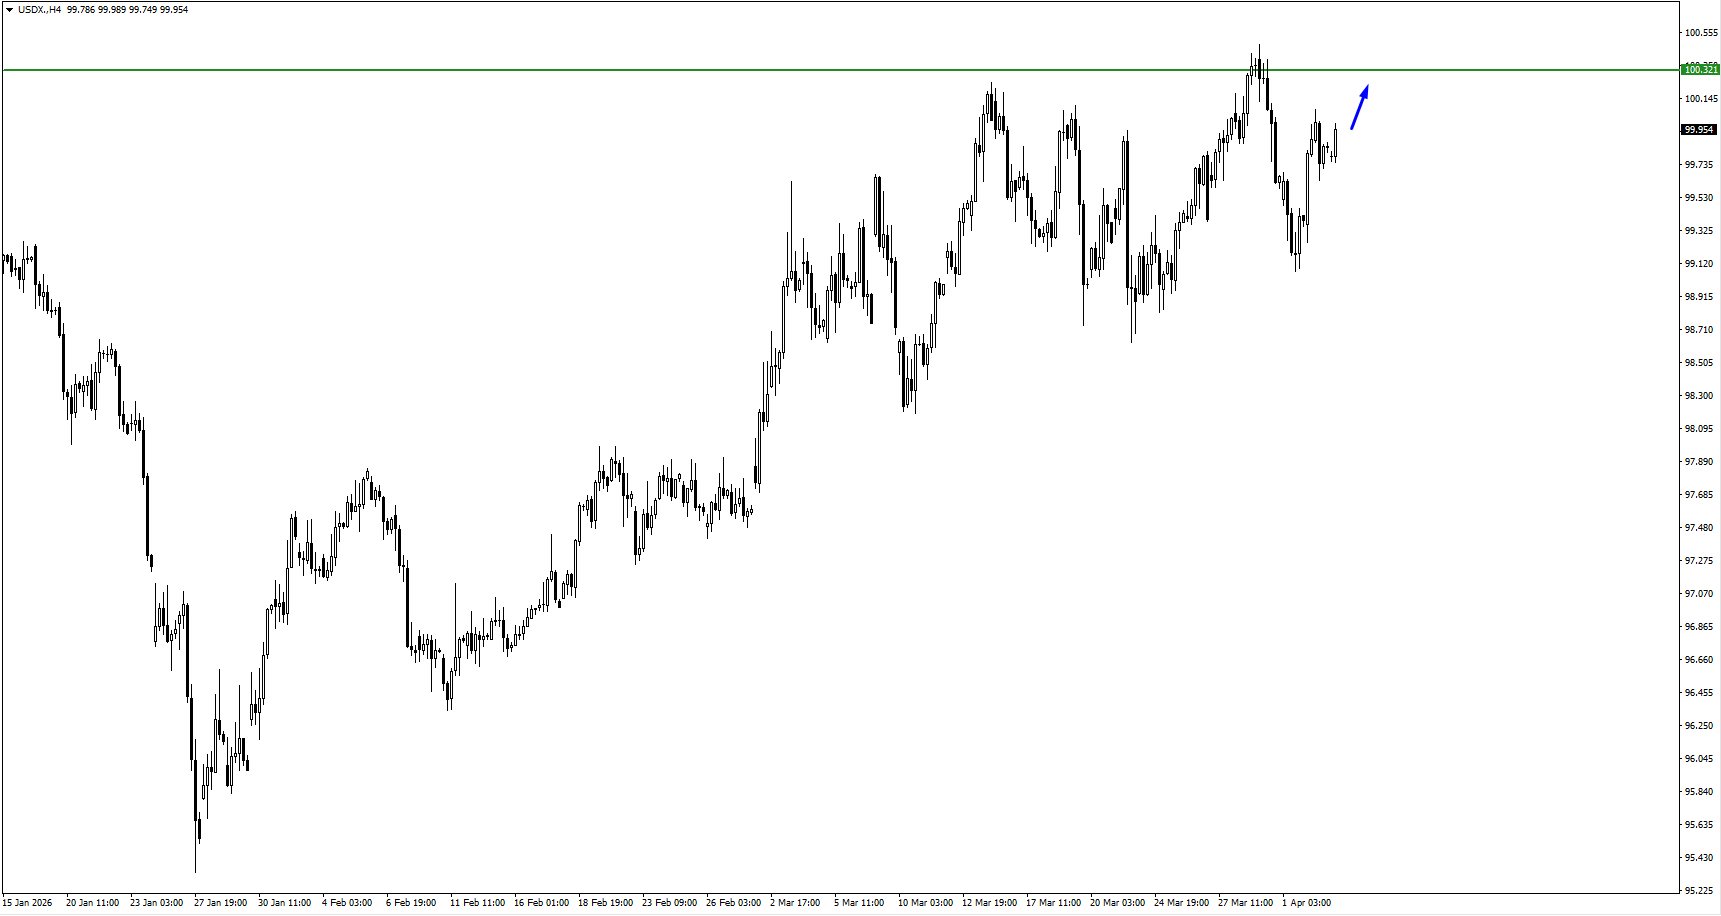
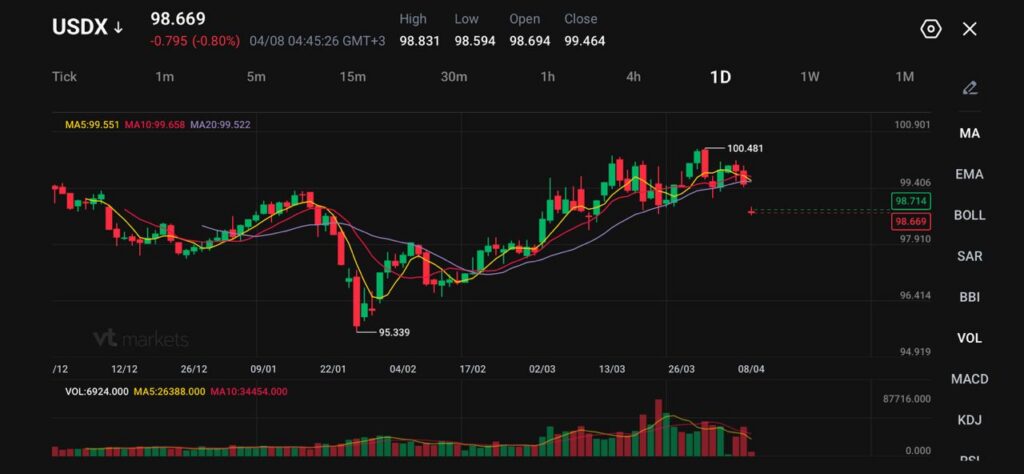
USDX trades at 98.669, down 0.795 (-0.80%), after slipping toward a four-week low around the 99 area.
The market reacted after Trump delayed his threat to strike Iranian civilian infrastructure by two weeks and described the move as a “double-sided ceasefire” tied to reopening the Strait of Hormuz.
Inflation risk has not disappeared. One-year US inflation expectations rose to 3.4% in March from 3.0% in February, while expected gasoline-price growth jumped to 9.4%.
The dollar lost ground after the market got the one thing it had been missing for weeks: a delay in escalation. The move toward a two-week ceasefire reduced the urgency of defensive positioning and pushed the dollar lower against major peers.
Donald Trump’s announcement of a two-week ceasefire between the US and Iran brings welcome relief to Asian markets, according to strategists. Equities should see strong rallies across the region in the near term, they say. https://t.co/QHkyLu87kG
The US Dollar Index (USDX) fell toward 99, and the decline made sense because the previous rally had been built on war risk, oil disruption, and higher-for-long Fed pricing. Once the market paused, part of that premium came out.
The shift has improved risk sentiment, but it has not removed uncertainty. Missile threats, shipping risks, and doubts over whether the truce can hold are still sitting underneath the market. That leaves the dollar weaker than it was, but not decisively broken.
Hormuz Relief Helps the Dollar Fall, but Only to a Point
The market is reacting less to rhetoric and more to flow risk. The Strait of Hormuz carries roughly 20% of global oil supply, so any sign that passage could normalise quickly changes the inflation and growth outlook at once.
Oil prices dived, bonds rallied and stocks surged after a two-week ceasefire in the Middle East spurred a relief rally as investors cheered the possible resumption of oil and gas flowing through the Strait of Hormuz https://t.co/yKdGZJtNVhpic.twitter.com/Op3DxWK89L
Oil fell sharply after the ceasefire announcement, with Brent dropping to $94.43 and WTI to $96.82 in one major move. That immediately reduced some of the pressure that had been supporting the dollar.
That said, the market has learned not to trust promises alone. A temporary reopening reduces panic, but it does not fully remove the risk premium unless traders see stable flows and a broader peace framework take shape. That is why the dollar is softer, but not collapsing.
Inflation Risk Still Limits How Far the Dollar Can Fall
The softer dollar is running into a second force: inflation expectations are still too high to rebuild an easy Fed-cut story.
March survey data showed one-year inflation expectations rose to 3.4% from 3.0%, and expected gasoline-price inflation surged to 9.4%, the highest since the 2022 energy shock. Those numbers show that the oil shock has already filtered into household expectations, even as crude has pulled back from the panic highs.
That keeps the rate backdrop from turning fully dovish. A lower dollar usually needs either cleaner disinflation or softer growth data. Right now, the market only has partial relief on oil and a CPI report still ahead. Until that print lands, traders are unlikely to price an aggressive slide in the dollar.
CPI is the Next Real Test
The next step for USDX depends on whether US inflation data confirms that the energy shock is already feeding through. Business surveys are pointing in that direction.
US services growth slowed in March, while input prices rose at the fastest pace in more than 13 years. That combination matters because it points to a more difficult mix for the Fed: slower activity with hotter costs.
March ISM Services PMI falls to 54 from 56.1, coming in worse than estimated. pic.twitter.com/b62OHoQQFj
If CPI comes in firm, the dollar may stabilise quickly because the market will go back to higher-for-longer thinking. If CPI is softer than feared, the latest drop in USDX may extend because traders will start removing more of the inflation premium that built up through March.
Stay up-to-date on news around President Donald Trump and market impacts here.
Technical Analysis
The US Dollar Index (USDX) is trading near 98.67, pulling back from recent highs around 100.48 as momentum begins to fade. Price action shows a clear rejection from the 100 handle, with the latest candles reflecting increasing selling pressure and a shift into short-term consolidation.
The move lower suggests the recent bullish leg is losing strength, with the market now testing whether support can hold below the 99 level.
From a technical standpoint, the trend is transitioning from bullish to neutral. Price is slipping below the 5-day (99.55) and 10-day (99.65) moving averages, both of which are beginning to roll over and act as immediate resistance.
The 20-day (99.52) is flattening, signalling that upside momentum has stalled. This alignment points to weakening structure, with the recent rejection from 100 acting as a key turning point in the short term.
Key levels to watch:
Support: 98.70 → 97.90 → 96.40
Resistance: 99.40 → 100.00 → 100.50
The immediate focus is on the 98.70 support zone, which price is currently testing. A break below this level could open the path toward 97.90, where stronger support is likely to emerge.
On the upside, 99.40 is now acting as near-term resistance. A move back above this level would suggest a stabilisation in price and could lead to another attempt toward the 100.00 handle.
Overall, USDX is showing signs of short-term exhaustion after its recent rally. The rejection from the 100 level shifts the bias toward consolidation or a deeper pullback, unless buyers can quickly reclaim control above the 99.40–100.00 region.
What Traders Should Watch Next
The dollar now sits between easing war risk and persistent inflation risk. The truce has weakened the haven bid, but CPI can still rebuild support if price pressure stays sticky. The market will also keep watching whether the Hormuz reopening proves durable or starts to fray.
A stable ceasefire and softer inflation would likely pressure USDX further. A breakdown in either would likely pull buyers back into the dollar.
USDX fell because the market pulled out part of the safe-haven premium after Trump delayed threatened strikes on Iranian civilian infrastructure by two weeks and described the move as a “double-sided ceasefire.” That reduced immediate demand for the dollar as a defensive asset.
Why Did Safe-Haven Demand Fade So Quickly?
The market had been holding dollars because of war risk, Hormuz disruption, and higher-for-longer Fed pricing. A temporary pause in escalation gave traders a reason to unwind some of that positioning, even though the broader conflict risk has not disappeared.
Does a Two-week Ceasefire Mean the Dollar Will Keep Falling?
Not necessarily. A temporary truce can weaken the dollar in the short term, but the move may stall if shipping risks return, if the ceasefire breaks down, or if inflation data keeps the Fed cautious. The market still needs proof that energy flows are stabilising.
Why Does the Strait of Hormuz Matter So Much for the Dollar Index?
Hormuz matters because it carries roughly 20% of global oil supply. When traders think the route may reopen, oil prices ease, inflation fears soften, and some of the dollar’s support fades. When the route looks threatened, the dollar usually regains ground.
Why Hasn’t the Dollar Fallen More Sharply?
Inflation risk is still limiting the downside. One-year US inflation expectations rose to 3.4% in March from 3.0% in February, and expected gasoline-price inflation jumped to 9.4%. That keeps the market from fully rebuilding a dovish Fed story.
Start trading now – Click here to create your real VT Markets account