Please note that the dividends of the following products will be adjusted accordingly. Index dividends will be executed separately through a balance statement directly to your trading account, and the comment will be in the following format “Div & Product Name & Net Volume”.
Please refer to the table below for more details:
The above data is for reference only, please refer to the MT4/MT5 software for specific data.
If you’d like more information, please don’t hesitate to contact info@vtmarkets.com.
Sydney, Australia, 22 January —VT Markets today announced the release of its 2026 Global Market Outlook, titled “Steady Growth, Balanced Inflation: Navigating a Regime of Structural Opportunity.” The report delivers a forward-looking, multi-asset assessment of the trends and opportunities expected to shape global markets in 2026, drawing on in-depth analysis across equities, foreign exchange, crypto assets, and commodities.
As global growth steadies and inflation pressures continue to normalize, markets are entering a new phase marked by structural adjustment and more balanced risk conditions. Developed by VT Markets’ analyst team, the report examines how these shifts may influence asset allocation, sector leadership, and trading strategy, enabling market participants to move beyond short-term volatility and focus on longer-term positioning.
Key Highlights from the 2026 Global Market Outlook
2026 Equities Outlook Authored by Ross Maxwell, Global Strategy Operations Lead, the equities outlook assesses global and U.S. equity markets, covering U.S. economic performance, key drivers, sector opportunities and risks, as well as index technicals and scenario-based outlooks. The analysis highlights the importance of selectivity as market leadership broadens.
2026 Forex Outlook Written by Justin Khoo, Senior Market Analyst, the FX outlook examines the global macro and policy backdrop shaping currency markets, outlining key drivers, potential scenarios, and practical trader takeaways, with central bank divergence and capital flows as core themes.
2026 Emerging and alternative assets
Analyzed by Eduardo Ramos, Senior Market Analyst, this section evaluates developments across emerging and alternative asset classes through the lens of institutional engagement, capital allocation trends, and market structure evolution.
2026 Commodities Outlook Written by Nayel Al-Jawabra, Senior Market Analyst, the commodities outlook explores a “new commodity regime,” focusing on structural demand drivers, strategic supply dynamics, and portfolio implications.
The report also includes a special China-focused edition, authored by Ray Yang, Market Analyst, providing targeted insight into China’s economic performance, policy direction, structural challenges, and investment opportunities.
Rather than short-term forecasts, the VT Markets 2026 Global Market Outlook emphasizes scenario analysis, risk awareness, and strategic preparedness across asset classes and regions.
The 2026 Global Market Outlook: Steady Growth, Balanced Inflation: Navigating a Regime of Structural Opportunity is now available for download via link here.
Written on January 22, 2026 at 10:29 am, by anakin
Please note that the dividends of the following products will be adjusted accordingly. Index dividends will be executed separately through a balance statement directly to your trading account, and the comment will be in the following format “Div & Product Name & Net Volume”.
Please refer to the table below for more details:
The above data is for reference only, please refer to the MT4/MT5 software for specific data.
If you’d like more information, please don’t hesitate to contact info@vtmarkets.com.
The global financial crisis of 2008 was one of the most devastating economic events in modern history, wiping trillions of dollars from global markets and leaving millions unemployed. Understanding what caused the financial crisis in 2008 is crucial for anyone interested in finance, economics, or investing. Many people still search “what is the cause of financial crisis in 2008” because the crisis reshaped global markets for years. This article explores the key reasons for global financial crisis 2008, including risky lending, complex financial products, and regulatory failures, while examining its worldwide effects and the lessons learned to prevent a repeat.
What Is the Global Financial Crisis of 2008?
So, what is the global financial crisis of 2028? The global financial crisis of 2008, often referred to as the Great Recession, was a rapid and severe collapse of financial systems worldwide. It began in the United States and quickly spread across the globe, triggering widespread economic downturns, massive job losses, and the largest wave of foreclosures in decades. Understanding what caused the financial crisis in 2008 is essential, as its effects have profoundly influenced financial regulations, market dynamics, and investor behavior for years to come.
The crisis was later examined in depth by the Financial Crisis Inquiry Commission (FCIC), which concluded it was largely preventable and driven by major failures in regulation, risk management, and lending standards.
The Global Financial Landscape Before 2008
In the early 2000s, several conditions aligned to create the perfect storm. Ultra-low interest rates encouraged a housing boom, while lending standards declined, particularly for subprime borrowers. During this period, the housing market and financial sector became deeply interconnected. Housing growth supported jobs and consumer spending. Meanwhile, banks expanded complex financial products tied to mortgages. At the same time, financial engineering enabled widespread securitisation of mortgages, and shadow banking flourished with minimal oversight. Global credit and investment networks became increasingly interconnected, spreading risk across borders. These factors masked the mounting dangers until they eventually came crashing down, crystallising the reason for global financial crisis 2008.
What Are the Causes of the 2008 Financial Crisis?
The 2008 financial crisis was triggered by a complex interplay of factors, including risky lending practices, the bursting of the housing bubble, excessive leverage by financial institutions, and failures in regulation and oversight.
Subprime Mortgages and the Housing Bubble
Banks offered high-risk subprime loans and loans to borrowers with weak credit histories. House prices rose rapidly during the boom, but when housing prices fell, it led to widespread defaults. When teaser rates reset and borrowers could not refinance, defaults surged, and the mortgage market began to unravel. U.S. home mortgage debt rose to about 73 per cent of GDP in 2008, up from an average of 46 per cent during the 1990s.
Securitisation and Complex Derivatives
Banks packaged subprime mortgages into mortgage‑backed securities (MBS) and derivatives like collateralised debt obligations (CDOs), then sold them globally. Credit default swaps were widely used as a form of insurance on these mortgage-backed securities and other assets, increasing systemic risk. Many were misrated as safe, magnifying losses.
Excessive Leverage and Risk-Taking
Financial institutions borrowed heavily to invest, increasing their vulnerability. Large financial institutions, particularly those engaged in investment banking, borrowed heavily to amplify returns, which further increased their exposure to market shocks. Derivatives grew to a notional value of around USD 683 trillion by mid‑2008. This made the system highly interconnected and vulnerable when prices moved sharply.
Regulatory Failures and Deregulation
Failures in financial regulation, including lax oversight, repeal of financial safeguards, and deregulation of derivatives, enabled unchecked risk. Rating agencies failed to accurately assess asset quality.
Collapse of Shadow Banking
Entities outside traditional banks relied on short-term funding to support long-term assets. When trust evaporated, markets froze, causing a systemic credit crunch. The collapse of trust led to severe pressures in the commercial paper market and runs on money market mutual funds, further freezing credit.
Timeline of Key Events in 2008
Here is a clear timeline of major happenings:
Date
Event
March 2008
Investment bank Bear Stearns collapses as hedge funds fail
September 2008
Lehman Brothers files for bankruptcy; several banks failed, and other banks were acquired or bailed out; Dow drops sharply
September 2008
AIG bailed out; Washington Mutual seized
October 2008
TARP ($700 billion bailout) approved; Dow Jones Industrial Average and broader stock markets crash ~18 per cent in one week
Dec 2008 to mid 2009
U.S. economy officially in recession; stimulus and quantitative easing deployed
These events triggered a rapid loss of confidence, tightening credit conditions and accelerating the global downturn.
What Are the Effects of the Financial Crisis of 2008?
The crisis had devastating global consequences:
Job losses and unemployment rate: In the U.S., around 8.7 million jobs disappeared, and the unemployment rate more than doubled, peaking at 10 to 11 per cent during the crisis.
Economic weakness and financial instability: The aftermath saw prolonged economic weakness, a severe banking crisis, and the freezing of credit markets, which disrupted liquidity and financial stability worldwide.
Household wealth destroyed: U.S. household net worth fell by USD 11 trillion between 2007 and Q1 2009.
Stock market crash: The Dow Jones fell by approximately 53 per cent from 2007 to 2009.
Global recession: Worldwide trade and investment declined sharply. Countries across Europe and Asia slipped into recession.
These are among the clearest illustrations of the global financial crisis 2008 impact.
Lessons Learned from the 2008 Financial Crisis
In response, governments and regulators instituted reforms:
Stronger regulation: In response to the crisis, the U.S. enacted the Dodd-Frank Act in 2010, and international standards like Basel III increased capital requirements for banks to enhance their resilience.
Consumer protection: Dodd-Frank introduced stronger consumer safeguards and created the Consumer Financial Protection Bureau (CFPB) to reduce predatory lending practices.
Enhanced oversight: Credit rating agencies and the shadow banking system now operate under stricter regulatory scrutiny to reduce systemic risks.
Central bank interventions: Tools such as quantitative easing and targeted bailouts became essential in stabilizing financial markets during the crisis.
Improved risk management: Financial institutions have since adopted more rigorous monitoring of leverage, liquidity, and transparency.
Focus on financial stability: Maintaining the stability of the financial system has become a central objective of post-crisis reforms, emphasizing robust regulation and the independence of central banks.
Ongoing research: Continuous economic research supports policy development and regulatory improvements to help prevent future crises.
In Summary
The cause of the global financial crisis 2008 can be traced to a toxic mix of risky lending, financial innovation gone wrong, excessive leverage, absent oversight and interconnected global markets. The collapse of the U.S. housing bubble triggered a chain reaction that spread worldwide. Loss of wealth, mass unemployment and recession were its tragic legacy. The regulatory and market reforms since have shaped a more resilient financial system. However, the lessons remain vital for future stability.
For investors and traders, the biggest lesson is simple: leverage and liquidity risk matter most when markets turn.
Whether you are new to trading or refining your trading strategies, you can practise in a risk-free environment with a VT Markets demo account before moving to live markets. Our comprehensive Help Centre is available to guide you through any stage of your trading journey, ensuring you have the resources you need to make informed decisions with confidence.
1. What exactly caused the financial crisis of 2008?
A mix of subprime lending, securitisation of risky mortgages, excessive leverage, weak regulation, and the collapse of interconnected financial institutions.
2. Could a similar crash happen again?
While safeguards like higher capital requirements and stress testing reduce the risk, global debt levels, asset bubbles, or emerging market shocks could still pose threats.
3. What measures now prevent a repeat?
Banking reforms, tighter regulation of derivatives, oversight of shadow banking, and improved transparency aim to reduce systemic risk.
4. How long did the global financial crisis of 2008 last?
The worst period of the crisis lasted from late 2007 to mid-2009, although its economic effects persisted for several years. Recovery in some countries, especially in employment and housing markets, took up to a decade.
5. Which countries were most affected by the 2008 financial crisis?
The United States was at the epicentre, but major economies such as the United Kingdom, Germany, Japan, and several European nations experienced deep recessions. Emerging markets in Asia and Latin America also saw slowed growth and reduced trade.
6. How did the 2008 financial crisis affect ordinary people?
Millions lost their jobs, homes, and savings. Credit became harder to access, and consumer confidence dropped sharply. Retirement accounts and investments lost significant value, and many households took years to recover financially.
7. What industries suffered the most during the 2008 financial crisis?
Banking, real estate, and construction were hit hardest, followed by manufacturing, retail, and industries reliant on consumer spending.
8. What role did central banks play in stopping the crisis?
Central banks around the world slashed interest rates, injected liquidity into financial systems, and implemented measures such as quantitative easing to stabilise markets and restore confidence.
9. Could another global financial crisis happen for different reasons?
Yes. While the causes may differ, for example geopolitical tensions, technology failures, or climate-related shocks, the risk of a severe economic downturn remains if vulnerabilities are left unaddressed.
Please note that the dividends of the following products will be adjusted accordingly. Index dividends will be executed separately through a balance statement directly to your trading account, and the comment will be in the following format “Div & Product Name & Net Volume”.
Please refer to the table below for more details:
The above data is for reference only, please refer to the MT4/MT5 software for specific data.
If you’d like more information, please don’t hesitate to contact info@vtmarkets.com.
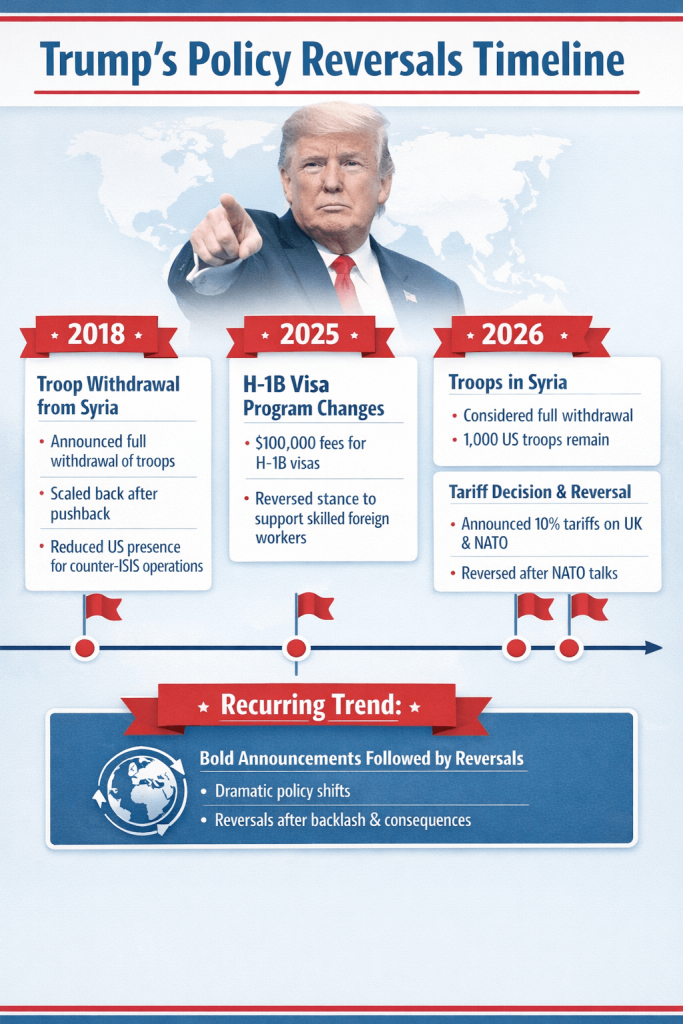
Since returning to the White House in 2025, Donald Trump has acted quickly to roll out an aggressive policy agenda. Executive orders, tariff threats, and major administrative changes were announced in rapid succession, often moving markets and drawing global attention. However, many of these decisions did not remain in place for long. Several were later delayed, adjusted, or reversed after running into political resistance, legal hurdles, or concerns from investors and institutions.
A Pattern in Trump’s Policy Decisions
Trump’s approach to policy often involves bold announcements followed by significant reversals once practical or geopolitical consequences become clear. His flippant words have been seen in various sectors:
Military Presence: Trump frequently announced troop withdrawals, like from Syria, only to scale back after realising the complexities, such as security concerns and ISIS prisoners.
Immigration: His initial hardline stance on foreign labor, like imposing high fees on H-1B visas, shifted after aligning with business leaders who stressed the need for skilled foreign workers in tech and defense.
Tariffs: Trump’s 2026 decision to impose tariffs on UK and NATO allies sparked backlash. After talks with NATO officials, he reversed the decision, framing a new long-term deal.
These episodes demonstrate a recurring trend in Trump’s decision-making: bold and often controversial policy announcements that dilutes geopolitical strategy and generate haphazard fluctuations in global markets.
How Policy Shocks Move Global Markets
Trump’s tariff threats have consistently created volatility in global markets, with investors often uncertain about whether the threats will materialise or be reversed.
This pattern has given rise to the ‘Trump Always Chickens Out’ (TACO) effect.” – a cycle of bold threats followed by softening positions, leading to a market reaction where investors are initially rattled, but tension typically eases when Trump backs down.
In the latest round of tariff threats, markets reacted swiftly. European stocks dipped, with major indexes such as Germany’s DAX, London’s FTSE, and France’s CAC 40 seeing declines. The VIX volatility index surged 27%, indicating growing concern. Yet, investors have become increasingly sceptical, having been burned before by Trump’s on-again, off-again approach.
Just like that, markets are once again pricing in the possibility of a policy reversal, with traders betting that many of Trump’s threatened tariffs on European countries may not be implemented. According to Polymarket, only a small percentage of investors believe the full set of tariffs will take effect. This reflects a broader investor sentiment shaped by the consistent pattern of Trump backing down under market pressure.
Despite the uncertainty, the impact of Trump’s trade policy on the U.S. dollar and inflation continues to be significant. Analysts at UBS have noted that additional tariffs would increase inflationary pressures in the U.S. and further erode the dollar’s status as a global reserve currency. However, bond investors do not appear overly concerned, with most dismissing the long-term effects of the threats.
While the “TACO” effect has become a familiar response for investors, it’s clear that the unpredictable nature of Trump’s trade policies keeps global markets on edge, creating a paradox: the more the market discounts these tariff threats, the more likely they are to be enacted as the administration gains confidence. This ongoing uncertainty underscores how policy shocks can significantly impact investor sentiment and global market stability.
Strategies in the Current Political Climate
As the markets react to sudden policy shifts, how can traders capitalise on volatility without the luxury of foresight? Here’s how to turn market chaos into a potential opportunity:
1. Stay Informed
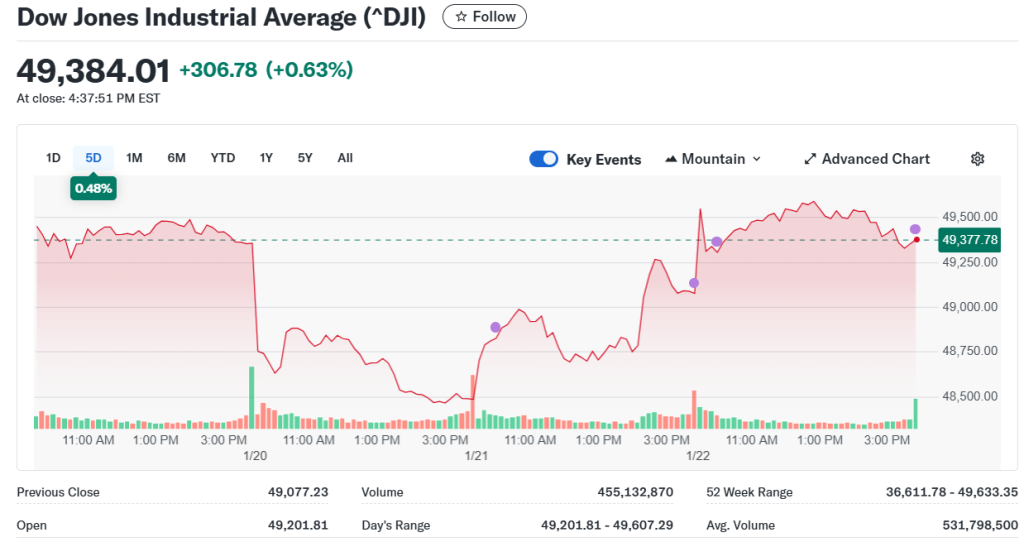
News moves markets, and there’s no clearer example than President Trump’s sudden reversal on Greenland and tariffs. The Dow Jones spiked around 1.2%, or over 550 points, following Trump’s announcement that the US and NATO had reached a deal framework, which led him to backtrack on tariffs previously scheduled to hit European nations.
This news came just days after Trump’s threats had caused widespread panic, pushing investors to exit positions. By staying informed through apps like Reuters, Bloomberg, and CNBC, traders can react quickly to unexpected shifts in sentiment, giving them an edge before the broader market adjusts.
A quick check of headlines, Economic Calendar and VT Markets’ daily analysis could’ve kept you in the game during this chaotic period. Set up alerts for keywords like “Trump” or “tariff” to stay ahead of the curve.
2. Use Stop-Loss Orders
Market volatility, such as the one seen after Trump’s tariff threats, can make it tough to navigate trades. But using stop-loss orders offers a safety net.
After the initial sell-off in January 2026, the market saw a strong reversal. A stop-loss protects traders during the downturn, but provides calculated rallying opportunities when the news breaks.
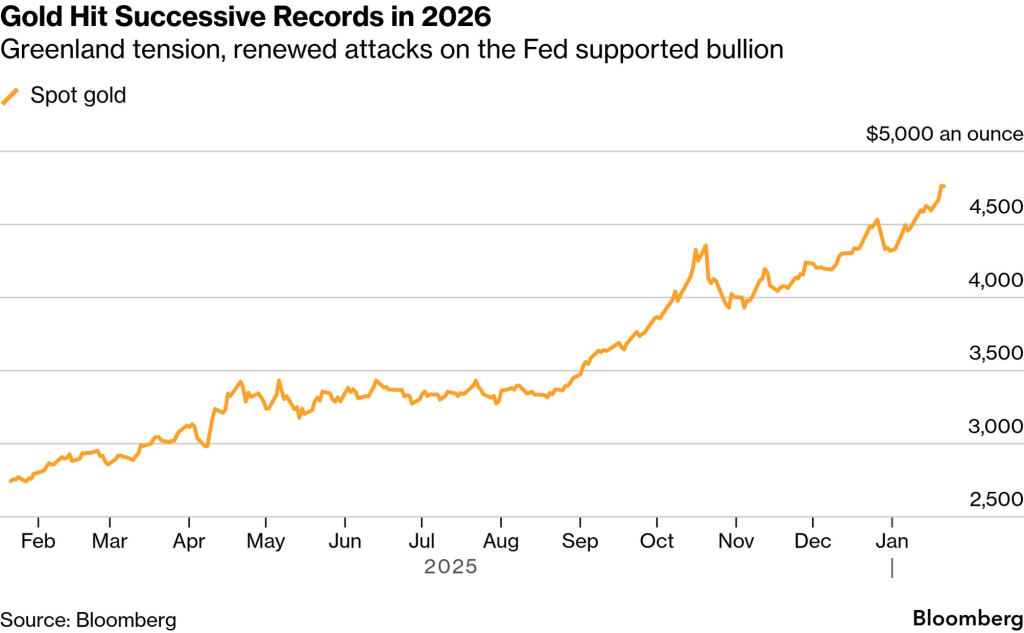
3. Diversify with Safe Havens
When news like Trump’s tariff threats hits the market, many traders flock to safe-haven assets like gold or bonds. In the wake of the announcement about Greenland, gold prices remained steady, providing a buffer against equity volatility.
A small stake in gold or Treasuries before the market rally could provide a more stable environment to park assets during uncertainty, and offer gains once the market recovers.
Gold prices, for example, remain quite steady before the positive news hit, allowing traders to stay grounded before pivoting back into riskier assets after Trump’s tariff reversal.
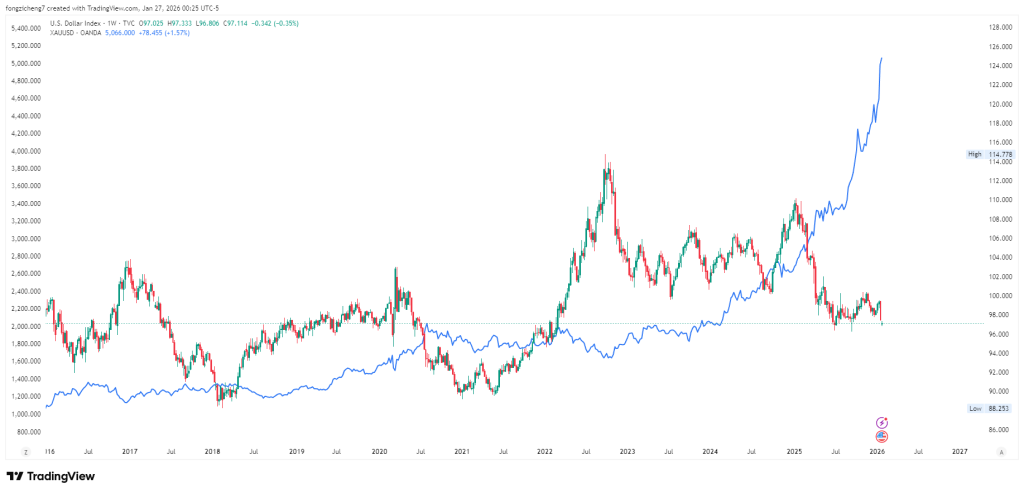
4. Monitor Currency & Commodity Correlations
When political news hits, some markets move in tandem. For example, a sudden US tariff reversal often strengthens the USD against riskier currencies like AUD or emerging market FX, while commodities like oil or gold may react differently. Understanding these correlations can help traders hedge or position effectively.
Source: Tradingview, Description: In candlesticks: Dollar. In blue: Gold
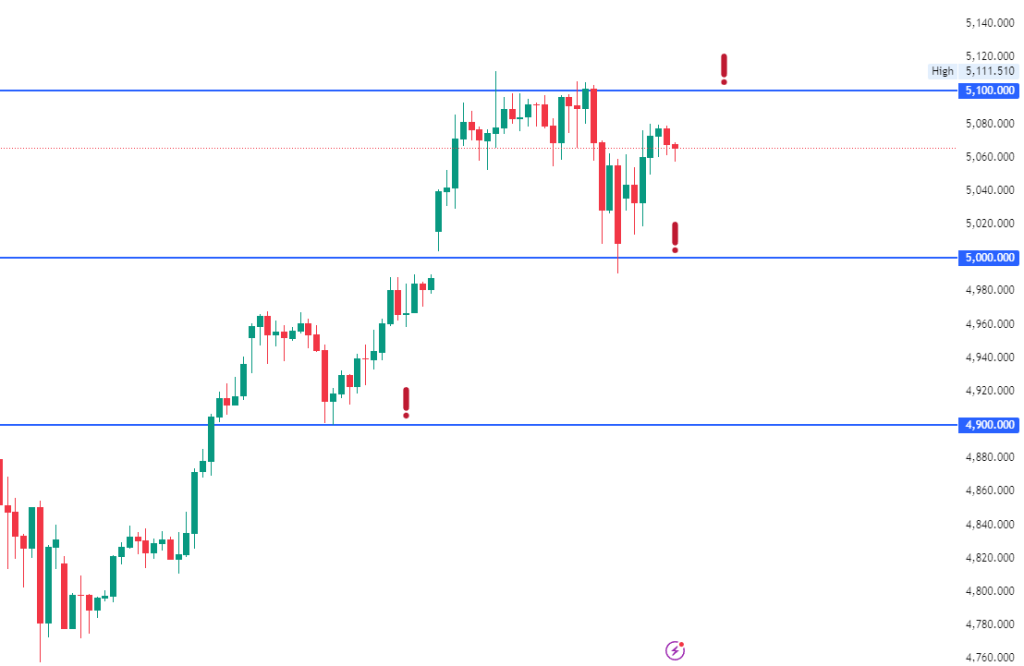
5. Use Technical Levels for Confirmation
Even in news-driven markets, prices often respect key technical levels (support, resistance, Fibonacci, trendlines). Traders can combine news analysis with these levels to time entries and exit more confidently, going beyond headlines and market noise.
Source: Tradingview
Conclusion
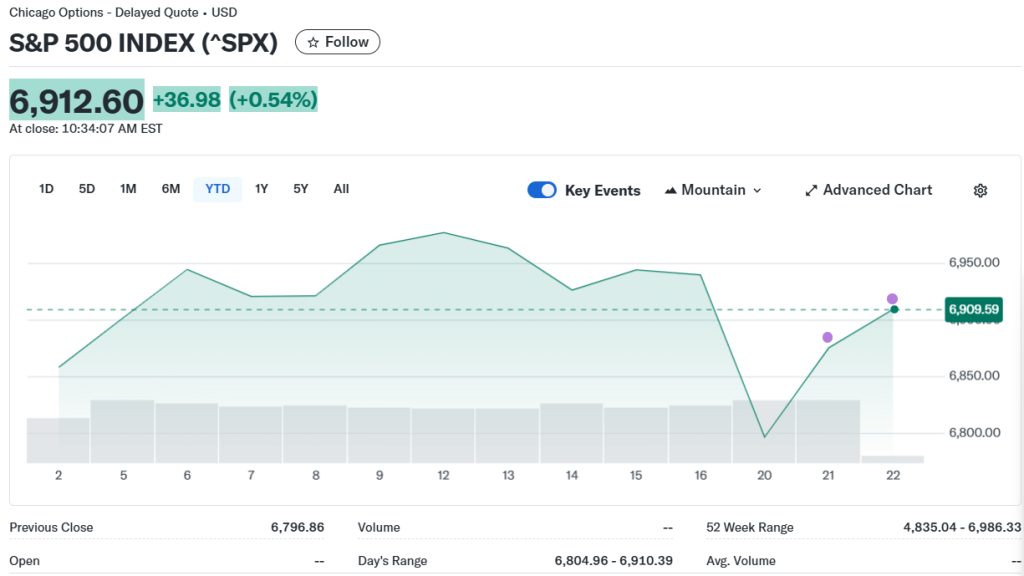
Markets have a flair for the dramatic, and Trump’s tariff U-turns prove just how quickly sentiment can shift —flipping the Dow, Nasdaq, and S&P 500 from sharp losses to strong gains. In this political climate, traders can stay in the game when things get unpredictable.
Ready to test your strategies? Start practising on VT Markets’ demo account with small, no-risk trades. And when you’re ready, open a live account with VT Markets, starting small and seizing the next twist in the market.
You’ve got this—grab your phone, set those alerts, and get prepared for the next market move!
Please note that the dividends of the following products will be adjusted accordingly. Index dividends will be executed separately through a balance statement directly to your trading account, and the comment will be in the following format “Div & Product Name & Net Volume”.
Please refer to the table below for more details:
The above data is for reference only, please refer to the MT4/MT5 software for specific data.
If you’d like more information, please don’t hesitate to contact info@vtmarkets.com.