Daily Market Analysis
Market Focus
Volatility gripped financial market, spurring a stock selloff amid concern that a surge in global coronavirus cases could crimp the nascent economic recovery. Traders were also jittery ahead of Tuesday’s runoff elections in Georgia, which will determine whether Democrats have control of Congress to push President-elect Joe Biden’s agenda.
While equities pared a slide that drove major US benchmarks down more than 2% earlier Monday, the S&P500 still had its worst day in almost 10 weeks. Giants Apple Inc. and Amazon.com Inc. sank at least 2.1%, Boeing Co. weighed on the Dow jones Industrial Average after an analyst downgrade, and Tesla Inc. climbed after coming close to meeting its vehicle-deliveries goal. The Cboe Volatility Index surged the most since October.
UK PM Boris Johnson imposed a third coronavirus lockdown across England, shutting schools and ordering the public to stay at home, amid dire warnings that the National Health Service is at risk of being overwhelmed. The emergency measures will start immediately and last until at least Feb. 15, potentially devasting retail and hospitality businesses and threatening to push the economy into a double-dip recession, as medics try to get a grip on the pandemic.
According to John Stoltzfus, chief investment strategist at Oppemheimer, “Equity markets will remain sensitive to developments tied to the pandemic that have held the US and global economy hostage for nearly a year. A nearer hurdle for the markets to consider will be the outcome of the runoff elections for two seats in the US Senate taking place in Georgia. Should the Democrats win both seats, we expect the S&P 500 to become vulnerable to a downdraft in the neighborhood of 6% to 10% from the end of 2020.”
Market Wrap

Main Pairs Movement
EURUSD is trading below 1.23, up on the day but off the highs. The market mood has somewhat soured as concerns about the resurgence of coronavirus is outweighing vaccine hopes. Tensions are mounting ahead of Tuesday’s special elections in Georgia. US equities plummeted after reaching record highs, backing the greenback during US trading hours. Mounting coronavirus concerns and tougher restrictive measures weighed on sentiment. The Loonie pair dropped to its lowest level since April 2018 at 1.2663 on Monday but reversed its course in the second half of the day. The DXY starts the new year on the negative side and extends the drop to fresh lows in the 89.40 region, but has now reversed the trend and is currently sitting at 89.900 as of writing.
WTI is trading at $47.71 between a range of $47.28 and $49.80 bbls. The price of a barrel of oil dropped from multi-month highs in volatile trade to start the year.
Technical Analysis:
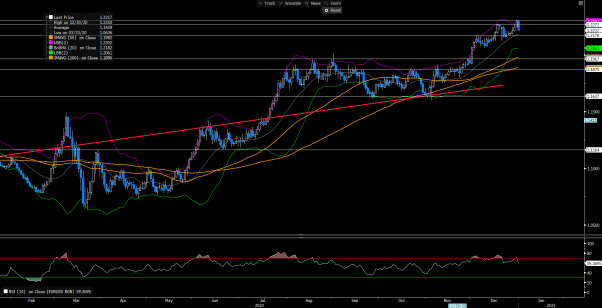
XAUUSD (4 Hour Chart)

On Monday, the gold exhibits an extensive rally that topped at $1945 from the low of $1904, and the yellow metal is currently trading around $1940. The worsening global Covid situations and hopes for more inflow of monetary and fiscal support have significantly boosted investors’ interests in acquiring safe-haven assets, such as Gold and cryptocurrency, in the first trading day of 2021. Another indicator for the bullish momentum of gold can be found in the continually weakening DXY, the rate of DXY has be found trading near 89.425 at one point in the earlier session today.
From a technical perspective, with the 20-Day SMAVG crosses above the longer-period 60-Day SMAVG and the MACD line sets well above the signal line, it is inferable that a bullish momentum of Gold is well-supported, at least in the short-term. Another notable trend is that the reading of RSI has been hovering above the overbought threshold for quite some time, suggesting the bulls are dominating the trading bias for the pair, nonetheless, that also means a downward correction is likely. If the bulls can penetrate the resistance at $1945.39, the bulls can see to cap their profit at $1952.39. Conversely, the bears would need to find acceptance below the most immediate support at $1917 to bring XAUUSD back down below the $1900 zone.
Resistance: 1952.69, 1945.39
Support: 1917.53, 1897.97, 1888.50, 1876.53
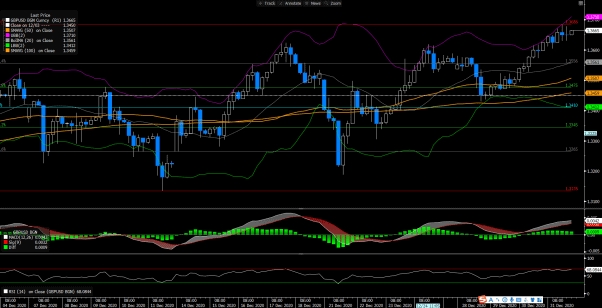
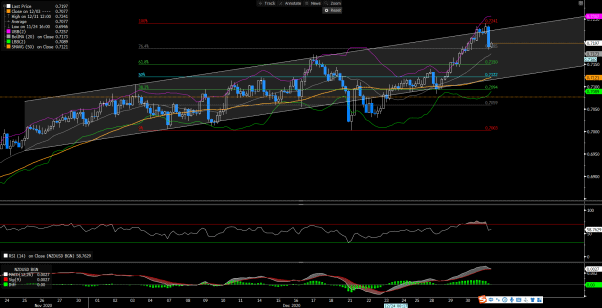
GBPUSD (4 Hour Chart)

Investors for GBPUSD are anticipating the UK PM Johnson to announce a new and stricter nationwide lockdown amid an increase in Covid cases, which in turn, drag down the price of Cable substantially from the high of 1.37 to the lowest of 1.3542. The sharp decline of GBPUSD pulled down the RSI from the overbought region to around 44 at the time of writing, indicating a bearish sentiment is spread out across investors. However, given that the 15-Day SMAVG is still supporting a bullish move, it is reasonable to assume that it would not be a prudent move to place additional short positions of the Cable pair as of now, especially the Britain has begun to administer the AstraZeneca vaccine on Monday.
Resistance: 1.3629, 1.3702
Support: 1.3555, 1.3471, 1.3407
USDJPY (4 Hour Chart)

After bottoming at nine-month lows of 102.71, USDJPY bounced back extensively, the pair is trading around 103.12 at the moment. The rebound of USDJPY is possibly supported by the declining US equity markets. All three major index of Wall Street have once fallen by 2% today, this reversal of trading to the downside across US equities helped boost the demand of greenback, and in turn, supported the USDJPY to stage a rebound from the nine-month lows. From a technical perspective, the USDJPY continues to stay bearish as the 60-Day SMAVG is fluctuating above the 15-Day SMAVG. Additionally, the rally of the pair has seemed to pause as the RSI is no longer raising after it reached the 50ish neutral line. If the USDJPY bulls want to stage a confirmative recovery, the pair must first find acceptance above 103.27 resistance. Conversely, if USDJPY loses grounds at 103.02 support, it is likely that the pair would resume its declining tendency.
Resistance: 103.27, 103.47, 103.66
Support: 103.02, 102.75
Economic Data
Click here to view today’s important economic data.