Daily Market Analysis

Market Focus

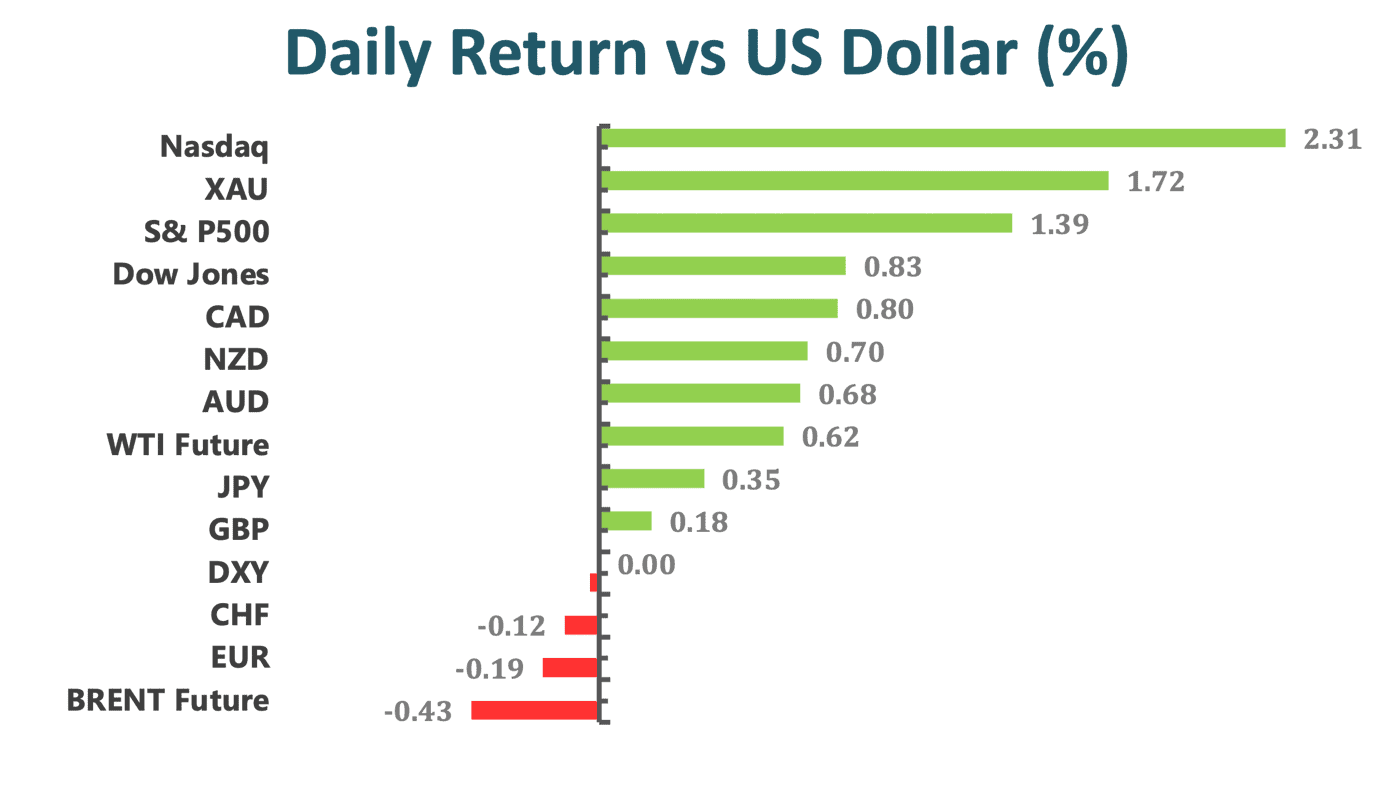
US stocks rallied to all-time highs as investors grew optimistic that recent federal spending will revive growth and bolster corporate earnings. Treasuries were little changed while the dollar weakened. The Nasdaq 100 Index jumped more than 2% and the SP500 Index posted the best first-day reaction to a newly elected president’s inauguration since Jan. 20 became the official start in 1937. Netflix Inc. surged more than 17% after a jump in subscribers. Chipmaker ASML Holding NV rallied on solid results. Morgan Stanley gained after reporting record full-year results.

Investors looked past a fresh stumble in the rollout of vaccines and elevated infection rates, and eyed the promise of more stimulus and an expanded federal effort to get shots to more Americans quickly under President Joe Biden.

According to Keith Buchanan, a portfolio manager for GLOBALT Investments, “If stimulus happens at the same time that people get vaccinated, the optimism can’t help but build. It’s a fairly safe bet there will be another stimulus package with more direct payments to consumers and individuals and more help for small businesses.”

While investors are counting on more spending to help propel economic growth under Biden, who is planning a flurry of executive orders on his first day, it won’t be all smooth sailing as Janet Yellen encounters early Republican resistance to Biden’s relief plan in her confirmation hearing to become Treasury Secretary.


Market Wrap

图表

描述已自动生成

Main Pairs Movement

GBPUSD has fallen off the peak of 1.3719, the highest since 2018, amid fresh dollar strength. Optimism about the UK’s vaccine campaign and lower cases boosted sterling earlier. The greenback awaiting Biden’s first moves as President. The pair dropped from pre-release levels close to 1.2700 to nearly as low as the 1.2600 mark, before pairing losses to settle closer to 1.2650. In doing so, the Loonie hit its highest levels in nearly three years versus the US dollar. USDJPY resumed its decline after failing to advance beyond 104.00. Pressure mounts as investors await for Bank of Japan.

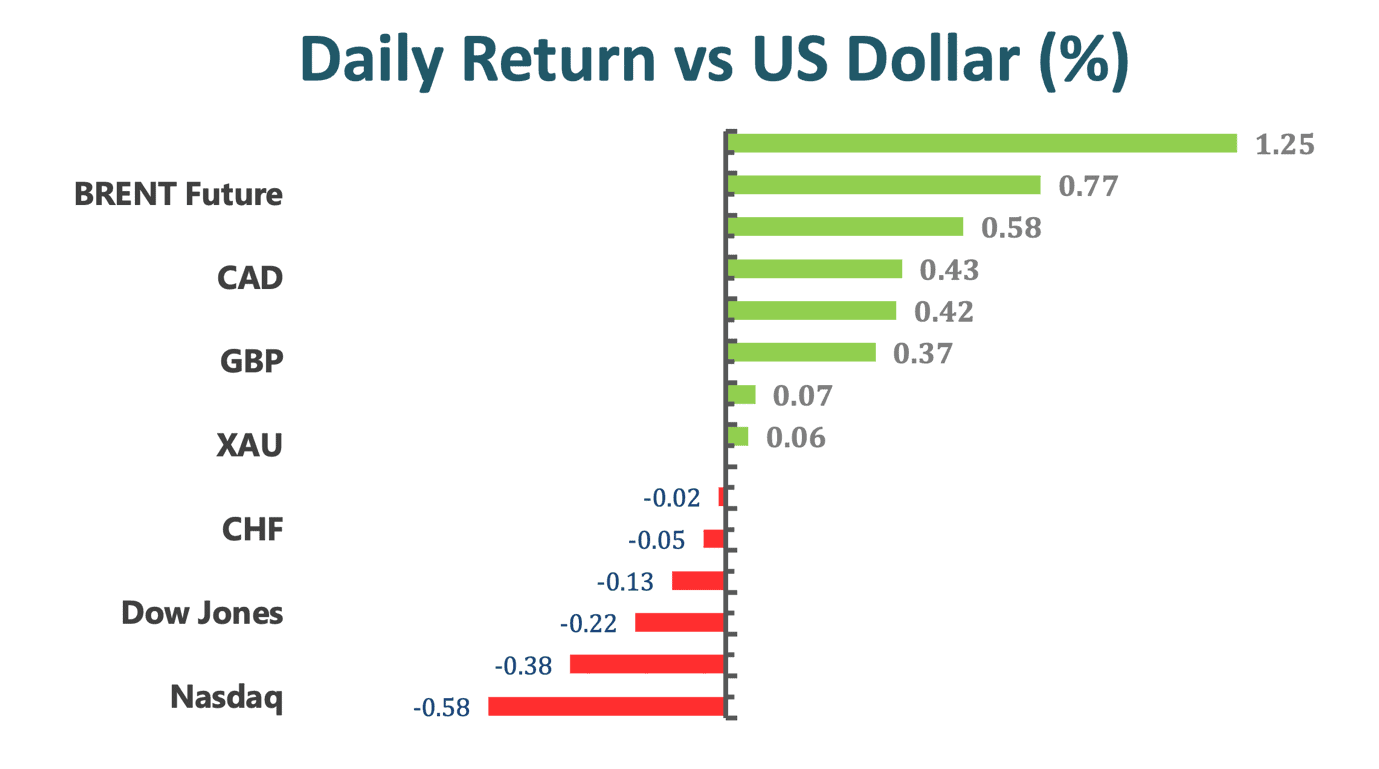
Crude Oil markets trade on the front foot on Wednesday, though have largely failed to take advantage of a recent improvement in risk appetite that has seen US stocks surge since the open and the US dollar fall, particularly against commodity FX. DXY met buyers in the 90.30 region earlier on Wednesday and now resumes the upside to the 90.50/55 band.


Technical Analysis:

EURUSD (4 Hour Chart)

After touching the lows around 1.2077 briefly, EURUSD has bounced back to near 1.21 as Biden becomes US President. Given that the EURUSD failed to extend its weekly recovery above the 1.2160 level and that the greenback has slightly bounced back on the Inauguration Day, the bears are attracted back to the market to undermine the prices of EURUSD. Markets are now focusing on how Joe Biden and his administration would address the ongoing trade conflict with China, the nuclear agreement with Iran, stimulus plans, and extra announcements regarding green energy.

Reflecting from the chart, it is inferable that the bulls have met some new contention around both 1.2160 and 1.2116 resistance level. Knowing that the EURUSD is currently trading above 1.21 (a relatively high price range in recent years), it is reasonable to believe that a strengthened USD and global economic prospects would continue to keep the pair on the back foot. On top of that, a bearish trend is also supported by both the 60-Day SMAVG and the MACD histogram. If the decline continues, the first cushion would be found near 1.2077, then 1.2054, followed by 1.1992.

Resistance: 1.2116, 1.2170, 1.2206

Support: 1.2077, 1.2054, 1.1992


AUDUSD (4 Hour Chart)

Even though the Aussie continued to rise and even staged a short-lived surge towards the 0.7761 resistance, the lack of a further USD losses still keeps the pair from penetrating the pair’s most immediate resistance. At the time of writing, the relatively weak greenback and the lifted risk appetite have contributed to the Aussie’s 3 consecutive day gains. The upcoming AUD Employment Change (Dec) is closely monitored, and a number that beats the markets expectation may provide the much-needed boost for the pair to top near the psychological resistance at 0.7798.

From a technical perspective, Aussie’s recent rise is not yet supported by SMAVG and MACD, but both indicators are staging a cross that would soon indicate a bullish trend. Additionally, as the RSI has been consistently rising to the high 50s, it is clear that the traders are placing their bets on the bulls. However, it would be not be prudent to place any long positions until further confirmative news solidify Aussie’s upward momentum.

Resistance: 0.7761, 0.7798

Support: 0.7705, 0.7663, 0.7634


XAUUSD (4 Hour Chart)

The Gold is now trading around 1870, nearing its most immediate resistance at 1871, amid the risk-on sentiment across the board as US President Joe Biden speaks in the US Inauguration Day. The greenback today has an uneven performance as investors eagerly wait for a catalyst given that the macroeconomic calendar had little to offer so far for this week. According to analysts at TD Securities, the reason why the gold is being pulled upward amid a market-wide risk-on sentiment is that the gold inherent inflation-hedging properties, which can successfully take care of investors’ concerns over rising inflation expectations. However, if the demand volume for the Gold recedes, the counter-inflation nature of the yellow metal could lose its position and value in the market. From a technical perspective, the short-term bullish momentum of the yellow metal is supported by the MACD and RSI reading. If the precious metal can penetrate the $1871 resistance level, the next resistance can be found at $1882, then $1891. On the flip side, the cushions for the pair are $1847, $1839, and $1823.

Resistance: 1871, 1882, 1891

Support: 1847, 1839, 1823


Economic Data

Currency

Data

Time (TP)

Forecast

AUD

Employment Change (Dec)

08.30

50.0K

JPY

BoJ Monetary Policy Statement

11.00

N/A

JPY

BoJ Outlook Report

11.00

N/A

JPY

BoJ Press Conference

11.00

N/A

EUR

Deposit Facility Rate (Jan)

20.45

-0.50%

EUR

ECB Interest Rate Decision (Jan)

20.45

N/A

USD

Building Permits (Dec)

21.30

1.604M

USD

Initial Jobless Claims

21.30

910K

USD

Philadelphia Fed Manufacturing Index (Jan)

21.30

12.0

EUR

ECB Press Conference

21.30

N/A

Daily Position Report

Market Focus

U.S. stocks rose, led by gains in tech shares and small caps, with Wall Street parsing the latest earnings ahead of a flood of reports this week.

The S&P 500 Index rebounded from Friday’s selloff after a three-day weekend that brought little by means of fresh macro news. Ten-year Treasury yields climbed back toward 1.1% and the dollar weakened. Crude oil and emerging markets also advanced. Goldman Sachs Group Inc. turned lower even after reporting that profit more than doubled. Bank of America Corp. shares edged higher after its results. General Motors Co. rose to a record after Microsoft Corp. invested in its self-driving car startup. Netflix Inc. reports results after markets close.

Janet Yellen encountered early Republican resistance to President-elect Joe Biden’s $1.9 trillion Covid-19 relief plan in her confirmation hearing to become Treasury secretary. Donald Trump is in the final hours of his term, with Biden to be sworn in at noon Wednesday in Washington.

Hong Kong Stocks at 20-Month High as Record China Cash Floods In. The market moves on Tuesday show that investors are coming back to the reflation trade, betting that the incoming U.S. administration will use its legislative firepower to propel economic growth. Biden’s stimulus package includes measures like a minimum-wage hike and substantial expansion in family and medical leave — programs that have already triggered Republican opposition.


Market Wrap

图表

描述已自动生成


Main Pairs Movement

The greenback held modest losses for a second session amid light turnover after U.S. Treasury Secretary nominee Janet Yellen noted a preference toward a market-driven approach to American currency policy. The loonie gained ahead of the Bank of Canada’s monetary policy meeting on Wednesday.

The euro gained on improved risk sentiment, as well as corporate and options demand after several billion euros in higher struck options expired. The pound ticked higher after Bank of England Chief Economist Andrew Haldane said the bounce back from Covid may be sharper than the financial crisis. The Canadian dollar gained for the first time in three days.

USD/JPY is +0.2% after climbing as much as 0.4% to 104.09. The yen fell amid cross demand against the euro and Australian dollar, according to multiple Asia-based FX traders.


Technical Analysis:

GBPUSD (4 Hour Chart)

Sterling is edging above 1.36 as market eagerly Treasury Secretary nominee Janet Yellen’s testimony. The U.K. parliament is set to process the Brexit deal as Britain ramps up its vaccination campaign.

For technical aspect, MACD indicator is retreating from negative mire and spiraling the momentum at 0 level. RSI give another strong signal, indicator continues pick-up from neutral level to 55 as of writing, suggesting a positive phenomenon. As price action, sterling been through a “v shape pattern” reverse from last lowest level at 1.3618. For short-term, combing evidence that probably would give it an upward momentum. However, in bigger picture, consolidation range is still trapping sterling price momentum in nearly 2 months. Therefore, we expect 1.37 level remain a powerful resistance at top of consolidation, before that, barricade be eye on 1.3678. On contrast, first pivot of support is shoulder of “v shape pattern” at 1.3618 and 1.3541 is following behind.

Resistance: 1.3678, 1.37

Support: 1.3618, 1.354, 1.3448


USDJPY (4 Hour Chart)

Yen retreated consecutive from 104 and fell to 103.84, the lowest level since the Asian session. It is moving with a bearish bias, still positive for the day but off highs. A decline in U.S. yields and a correction in shares prices weakened the pair.

For technical perspective, RSI indicator remained above 50 then hold at 53 girds, suggesting a bullish trend further. On the other hands, Moving Average indicator give divergently signal for further movement. Short-term indicator ongoing flat momentum, but long-term indicator hold ascending trend that death cross at current stage. Therefore, we expect yen would still lack of price momentum as mixed guidance from indicators. So, according to price action, first resistance would be 104 level, piling by price densely area, the next strong resistance would be 104.25. On slid way, first resistance would be 103.65, confirmative strong price densely area.

Resistance: 104, 104.25

Support: 103.65, 103.54


XAUUSD (4 Hour Chart)

Gold tepid around 1838 as markets looking forward to Biden inauguration and “American Rescue Plan” ahead. In other words, market is really lack of momentum trigger before release any practical contents of rescue plan. On the other hands, 10 years Treasuries yield move slightly then close at 1.09% without any heralded sign.

For technical perspective, short and long-term SMAVG indicator still tamp down, but short one is getting flat at the moment which giving a sputter market guideline. On RSI side, indicator beneath 50 thresholds then close around 47, suggestion a bearish sign. Therefore, combing contrast suggestion from aforementioned technical indicator, we expect gold would haggle at current stage. On slid way, 1823 level be a strong support from longstanding picture.

Resistance: 1844.27, 1856, 1863.44

Support: 1823.4, 1815.08, 1804.15


Economic Data

Click here to view today’s important economic data.

VT Markets The Adjustment Of Weekly Dividend Notification

Dear Client,

Warmly reminds you that the component stocks in the stock index spot generate dividends. When dividends are distributed, VT Markets will make dividends and deductions for the clients who hold the trading products after the close of the day before the ex-dividend date.

Indices dividends will not be paid/charged as an inclusion along with the swap component. It will be executed separately through a balance statement directly to your trading account, the comment for which will be in the following format “Div & Product Name & Net Volume ” .

Please note the specific adjustments as follows:

If you’d like more information, please don’t hesitate to contact info@vtmarkets.com.

VT Markets Official Statement

Dear Client,

Recently, we discovered that someone is using our brand (“VT Markets”) without authorization, and we have received multiple scam alerts from our clients/partners. We strongly condemn these violations and reserves the right to pursue legal responsibility against this kind of illegal actions.

To protect your account information and fund security, please make sure you read from our official website https://www.vtmarkets.com/ (English) and https://www.vtmarkets-zh.com/ (Chinese), and only use the QR code here to download our trading APP:

Please also keep in mind that VT Markets will NEVER ask for any fee paid in advance to process your withdrawal request. If you find any suspicious websites/personnel using our brand abusively, let us know immediately by calling 400-120-8948, or emailing info@vtmarkets.com.

VT Markets is a Fintech-oriented Forex broker regulated by ASIC and CIMA, and is committed to provide our clients with top-tier Forex trading services. We always serve investors worldwide with a competitive low-cost products and a secure & transparent trading environment, and has won multiple awards in the past few years.

VT Markets cherishes and thanks all clients for your support and trust in us. we will continue to provide higher-end services through brand upgrades and product innovations in the future.

If you have any questions, our team will be glad to answer your questions. Please mail to info@vtmarkets.com or contact the service online.

Daily Market Analysis

Market Focus

U.S. stocks fell by the most in more than a week after Wells Fargo & Co. dragged down the banking sector in the wake of disappointing fourth-quarter results. Crude oil declined from a 10-month high as the dollar strengthened.

The energy and financial sectors led the S&P 500 into the red for a second day, with Exxon Mobil Corp. dropping 4.8% after a report said the company is being investigated for overvaluing assets. Utilities and real estate shares rose. Stocks were already lower in Europe and Asia as President-elect Joe Biden’s much-anticipated $1.9 trillion Covid-19 relief plan came under scrutiny. Optimism about the U.S. aid package had helped spur the so-called reflation trade, but the plan is far from a done deal. Biden’s proposal could be watered down under congressional opposition, and there’s the possibility that some taxes could rise.

Biden’s “American Rescue Plan” includes wave of new spending, more direct payments to households, expansion of jobless benefits and an enlargement of vaccinations and virus-testing programs as deaths record levels and local governments expand lockdowns.

Attention is now turning to how much of the package will ultimately get passed by Congress, with the go-big price tag and the inclusion of proposals set to be opposed by many Republicans. As lawmakers wrangle over details, U.S. jobless claims published Thursday painted a dismal picture and the U.S. is leading all countries in virus deaths with New York state reporting more than 200 daily fatalities for the first time since May.


Market Wrap

图表

描述已自动生成


Main Pairs Movement

The dollar is poised for the first weekly back-to-back rise since September amid mid-month position adjustments before a long weekend in the U.S. as risk appetite waned ahead of central bank meetings starting next week.

Investors are concerned that the Biden administration’s stimulus plan may struggle to win broad-based support and soft bank earnings. Haven asset demand rose following weaker-than-expected U.S. retail sales and reports the EU was notified Pfizer won’t be able to deliver scheduled vaccine volumes in full during the next 3-4 weeks. Treasury 10-year yields declined 3.7bps to 1.09%.

USD/JPY up marginally at 103.86 with pair whipsawed by cross-related selling and broad dollar buying; holds to narrow trading range of 103.62 to 103.90 as implied ease; finishes the week down less than 0.1%; EUR/JPY sinks as much as 0.6% to its lowest level in a month and a half.

USD/CAD rises 0.7% to 1.2733 after climbing as much as 1% amid a drop in WTI oil prices; pair finishes up 0.3% on the week; 1-week implieds rose to 7.25% ahead of a Bank of Canada meeting next week.


Technical Analysis:

GBPUSD (4 Hour Chart)

Sterling turn negative beneath 1.36 level from high at 1.37 amid dollar spur by risk sentiment, erasing a weekly gain. At the meantime, pair has also received tailwinds from a repricing of money market expectation for BoE negative interest rate policy (NIRP) in 2021 and beyond. For eco data, U.K. GDP(MoM) shrank 2.6% worse than last time after London lockdown second time. On the other hands, weaker-than-expectation Manufacturing Production record 0.7%.

From a technical perspective, short-term moving average indicator kick-start turn south side and long term moving average indicator slightly turn into downward. For RSI aspect, indicator slid beneath 50 slightly, set 43 as of writing, which suggesting a nascent bearish phenomenon. Due to aforementioned suggestion, we expect sterling will consolidate in range between first pivot support and resistance at 1.3618 and 1.354.

Resistance: 1.3618, 1.3678, 1.37

Support: 1.354, 1.3448


EURUSD 4 Hour Chart)

Euro dollars extend downside momentum to nearly one month low at 1.2078 as of writing, amid dollar posting one of its biggest increase since the early days of pandemic. ECB warning the fully effect of the pandemic crisis on euro-area banks has yet to be felt as policy support so far has masked losses, several ECB officials noted. “Euro-area banks are likely to face significant losses and further pressure on their already weak profitability prospect and must be extremely prudent on issuing dividends and ensure their capital is able to absorb their losses”, Irish governor said.

For price action aspect, it’s clearly that euro has tamp down a month-long “double top pattern” after breakthrough right shoulder at 1.2138. For Moving Average aspect, short term indicator consecutive downward slope, long term one as well. For RSI perspective, indicator showed 32 figure and close to over sought zone, suggestion a bearish side.

We could not preclude that euro dollar extended losses scenario combing all suggestion above. However, we still expect 1.2078 would be a critical support for price pattern, If not, the following second pivot support at 1.1995.

Resistance: 1.2138, 1.2211, 1.2251

Support: 1.2078, 1.1195


XAUUSD (4 Hour Chart)

After moved in a tiny gain yesterday, gold had difficultly extended retracement momentum amid lack of event and greenback soared up intraday. Gold continuously slid intraday to 1827.95 which is critical support level, as of writing.

From a technical perspective, gold is still on the way of bearish trend as 15-SMAVG consecutive upwind after it had slightly flat position. Meanwhile, 60-SMAVG indicator remained it descend trend momentum as bias is getting wide. On the other hands, RSI indicator is moving sideway below 50, set 37 girds, suggesting bearish further for short term a least.

We expect that 1817.77 would become a powerful support which is Jan 11 low and shoulder of W shape reverse pattern. Therefore, we believe the tamp down market will get limit while it approach first pivot support. However, if any fundamentally driver drag market down again, last lowest point in 1767 would foreseeable ahead.

Resistance: 1856, 1863, 1879

Support: 1827, 1815


Economic Data

Click here to view today’s important economic data.

Daily Market Analysis

Market Focus

US stocks fell for the first time in three days and Treasury yields climbed amid expectations of President-elect Joe Biden planning another round of Covid-19 relief of as much as $2 trillion. After approaching all-time highs most of Thursday, the S&P500 turned negative late in the trading session. Technology, communication services and consumer discretionary sectors were the biggest losers, while energy shares rose with oil. Biden is expected to announce his economic support plans later in the day. Federal Reserve Chairman Jerome Powell said policy makers won’t raise interest rates unless they see troubling signs of inflation. On top of that, the Fed Chair Powell held a brief Q&A event at Princeton University and spent most of his time in the discussion to address the Fed’s decision made during pandemic.

The five key takeaways from Powell’s remarks at Princeton Finance Event:

1.The Fed chair said that, with regard to the central bank’s bond-buying program, “now is not the time to be talking about exit.” He added that “the economy is far from our goals,” and that “when it does become appropriate for the committee to discuss specific dates” for tapering of purchases, it would be done “well in advance”.
2.Powell downplayed the inflation that forecasters expect to see in the US this year. When asked about it, he focused his answer on the job market instead and the amount of damage that will need to be repaired on that front, reinforcing the dovish tilt to the Fed’s current policy stance.
3.Powell brushed off various concerns the moderator raised about corporate and public leverage, suggesting those wouldn’t affect the Fed’s interest-rate decisions.
4.The Fed chair also gave a post-mortem of sorts on the central bank’s emergency lending facilities that were launched in the early days of the pandemic and shuttered at the end of 2020. He had high praise for the corporate and municipal bond market backstops, whereas the Main Street Lending Program he admitted had some important conceptual flaws.
5.Powell also discussed how the Fed can contribute to the fight against inequality, an insight that emerged from the policy framework review the Fed conducted over the course of 2019 and much of 2020. Expect to hear more from Fed officials on that in the coming years as it plays into their assessments about how close the economy is to their goal of maximum employment.


Market Wrap

图表

描述已自动生成

Main Pairs Movement

EURUSD is currently trading at 1.1257 having travelled between a range of 1.2111 and 1.2179 on the day so far, catching a bid on Federal Reserve Jerome Powell’s remarks. GBPUSD extended its rally in the second half of the day and touched its highest level since May 2018 at 1.3709. The broad-based selling pressure surrounding the greenback continues to fuel the pair’s upside. After dropping below 0.7750 in the early American session, the Aussie turned north supported by the broad selling pressure surrounding the greenback.

The US dollar index flirts with tops near 90.65, then retreated down to the 90.240 region post Powell’s comments. WTI crude oil currently trades flat during what has thus far been choppy directionless trade. Front-month WTI futures currently trade just beneath the $53.00 level as market await key Biden speeches.


Technical Analysis:

USDJPY (4 Hour Chart)

USDJPY erases most of its gains from the two-consecutive-day win streak of the pair at the time of writing. Despite the bulls’ efforts to push USDJPY to its weekly high near 104.20 in the earlier session, the dollar still slides substantially after the markets processed the highly anticipated Fed Chair Powell’s comments at Princeton Finance Event. The major dragging force that weighs on the greenback was Powell’s comment on the forecasted inflation across the U.S. economy. According to Powell, the central bank won’t hike until it sees troubling inflation or imbalances. Additionally, he mentioned that he could see upward pressure on prices near-term, but bank has tools to quell unwelcome price gains. Finally, he focused on the job market, rather than on the amount of damage that would need to be repaired to reinforce the dovish stance the Fed is currently upholding.

Powell’s comments greatly impacted the fluctuations of most USD rivals, one in particular is the USDJPY as the pair turned south at 104.13 and bottomed near 103.55. From a technical perspective, the comments of Powell has inevitably turned the RSI neutral, but the support at 103.65 has offered some crucial cushion for the bulls to catch a breath. The 21-Day SMAVG is still signaling a bullish trend for the pair; however, the bulls must first find acceptance above the 104 resistance level to resume its bullish momentum.

Resistance: 104.00, 104.25

Support: 103.65, 103.55, 103.42


USDCAD 4 Hour Chart)

Backed by the strong performance of the Oil, the CAD continues to exert its dominance over the USD on Thursday with the Loonie pair currently trading around the weekly low near 1.2630. Not to mention the fact that the comments made by Fed Chair also contributed to the breakthrough of the Loonie below the numerously tested support at 1.2670. Technically speaking, the break below the crucial support 1.2670, which has turned into the most immediate resistance for USDCAD, officially marked a death cross on the SMAVG, indicating that the Loonie is about to head further south. If the Loonie break below the support at 1.2630, the next cushion would be seen at 1.2546, a price that was last seen in 2018 Apr. Given that the RSI is now bouncing around 37, it is inferable that while an upward correction may be around the corner, there is still room for USDCAD to dip before staging an positive correction.

Resistance: 1.2670, 1.2705, 1.2745, 1.2840

Support: 1.2630, 1.2546


XAUUSD (4 Hour Chart)

The gold traders experience a roller-coaster type of day as the XAUUSD first dove drastically from the high of $1852 to $1829, then rose extensively post Powell’s comments to the daily high above $1857, and the yellow metal has now retreated back down to $1846. The next most heavily anticipated event is US President-elect Joe Biden’s reveal of the next fiscal stimulus plans (this should take place at 00:15 GMT). Currently, one possible plan is a larger than $2.0 trillion bill that is likely to include a significant child benefit spending but might not be supported by Biden’s Republicans counterparts in Senate. Now, given that Biden would need 60 votes in the Senate to pass the bill, as a result, the markets are heavily eyeing an alternative bill.

From a technical perspective, the XAUUSD is still on a bearish trend as indicated by the strong 60-Day SMAVG and the RSI. Additionally, as the MACD line is now staging a cross below its signal line, the bearish momentum is further confirmed. If XAUUSD drops below the most immediate support near $1839, the next support would be $1827, then $1815. Conversely, if the weakened greenback persists and pushes the XAUUSD up, the first resistance the bulls would have to break would be found at $1856, followed by $1863 and $1879.

Resistance: 1856, 1863, 1879

Support: 1839, 1827, 1815


Economic Data

Currency

Data

Time (TP)

Forecast

USD

Fed Chair Powell Speaks

01.30

N/A

GBP

GDP (MoM)

15.00

N/A

GBP

Manufacturing Production (MoM)(Nov)

15.00

0.9%

GBP

Monthly GDP 3M/3M Change

15.00

N/A

USD

Core Retail Sales (MoM)(Dec)

21.30

-0.1%

USD

PPI (MoM)(Dec)

21.30

0.4%

USD

Retail Sales (MoM)(Dec)

21.30

-0.2%

Daily Market Analysis

Market Focus

Stocks rose and benchmark Treasury yields retreated for a second day amid optimism the economy will continue to benefit from government support.

Technology shares led gains, with the Nasdaq 100 outperforming the benchmark S&P 500. Intel Corp. jumped 7% after the chipmaker named a new chief executive. Treasury received strong demand for a second consecutive day at a government debt sale, helping to send yields down from the highest levels since March.

In Washington, the House of Representatives is voting to impeach President Donald Trump for a second time. A Senate trial for Trump won’t likely get under way before his term ends on Jan. 20.

In Europe, European Central Bank council member Francois Villeroy de Galhau said the ECB will keep an easy stance for as long as needed, and U.S. investors took comfort from remarks by two Federal Reserve officials that pushed back on the possibility of tapering bond purchases anytime soon.

Europe’s Stoxx 600 was flat, with losses in banks and travel shares outweighing M&A announcements. Among the day’s winners, French grocer Carrefour SA rallied after Alimentation Couche-Tard Inc., the convenience-store giant that owns the Circle K chain, said it’s exploring a transaction.


Market Wrap

图表

描述已自动生成


Main Pairs Movement

The greenback held gains as the House of Representatives moved forward with impeachment proceedings while shares and Treasury bonds were firm after Federal Reserve Governor Lael Brainard pushed back against suggestions the central bank could taper its bond buying program later this year. The loonie outperformed amid cross-market flows.

Meanwhile, Treasury yields remained lower after Brainard said bond buying will be needed for “quite some time”. Boston Fed President Eric Rosengren also said the Fed will continue to purchase longer-term assets until economic growth is on a stronger footing.

The Canadian dollar was the only currency higher against the greenback. The greenback remains higher against most of its Group-of-10 peers, with biggest gains vs high-beta Scandinavian and South Pacific pairs.

The common currency pared losses amid demand in the futures market after falling to session lows following news former Prime Minister Matteo Renzi plans to pull his party’s ministers from Italy’s governing coalition.


Technical Analysis:

GBPUSD (4 Hour Chart)

Sterling slid further from daily highest 1.37 level to 1.36 during the American session. It is trimming some of Tuesday’s hover after being unable to toward above momentum amid greenback recovery. Sterling was among the top performers still boosted by yesterday’s comments from BoE governor who was cautions about negative interest rates. On Wednesday, reports about vaccines in the British also offered support to the sterling that printed monthly highs versus the euro before pulling back.

From technical aspect, sterling is correcting lower after approaching a psychological barrier at the 1.37 level. As price action, we expect that 1.36 would be a critical support for bullish aspect. If not hold above that, it would be continuous choppy movement or even slipped further. For RSI aspect, indicator still place above 50 that set 54 as of writing, remained upward suggestion. For Moving Average perspective, short-term propel upward which is testing golden cross with long-term one at current stage. The fly in the ointment that long-term moving average indicator is losing momentum to toward upwind. Therefore, combing all suggestion, we expect sterling price will under pressure further if price tamp down 1.362. On the other hands, price hold above critical support that would give it ascend momentum.

Resistance: 1.3678, 1.3700

Support: 1.362, 1.354, 1.3448


EURUSD 4 Hour Chart)

After euro dollar ebbed down 1.2211, which is a main support, price keep back-and-forth in range 1.2211 and 1.2138. As greenback gain ground, the move came alongside the fall in U.S. yields following a bond auction on Tuesday. Other side, market participants are eyes on ECB Monetary Policy Statement tomorrow. Governing council member comments that the ECB needs the ability to exceed 2% inflation without it triggering monetary policy tightening could serve as a bit of “indirect jawboning” and help to slow the euro’s climb versus greenback.

For technical view, RSI indicator slipped below 50 which suggesting a bearish momentum forward. For Moving Average, both short and long-term indicator are exacerbating at current stage. Although upwind currently, short-term indicator is getting flat lope after lasting drop. Therefore, we are still pessimistic for ascend movement as suggesting above. Nonetheless, if price hold above 1.2138 which is a critical days-long-support, it would give it a consolidate chance.

Resistance: 1.2211, 1.2251

Support: 1.2138, 1.2078


XAUUSD (4 Hour Chart)

Gold had choppy movement all day between first pivot support and resistance after retreated from last recently low. At the meantime, U.S. 10 years Treasuries yield had a 2-day consecutive slipped which gave gold market a coup for short period. Market participant is looking on bond market of negative correlation that might undermine of gold captive whilst yields creepy up.

For RSI aspect, indicator remained bearish momentum suggestion for short term as it stayed 41.2 gird. For Moving Average aspect, short and long-run upend to lower level without flat signal.

Resistance: 1863, 1878, 1900

Support: 1844.56, 1838, 1827


Economic Data

Click here to view today’s important economic data.

Daily Market Analysis

Market Focus

US stocks edged higher and benchmark Treasury note yields lingered at 10-month highs as investors mulled the prospects of the economic recovery and vaccine rollout. The SP 500 closed in the green after fluctuating between gains and losses most of the trading session, with the energy, materials and consumer discretionary sectors leading gainers. The Dow Jones Industrial and Nasdaq Composite rose more than the benchmark index. Crude Oil approached a 11-month high as the dollar weakened following a three-day rally. Corn futures surged by the exchange limit to the highest level for a most-active contract since May 2014.

The mood across markets remained mostly positive even as investors assessed how the rise in Treasury yields changes the financial landscape. While progress on a vaccine gives reason to be hopeful, there are lingering concerns over the speculative excess and froth that’s driven stock markets to all-time highs in the middle of a pandemic.

Yields on Treasury 10-year notes pared an earlier rise after a government auction of $38 billion of the securities was met with solid demand. The spread between the rate on the two- and 10-year notes had risen every single day this year as investors bet on additional US fiscal stimulus, spurring more bond issuance and higher yields on longer-maturity Treasuries.

According to David Bianco, chief investment officer of the Americas at DWS Group, “what I think investors are most focused on is the digesting of what is shifting fiscal policy. We’re beginning to lose the anchor on some long-term key benchmark interest rates.”

Market Wrap

图表

描述已自动生成


Main Pairs Movement

EURUSD has seen significant upside in recent trade, rallying above the Monday high and the 1.2200 level. The pair had previously been rangebound either side of the 1.2150 mark, before a broad weakening of the US dollar since the start of US trading hours that sent it to the bottom of the G10 performance table. The Aussie resumed its advance in the US afternoon, as the greenback keeps losing its shine. Wall Street’s modest advance providing additional support. Despite the downside in USDCAD, CAD net long positions drifted lower but have held in positive territory for the past three weeks having bounced sharply in late December.

The US Dollar Index has seen modest losses on Tuesday and is eyeing a test of weekly lows in the 90.00s. WTI rallies above the $53.00 level, eyes test of the February 2020 $54.45 high during the European trading session, but soon drop back to the $52.50 by the start of US trading hours.


Technical Analysis:

GBPUSD (4 Hour Chart)

Based on the statements made by Bank of England Governor Andrew Bailey and the leading position UK currently holds among its developed countries peers on vaccination races, the GBP has been outperforming most G10 currencies at the moment. During the early European session, BoE Governor Andrew Bailey claimed that the “negative rates” is a controversial issue and that there are a lot of issues with negative interest rates, which in turn, becomes a statement that provided the markets with the strongest sense of the Governor’s rebuke of the policy. Bailey’s words backed the global investors to put their bet on Sterling. On top of that, given that UK has reported to have vaccinated 4% of its overall population their first jabs (the U.S. only has 3% of its population vaccinated), markets participants are gradually shifting their interest towards the UK because the faster a country can get its people vaccinated, the more prospering the country’s economic outlook can be.

With the Cable pair recently broke above the 1.3620 resistance and is still heading north, it is likely that the fresh buying demands would push the pair to around its next resistance at 1.3673. This bullish run is supported by the MACD, and with the RSI currently fluctuating around the lower 60, there seems to be some room for the pair to further extend its journey up north. On the flip side, if the pair dipped low, the first cushion would be found around 1.3547, then 1.3505.

Resistance: 1.3620, 1.3673, 1.3700

Support: 1.3547, 1.3505, 1.3450


USDJPY 4 Hour Chart)

After advancing towards the multi-weekly highs around 104.40 yesterday, the diminishing DXY (which is trading around 90.085 at the time of writing) has pulled the USDJPY back down below the 104 price level as the pair is now fluctuating near 103.80. The weakness surrounding the USD continued to be the main factors that prevent the USDJPY from further advancing. Particularly speaking, as the 10-year yields dropped back from the highs above 1.17% after a strong auction and a subsequent drop in yields appears to be weighing on the USDJPY pair. After breaking below the 104 price zone, which the pair has been consolidative above, the weakness surrounding the USD is more likely to pull the pair down to its most immediate support at 103.79 then to find fresh demand for the pair to form a rebound. Not to mention the fact that the RSI of the pair is still sitting around the high 40s, suggesting that there is still room for the pair to dive before entering the oversold region and begin a positive correction. If the bearish trend extends, global investors can expect the pair to move towards the 103.40.

Resistance: 104.25, 104.08

Support: 103.79, 103.63, 103.40


XAUUSD (4 Hour Chart)

XAUUSD climbed back up substantially after falling sharply near $1938 level. The pair is now trading around $1850, which is about the same level it closed on Monday. The extensive bounce back of XAUUSD is largely caused by the weighed down greenback amid an improved markets’ sentiment. Technically speaking, the gold is still under bearish pressure as the 60-Day SMAVG still hovers above the 20-Day SMAVG. Now, given that the RSI is trending around 45, this reading suggests that without any confirmative news or change in markets’ sentiment, the pair is likely to remain consolidative between $1863 and $1838 because no trading bias has taken over the price action of the pair. If the pair can penetrate the resistance above $1863, the bullish uptrend can take XAUUSD towards $1878. Conversely, the cushion for XAUUSD traders can be found near 0.618 Fibonacci Retracement at $1844.56, then followed by $1838 and $1827.

Resistance: 1863, 1878, 1900

Support: 1844.56, 1838, 1827


Economic Data

Click here to view today’s important economic data.

VT Markets Notification of trading adjustment in holiday

Dear Client,

Please note change of the following some products due to the Martin Luther King Day, Australia Day.

If you have any questions, our team will be happy to answer your questions. Please mail to info@vtmarkets.com or contact the service online.

Daily Market Analysis

Market Focus

U.S. stocks fell for the first time in five sessions as investors started the week in a cautious mood with equity prices near all-time highs. The S&P 500 was led lower by the real estate and communication services sectors, while energy companies were the biggest gainers in the benchmark index. The dollar strengthened against all its major peers, with demand supported by elevated Treasury yields.

Weighing on the minds of investors are worries that equities are running too hot and valuations are stretched at a time when major parts of the world are grappling with the worst of the pandemic.

Benchmark Treasury yields topped 1% last week on bets that Democratic lawmakers will enact big spending packages to drive the economic recovery out the pandemic. The move reset expectations for a range of asset classes and sparked debate over whether higher yields might jeopardize the current environment of easy financial conditions. Ten-year U.S. yields climbed to 1.136% on Monday, the highest level since March.

Bitcoin tumbled, with prices sliding as much as 20% on Monday. Some investors have said the digital currency’s recent gains defy logic and the U.K.’s financial watchdog issued a statement that consumers in crypto should be prepared to lose all their money. The token traded down 13% at $33,160 as if writing.


Market Wrap

图表, 条形图

描述已自动生成


Main Pairs Movement

The dollar is on pace for its biggest three-day rally since September as the House will consider an article of impeachment against President Trump on Wednesday. The euro and yen held lower levels ahead of large options expirations set for Tuesday. Seasonal trends, which are favorable for the greenback in the early part of the year, support the currency.

The dollar also rose as speculative accounts cut their long bets on the euro, pound, and Australian dollars during the week through Jan. 5, according to data from the Commodity Futures Trading Commission.

The yen was the most resilient against the dollar while commodity currencies lead losses; the Norwegian krone was the worst performer. USD/JPY is +0.2% to 104.15; after climbing to 104.40, the highest in a month. The yen could gravitate towards the 104.00 level, a strike where $1.2b expire on Tuesday, trader says.


Technical Analysis:

AUDUSD (4 Hour Chart)

Aussie got beaten and under pressure as strengthen greenback threating the commodities-linked currency characteristic. Aussie pair dropped to the lowest in one week the previous day amid dollar momentum and Sino-Australia intense. Although the COVID-19 spread and the U.S. political jitters join tension between America and China to challenge the risks, expectations of heavy stimulus from Washington take the support of vaccine hopes to keep the bears away.

From technical view, short-term SMAVG indicator slide to negative side, but long-term remained upward momentum. Another one, RSI indicator close at 42.5 which suggesting a trifling bearish guidance. All of all, aussie movement seemingly mixed as technical suggestion, moreover, market news would impact the price change, especially for global trade news.

Resistance: 0.7778, 0.78

Support: 0.7691, 0.7647, 0.762


EURUSD 4 Hour Chart)

Euro dollar extended the descend trend at the start of this week as the greenback consecutive to recover from the near-3- year low hit last week as U.S. yield climb. As price action, euro seemingly breakthrough a m shape shoulder then fell to multi-day lows.

For Moving Average aspect, short-term indicator had death cross long-term indicator that suggesting a bearish perspective. For RSI aspect, indicator hold in bearish zone at 33 which is so close to the over sought area.

As the suggestion of technical perspective, we expect euro will continues under pressure of downward trend. However, price action is suggesting a critical support pivot at 1.2151 and 1.2078 follow behind.

Resistance: 1.2211, 1.2251

Support: 1.2138, 1.2078


XAUUSD (4 Hour Chart)

XAUUSD consecutive choppy all day as greenback continuous edged up which would typically be negative move for gold and treasury yield went up to nearly 9 months highest. Both of these factors would turn gold less captive as reduce the incentive to hold over fixed income and needless for hedge inflation.

For Moving Average aspect, short-term indicator had death cross long-term indicator that suggesting a bearish perspective. On the other hands, RSI indicator show 35 which turn back from over sought area at 17 once, nonetheless, it still mire in bearish momentum at currently stage. As the following suggestion, we expect gold market will still hold on current price channel which gap between first pivot support and resistance. Moreover, if price consecutive went flip side, the third pivot support should be a critical level. Otherwise, market seemingly will continue drop to year before low.

Resistance: 1865, 1878, 1900

Support: 1843, 1827, 1814


Economic Data

Click here to view today’s important economic data.

Back To Top
server

Hello there 👋

How can I help you?

Chat with our team instantly

Live Chat

Start a live conversation through...

  • Telegram
    hold On hold
  • Coming Soon...

Hello there 👋

How can I help you?

telegram

Scan the QR code with your smartphone to start a chat with us, or click here.

Don’t have the Telegram App or Desktop installed? Use Web Telegram instead.

QR code