Daily Market Analysis
Market Focus
US equity market took a hit at its opening on Tuesday ahead of Powell testimony, the S&P 500 Index declined as much as 1.8% whereas the Nasdaq 100 plunge reached 3.5%. These losses were mostly pared after reassuring comments from the Fed chairman Jerome Powell on inflation and the outlook for growth. Energy stocks and Media stocks were leading the gains, while Food & Staples Retailing and Auto sectors lagged behind in the S&P 500 Index.

President Joe Biden on Tuesday indicated the congressional vote for the proposed $1.9 trillion stimulus package will be close. The House Budget Committee pushed Biden’s pandemic-relief legislation, setting it up to pass the lower chamber by the end of this week. Even Biden seems to be quite confident in finalizing a bipartisan deal, but Senator Susan Collins told reporters she doesn’t see a single GOP vote the President’s pandemic relief bill.
Bloomberg’s key takeaways from Federal Reserve Chairman Jerome Powell’s testimony before the US Senate Banking Committee:
Market Wrap

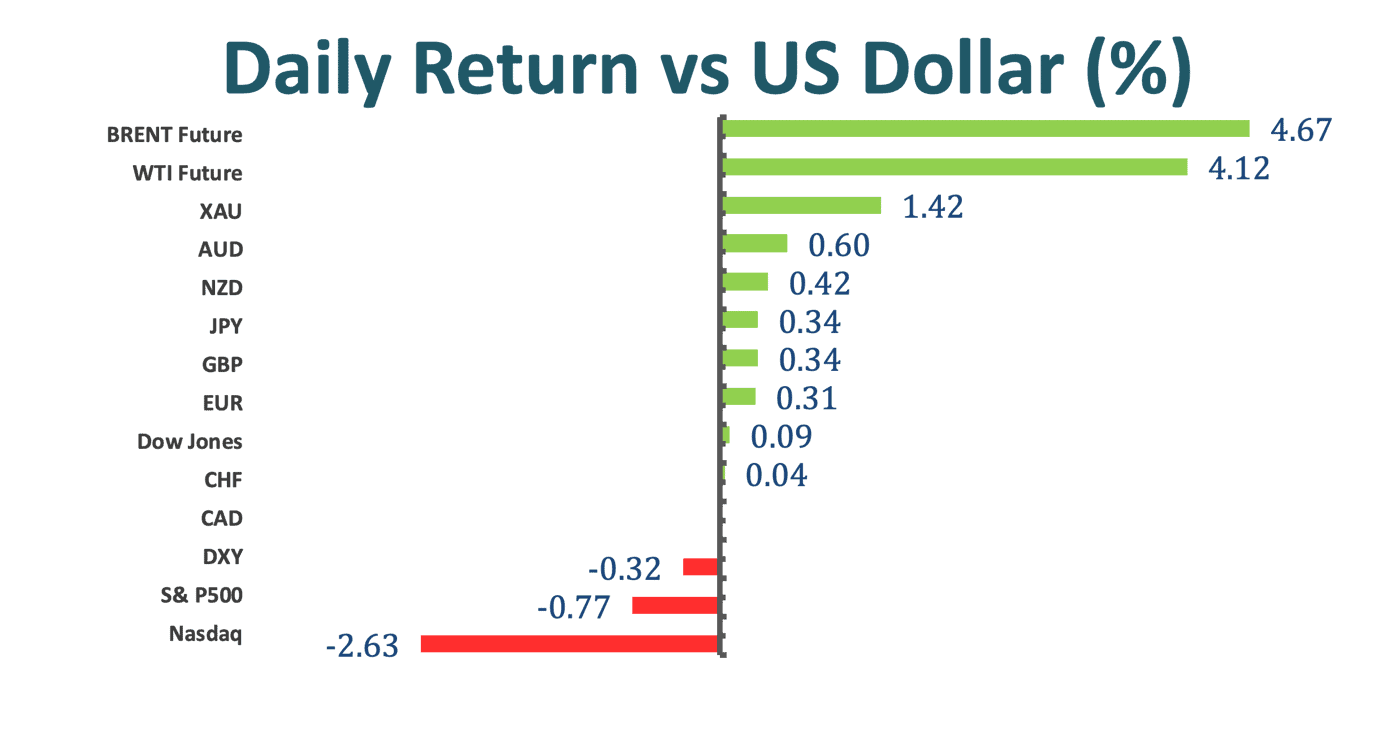
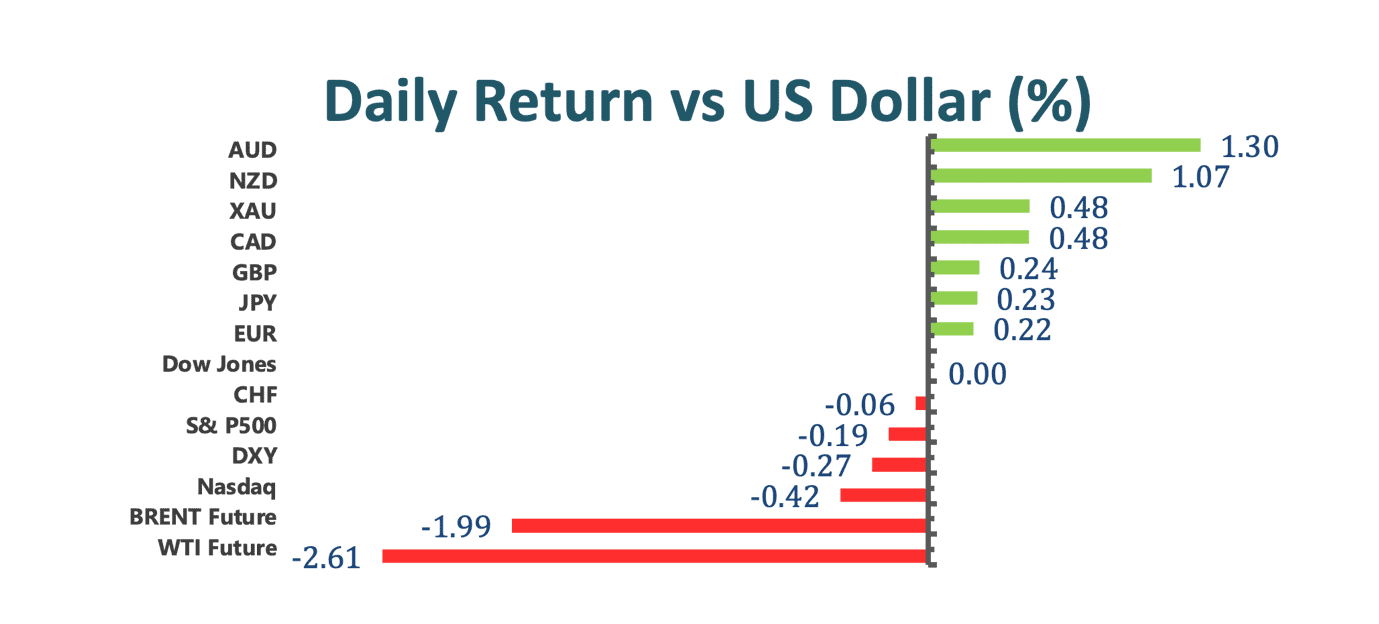
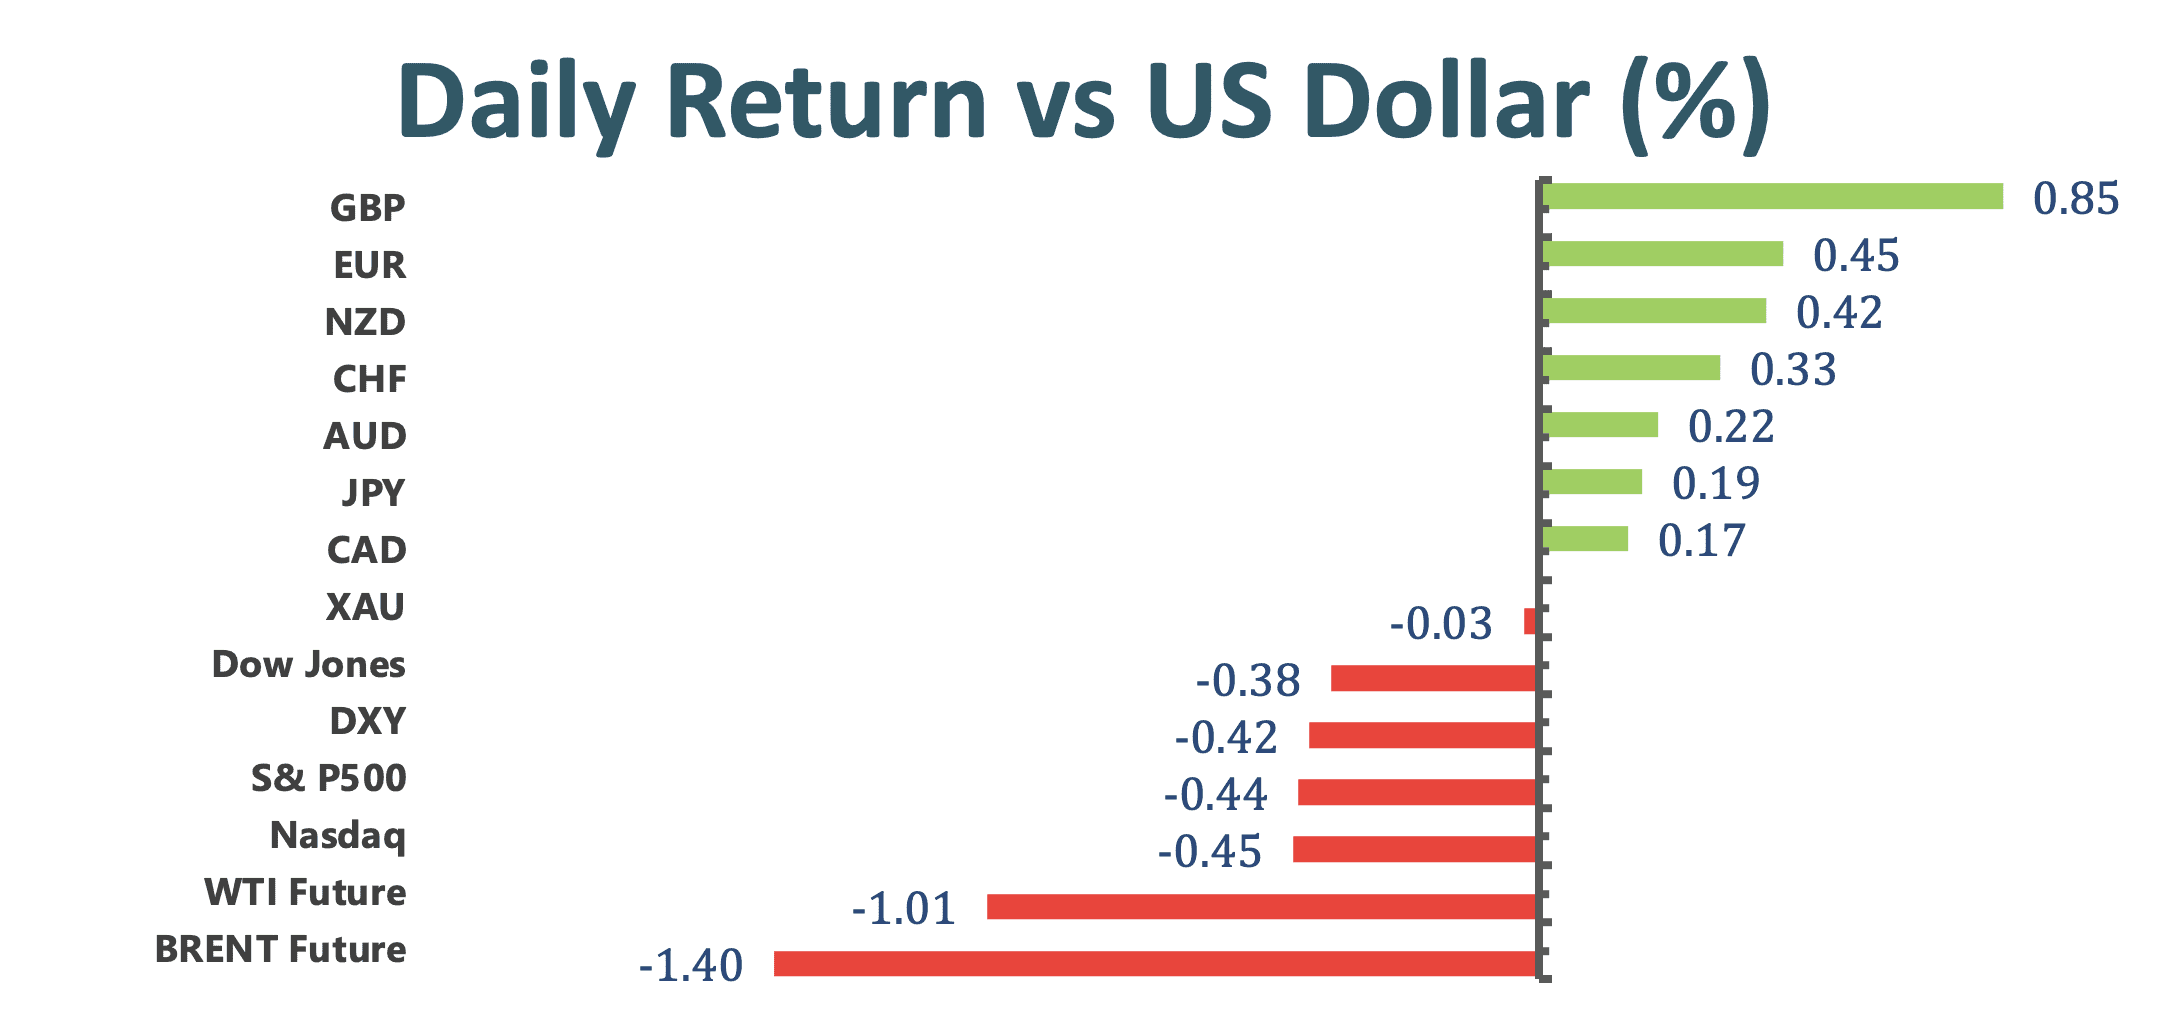
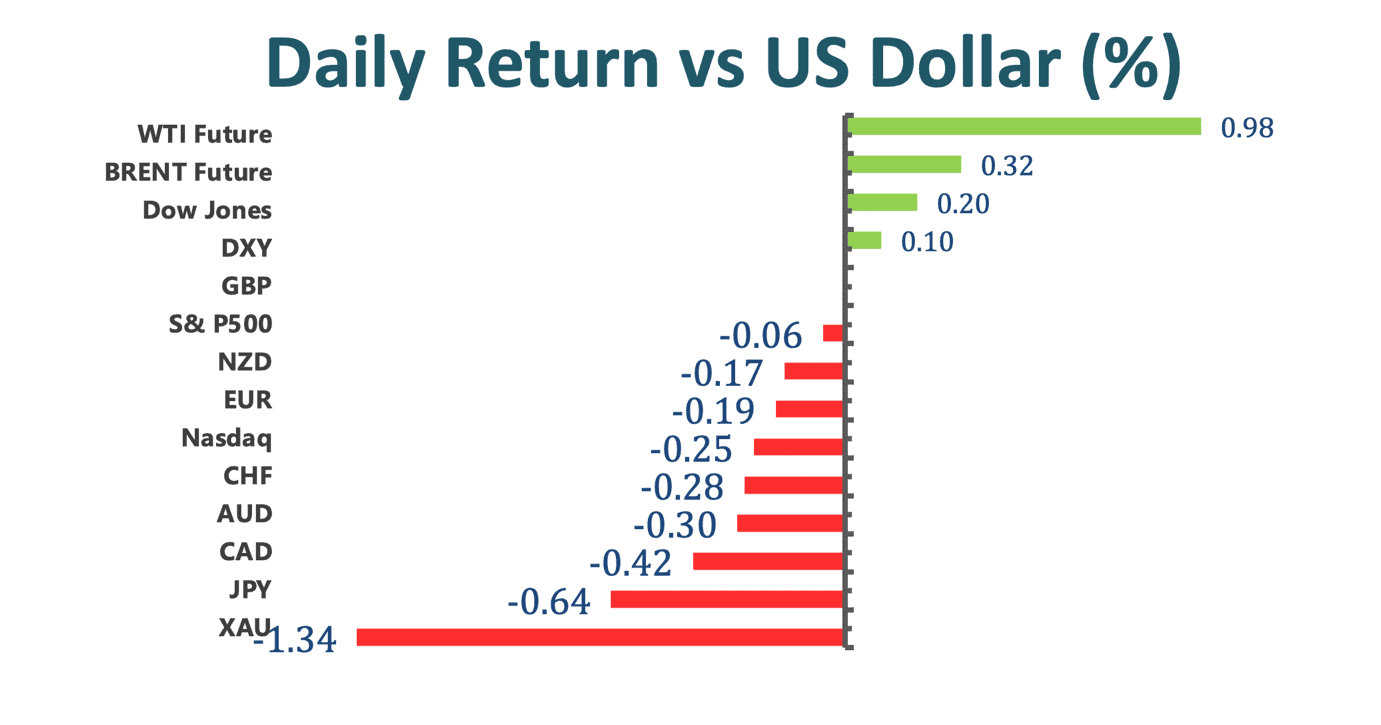
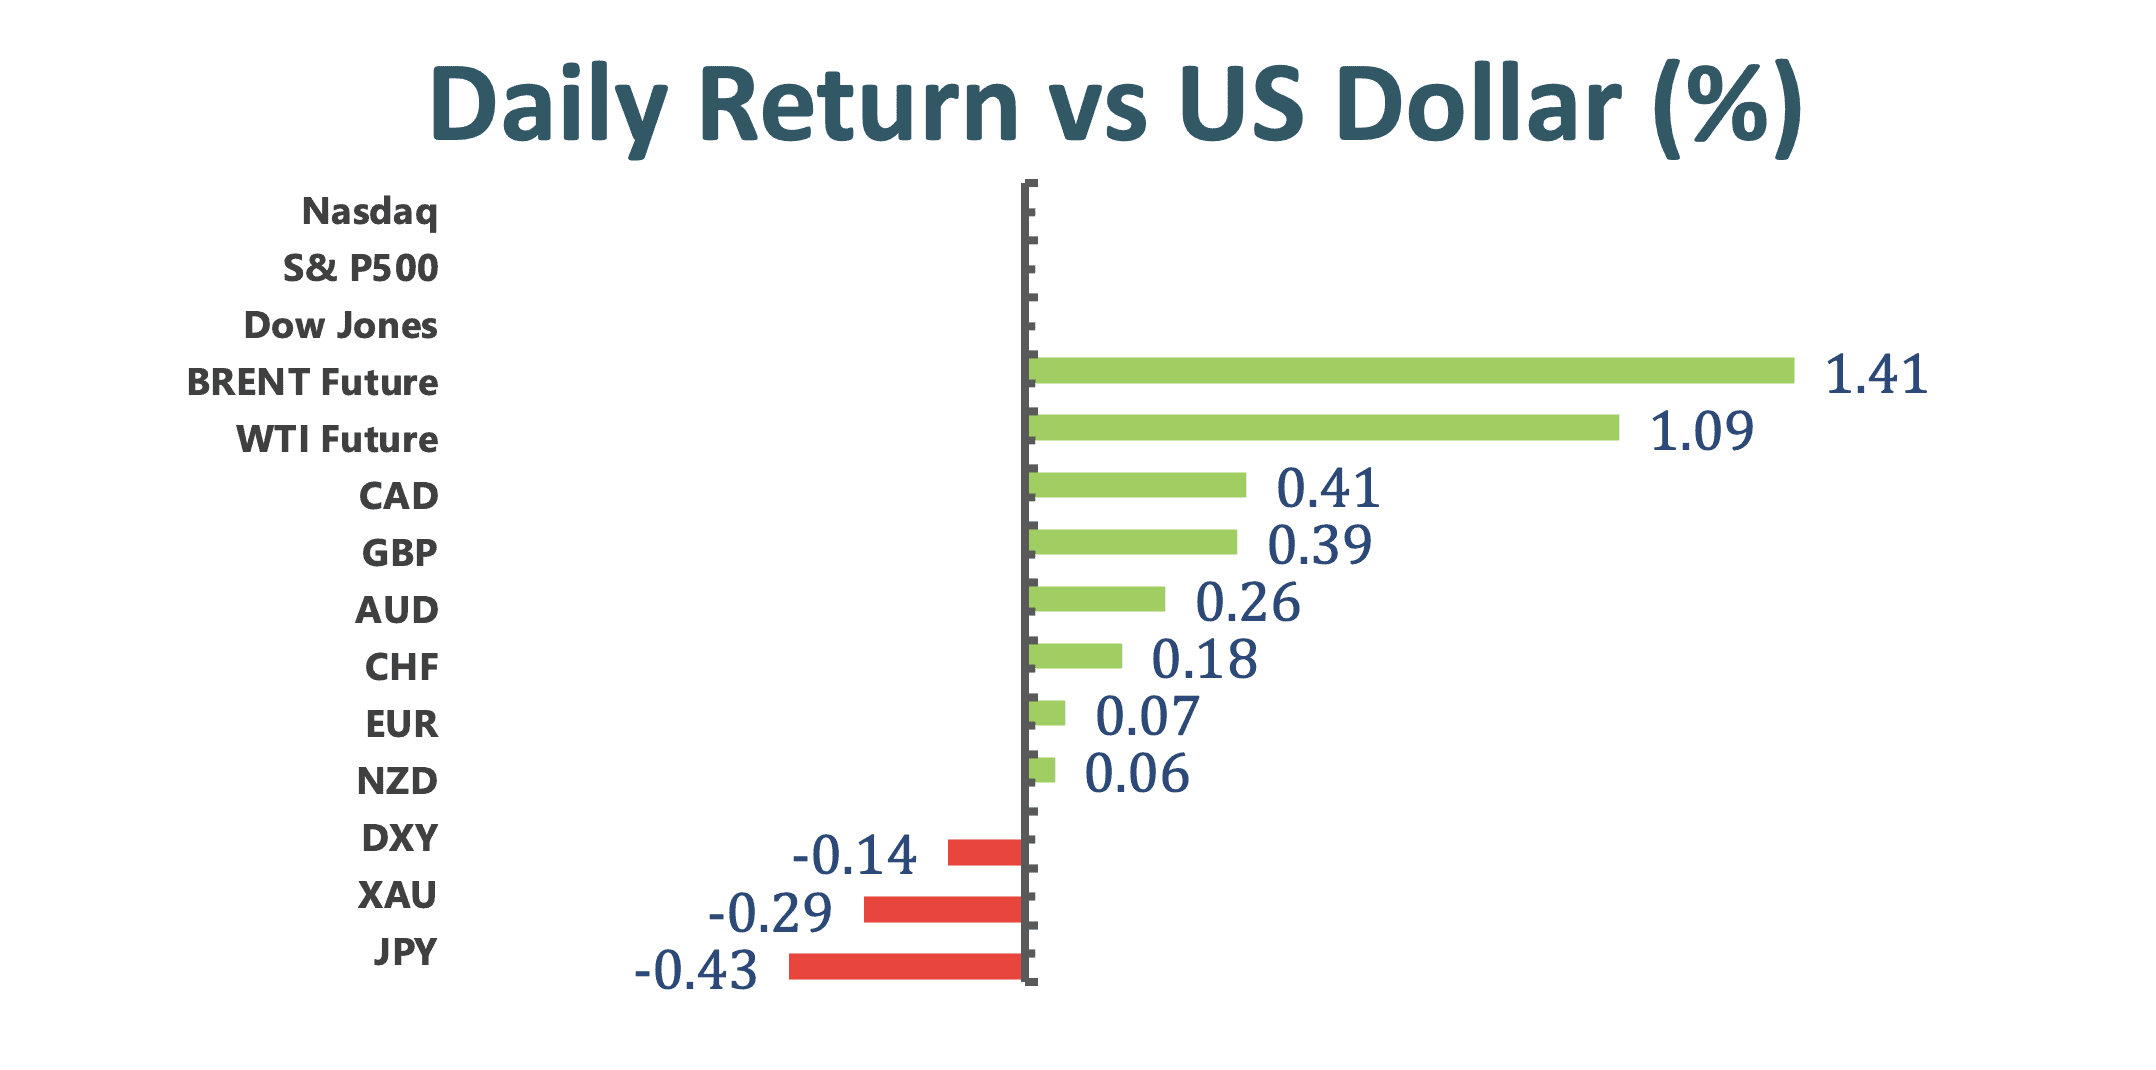
Main Pairs Movement
Euro dollar recovery stalled albeit Powell was pouring cold water on the US greenback, the pair dipped 0.08% on Tuesday. Meanwhile, the dollar index gained 0.14% to 90.13.
The Sterling outperformed the US dollar amid upbeat employment data, rallied 0.37%. According to the official release, the ILO unemployment rate hit 5.1%, as expected, in the three months to December. Average Earnings Including Bonus in the same quarter were up 4.7%, beating the 4.2% expected. Also, the number of unemployed people decreased by 20K in January, much better than the 35K increase anticipated.
The European safe-haven Swiss Frac was the worst performer among its G-10 peers against the US dollar, USDCHF soared 1.03%. This move somewhat resembles recent rally in USDJPY. The surging US 10-year treasury yield took a pause on Tuesday, it is currently hovering above 1.34%. As long as yield are hanging high, then investors will shift their attention away from safe-haven currencies.
Bitcoin relentlessly plunged as much as 17% on Tuesday, reached lowest price in three weeks, closed the day down 11%. Meanwhile, Ethereum was more volatile, plummeted as much as 24%, and pared half of its loss near end of day.
Technical Analysis:
EURCHF (Daily Chart)


EURCHF refreshed new highs since November 2019, currently trading around 1.0983. The pair is on a six-winning streak after trapping between 1.089 and 1.0742 for four months, and is looking to contest resistance of 1.1057. It is well bolstered by an ascending trendline, but the recent spike seems to be running ahead of itself, RSI of 79 may prompt some pullbacks before it could resume its bullish run. The sudden surge was powered by rising 10-year European bond yields as indicated in yellow curve. This pair could be exposed to potential downside risk since higher Euro could draw ECB’s attention to intervene.
Resistance: 1.1057, 1.1187
Support: 1.089, 1.0742, 1.0672
GBPUSD (Weekly Chart)

The Cable continued to capitalize on its gain, taken down multiple hurdles along the way. The bulls seem to be invincible as strong fundamentals act as a backdrop for the Pound. It has been edging higher and higher while staying well within upper Bollinger band since last July. That being said, it will soon run into 1.416 resistance, combined with overextended RSI of 72.3 on the weekly chart, we could finally see some retreats triggered by profit taking orders. However, the bullish bias for Sterling will be here to stay throughout 2021. On the downside, 1.38 handle would be a nice cushion to fall on.
Resistance: 1.416, 1.4377
Support: 1.38, 1.338
XAUUSD (Daily Chart)


Gold recovered some ground after failing its second attempt to breach below support line of $1765. Currently, it is retracing back towards $1823, which it spent quite some efforts to penectrate. This former support would likely to turn into a strong resistance for the yellow metal to overcome given its recent bearish bias. We have seen consistent unloading from few of the largest Gold ETF such as the SPDR Gold ETF and iShares Gold Trust. If our theory is on point, then the bears will be threatening to breakthough 50% Fibonacci of $1765, followed by $1691.
Resistance: 1823, 1872
Support: 1765, 1691
Economic Data
|
Currency |
Data |
Time (TP) |
Forecast |
||||
|
NZD |
RBNZ Interest Rate Decision |
09:00 |
0.25% |
||||
|
NZD |
RBNZ Rate Statement |
09:00 |
|||||
|
NZD |
RBNZ Press Conference |
10:00 |
|||||
|
EUR |
German GDP (QoQ) (Q4) |
15:00 |
0.1% |
||||
|
USD |
Fed Chair Powell Testifies |
23:00 |
|||||
|
USD |
New Home Sales (Jan) |
23:00 |
855K |
||||
|
USD |
Crude Oil Inventories |
23:30 |
-5.19M |
||||