Daily Market Analysis
Market Focus
US stocks gave back some of yesterday’s gain, the three big indices closed the day in red. Technology stocks led losses in the S&P 500, while Material stocks prevailed. EV manufacturer giant Tesla Inc. dropped 4.46%, dragging down the Nasdaq 100 Index. Interesting to note Bitcoin’s price is somewhat synced with Tesla Inc. recently, Bitcoin is down 4.06% as of writing.

The Federal Reserve is pushing banks to abandon the London Interbank Offered Rate (LIBOR). Banks now have less than a year before the Fed has indicated it will stop allowing them to enter into new contracts pegged to Libor. The Fed is probing into banks’ Libor related exposure and possible contracts tied to the benchmark. The probing comes after the Fed warned banks in November that entering into new Libor-linked deals after 2021 would pose significant risks.
China’s President Xi Jinping will approve a five-year policy blueprint to reduce dependence on the West during an annual session of China’s legislature. Trillions of dollars will be mobilized to build self sufficient supply chain such as computer chips. Investors should pay close attention to the National People’s Congress session, which starts Friday and will last about a week.
RBA kept policy rate unchanged at 0.1%, here is Bloomberg’s main takeaways for RBA’s monetary statement:
Market Wrap

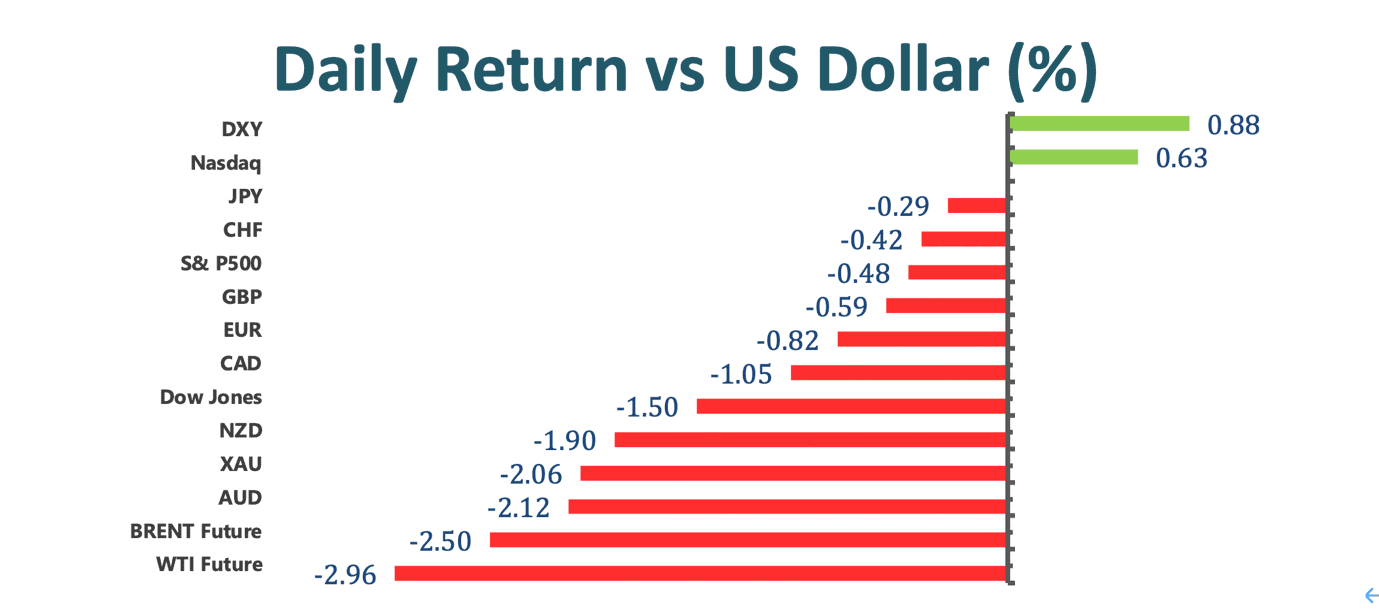
Main Pairs Movement
Euro-dollar once dipped below 1.2 in early session, but managed to gather enough strength to overturn the bearish bias. ECB president Christine Lagarde remains committed to ongoing economic recovery, saying on Monday that “ECB will ensure financing conditions will not tighten prematurely.”
Aussie reclaimed 0.78 as US greenback lost traction, and traders are back to the reflation trades. The commodity linked currency are receiving strong support from rising Iron Ore prices. Bloomberg commodity index plunged during last Thursday’s bond yield panic, but we are already seeing price recovery today. On the other hand, Kiwi is still lagging behind its antipodean peer albeit outperforming the US dollar by 0.49%, AUDNZD gained 0.3%.

Cable recovered 0.31% and snapped three losing streaks. Investors are waiting to hear UK’s budget announcement on Wednesday. The larger than expected budget could offer some bid potentials for the Sterling, possibly regaining 1.41 handle in the short term.
Gold swung between positive and negative territory on the day, ended the day up 0.63%. The precious metal furiously plunged $16 in early Asian session, hitting as low as $1707. Then bounced back to $1736 nearly EOD. Meanwhile, the 10-year US Treasury yield is clinging to 1.4% level.
Technical Analysis:
EURGBP (Daily Chart)

Euro has been defensive against Sterling since last December, the steep decline was put to a pause after RSI threatened to breach 20. It then tried to bounce back up, but the recovery did not last very long, and the bulls were capped by the upper descending trendline. Continuation to the south would give bears a chance to contest 76.4% Fibonacci support around 0.8565, if this level could hold off then price could undergo a double-bottom, gathering momentum for a bullish reversal. RSI on the daily chart is likely to resume its downward trend until hitting oversold zone before pulling up.
Resistance: 0.8744, 0.8888
Support: 0.8565, 0.8277
USDJPY (Daily Chart)

USDJPY is running into key 107 hurdle for the first time in six-month, the bears look to end the pair’s five consecutive run-up, and is currently trading around 106.74. The Relative Strength Index has been acting as decent predictive indicator on price retreats during the last month, whenever the RSI hits 70, the pair pulls back from the tops. Moreover, prices have been falling back onto the ascending support trendline. As of current, RSI is wondering around 70, and we expect this RSI-trendline synergy to kick in once again. Price will likely be traveling south toward the trendline.
Resistance: 107, 108
Support: 105.4, 104.6, 103.8
XAUUSD (Daily Chart)

Gold is still confined in a downward tunnel, but the bears were taking a breather on Tuesday, and price rebounded 0.65%. The precious metal struggled to find demand under high yield environment, consistent lower lows and lower highs on the daily chart suggest a strong selling bias. After breaching 50% Fibonacci support at $1765, which now coincides with ceiling of the descending tunnel, we expect price to come back to validate this resistance. If $1765 failed to contain the short term bulls, then we may see Gold regaining further north territories. MACD on the daily chart still heavily favors bullish trend.
Resistance: 1765, 1823
Support: 1691, 1600
Economic Data
|
Currency |
Data |
Time (TP) |
Forecast |
||||
|
AUD |
GDP (QoQ) (Q4) |
08:30 |
2.5% |
||||
|
GBP |
Composite PMI (Feb) |
17:30 |
49.8 |
||||
|
GBP |
Services PMI (Feb) |
17:30 |
49.7 |
||||
|
GBP |
Annual Budget Release |
20:30 |
|||||
|
USD |
ADP Nonfarm Employment Change (Feb) |
21:15 |
177K |
||||
|
USD |
ISM Non-Manufacturing PMI (Feb) |
23:00 |
58.7 |
||||
|
OIL |
Crude Oil Inventories |
23:00 |
-0.928M |
||||