Daily Market Analysis

Market Focus

U.S. equities climbed to a record high amid solid corporate earnings and confidence that the Federal Reserve will remain accommodative even as robust growth takes the world’s largest economy back to pre-pandemic levels.

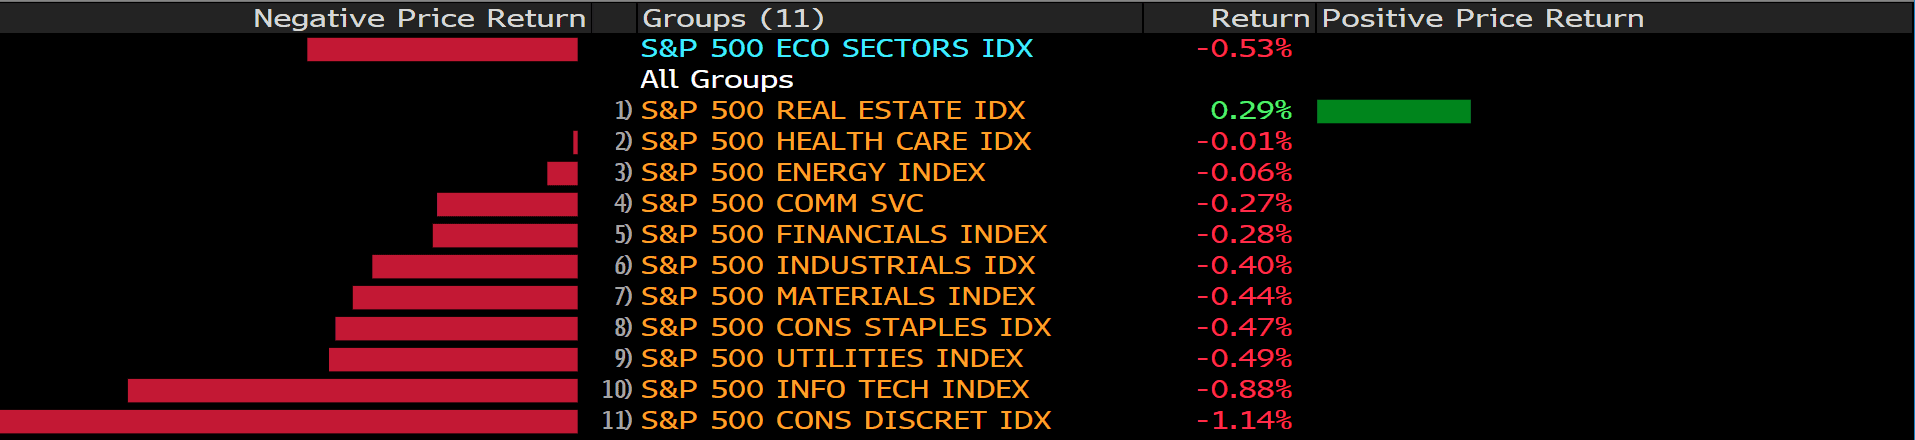
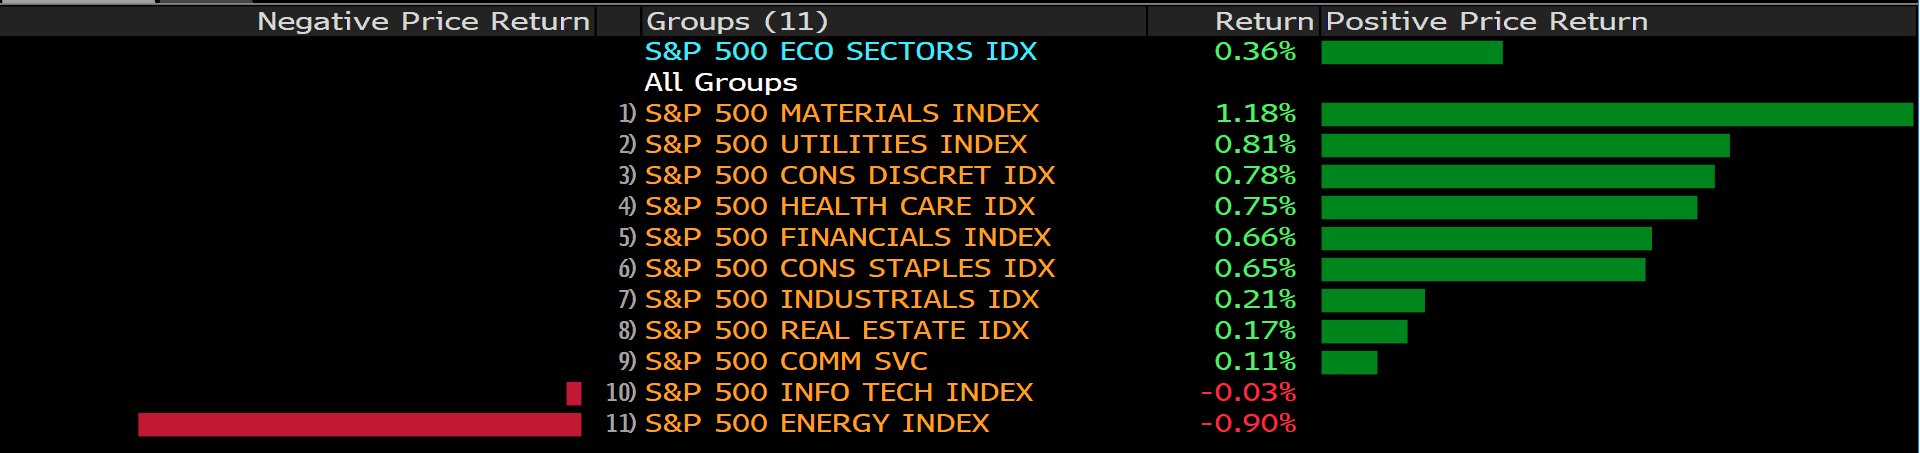
The S&P 500 rose after notching its first weekly decline since mid-March. Most of the main 11 industry groups gained, with energy and consumer-discretionary shares jumping the most. Small-cap stocks in the Russell 2000 outperformed the broader market. The U.S. 10-year Treasury yield hovered around its 50-day moving average. Copper, seen as a barometer of growth, surged to the highest in a decade.

Investors this week will focus on corporate earnings and U.S. economic data even as the Fed primes them to expect no change to policy at their two-day meeting ending Wednesday. While emerging economies from India to Brazil are grappling with a Covid-19 surge or renewed curbs, the developed world is on a firmer recovery path with a faster pace of vaccination.

Data on Thursday may show U.S. gross domestic product increased at a 6.9% annualized pace from January through March after a more moderate 4.3% rate in the previous quarter. Other reports this week may show a pickup in consumer confidence and robust personal spending. Recent indicators cemented economic optimism, with durable-goods orders rebounding in March and output at manufacturers and service providers reaching a record high in April.

European stocks advanced Monday, as gains for banks and travel companies offset losses for food companies and utilities. The dollar was little changed after initially falling to a two-month low. It was still on course for the biggest monthly drop this year.


Main Pairs Movement:

The Canadian dollar touched a five-week high, while the Australian dollar topped all Group-of-10 peers Monday, as a key index of commodities climbed to the highest since June 2018. A gauge of the dollar hit the lowest in two months as the Federal Reserve is set to begin a two-day meeting that ends Wednesday with a decision that could provide clues on its tapering stance.

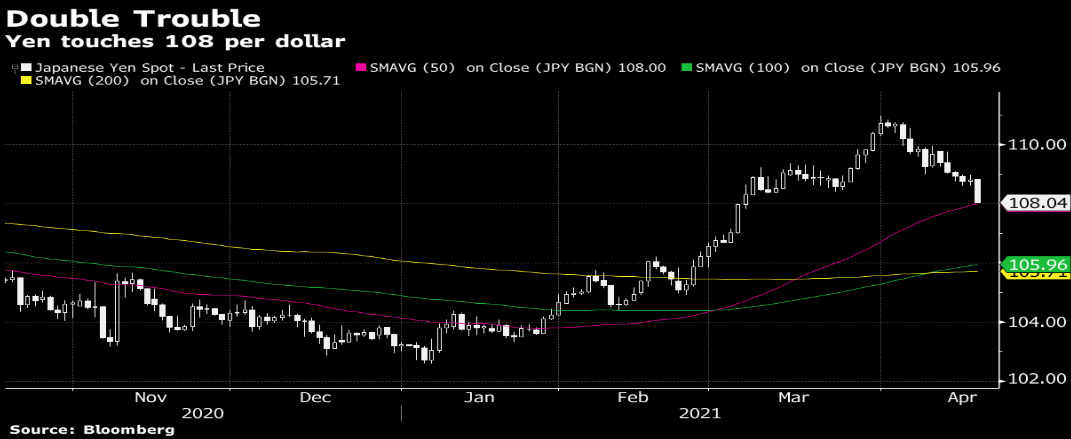
Among G-10 peers, the Australian, Canadian and New Zealand dollars outperformed amid a surge in copper and iron ore prices; the yen and euro led losses.

EUR/USD -0.1%; earlier climbed to 1.2117, the highest since Feb. 26. Short-dated risk reversals ease with gamma around EUR2.6 billion of 1.20 strikes and EUR2 billion of 1.19 strikes rolling off Wednesday.

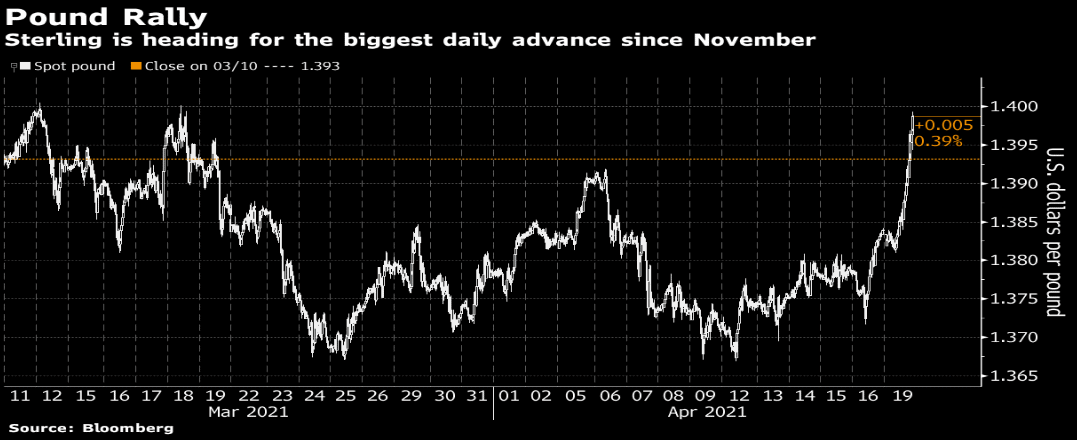
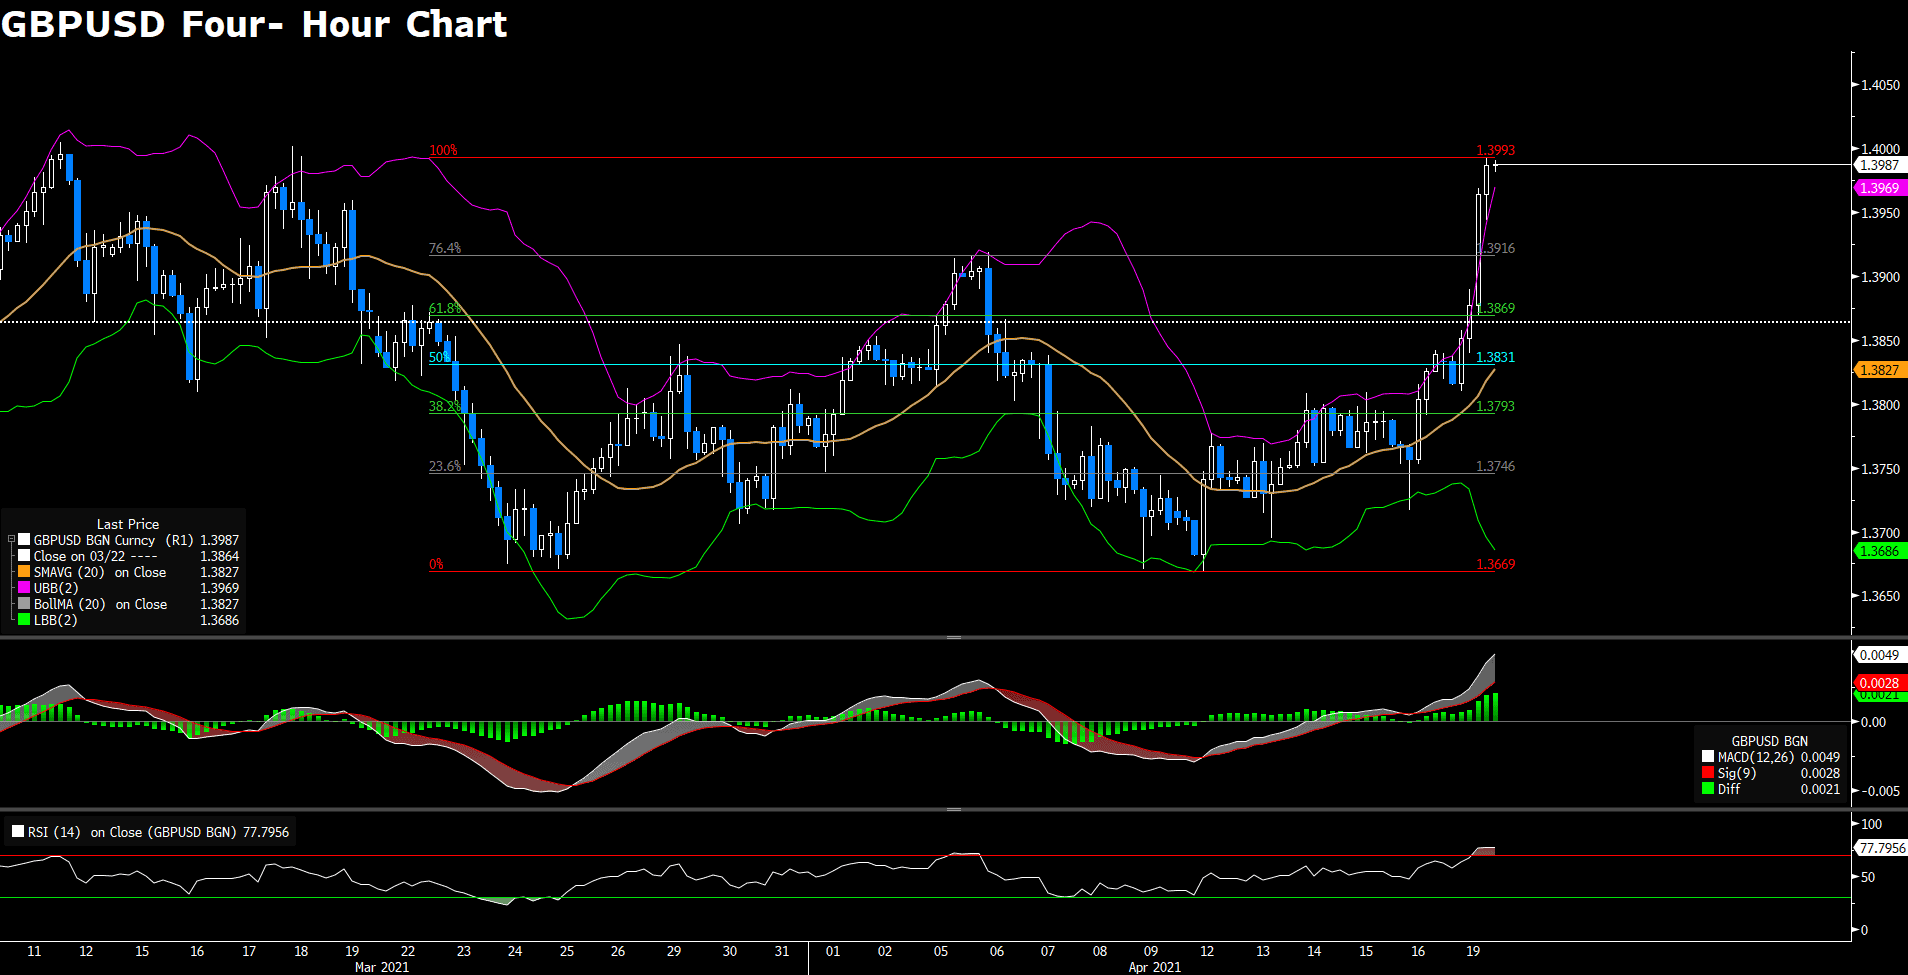
AUD/USD advanced 0.8% to 0.7803; NZD/USD rose 0.5% to 0.7238. Pair likely capped by ~AUD1.1 billion of 0.7830 options expiring Tuesday, according to DTCC data. GBP/USD +0.2%; rose as much as 0.4% to 1.3929; a move through 1.40 is likely.


Technical Analysis:

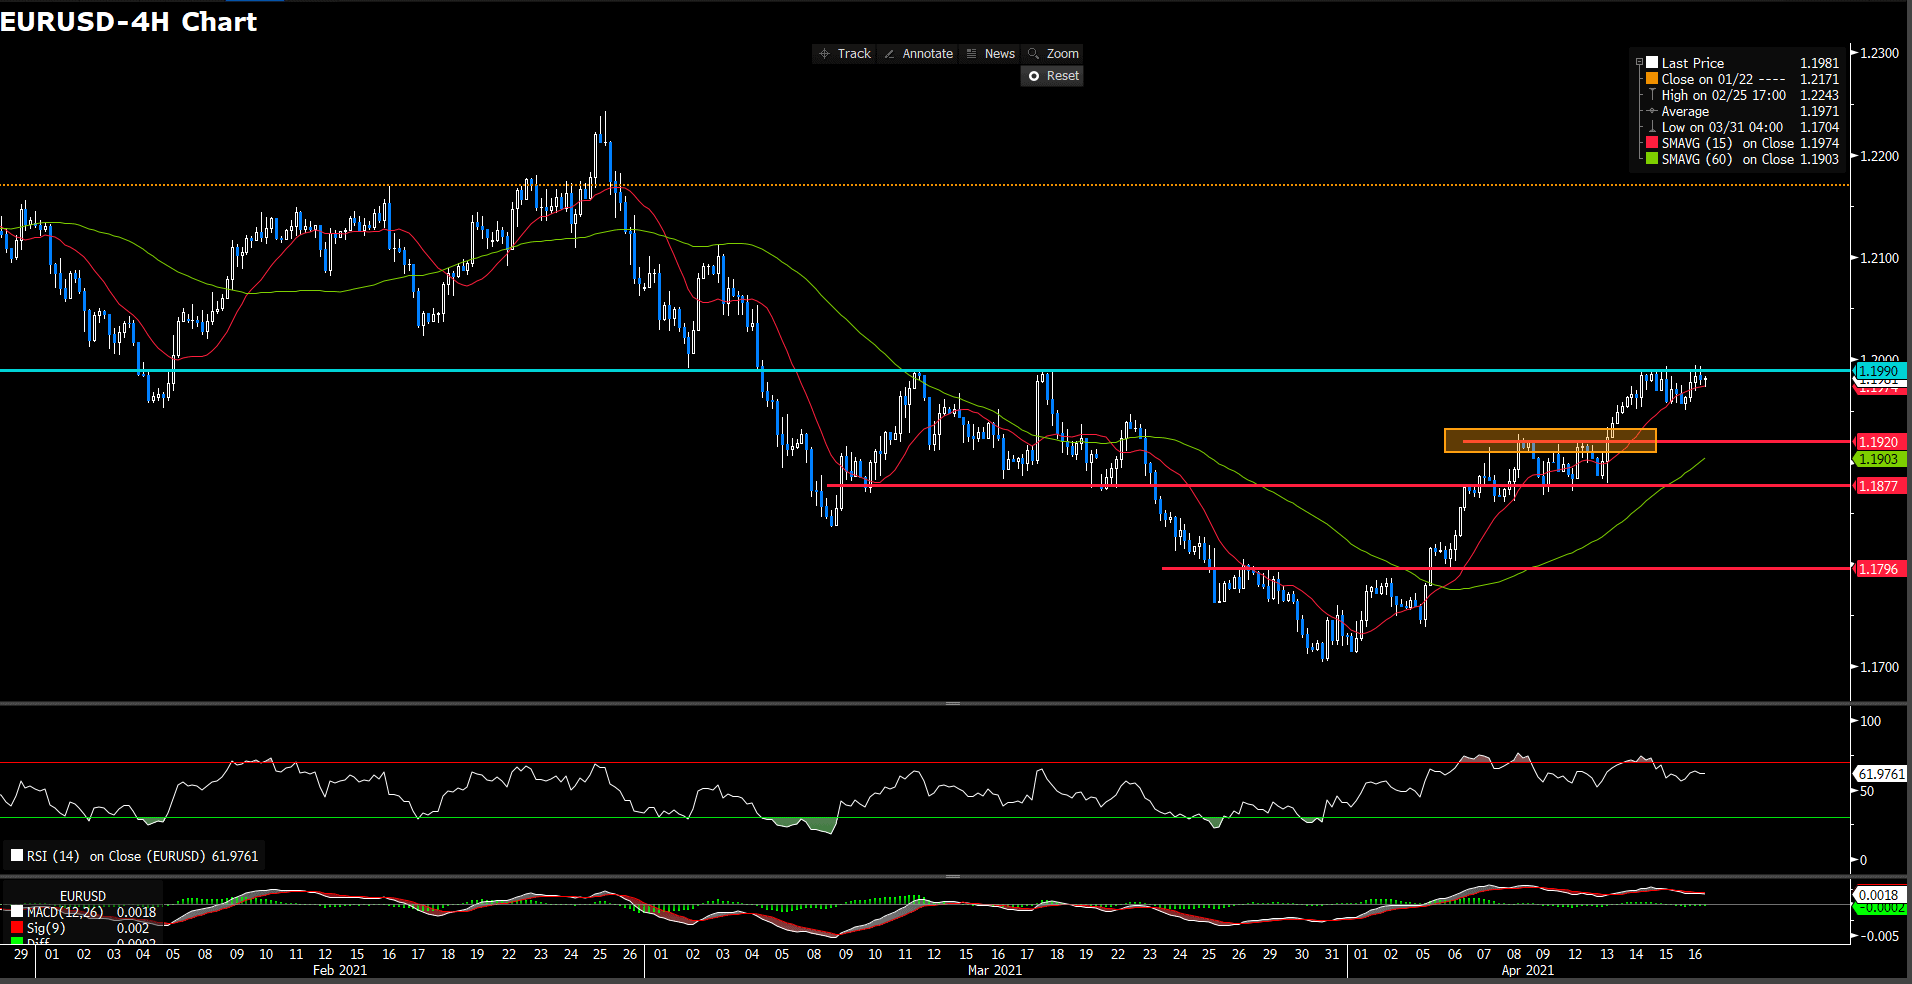
EURUSD (4 hour Chart)

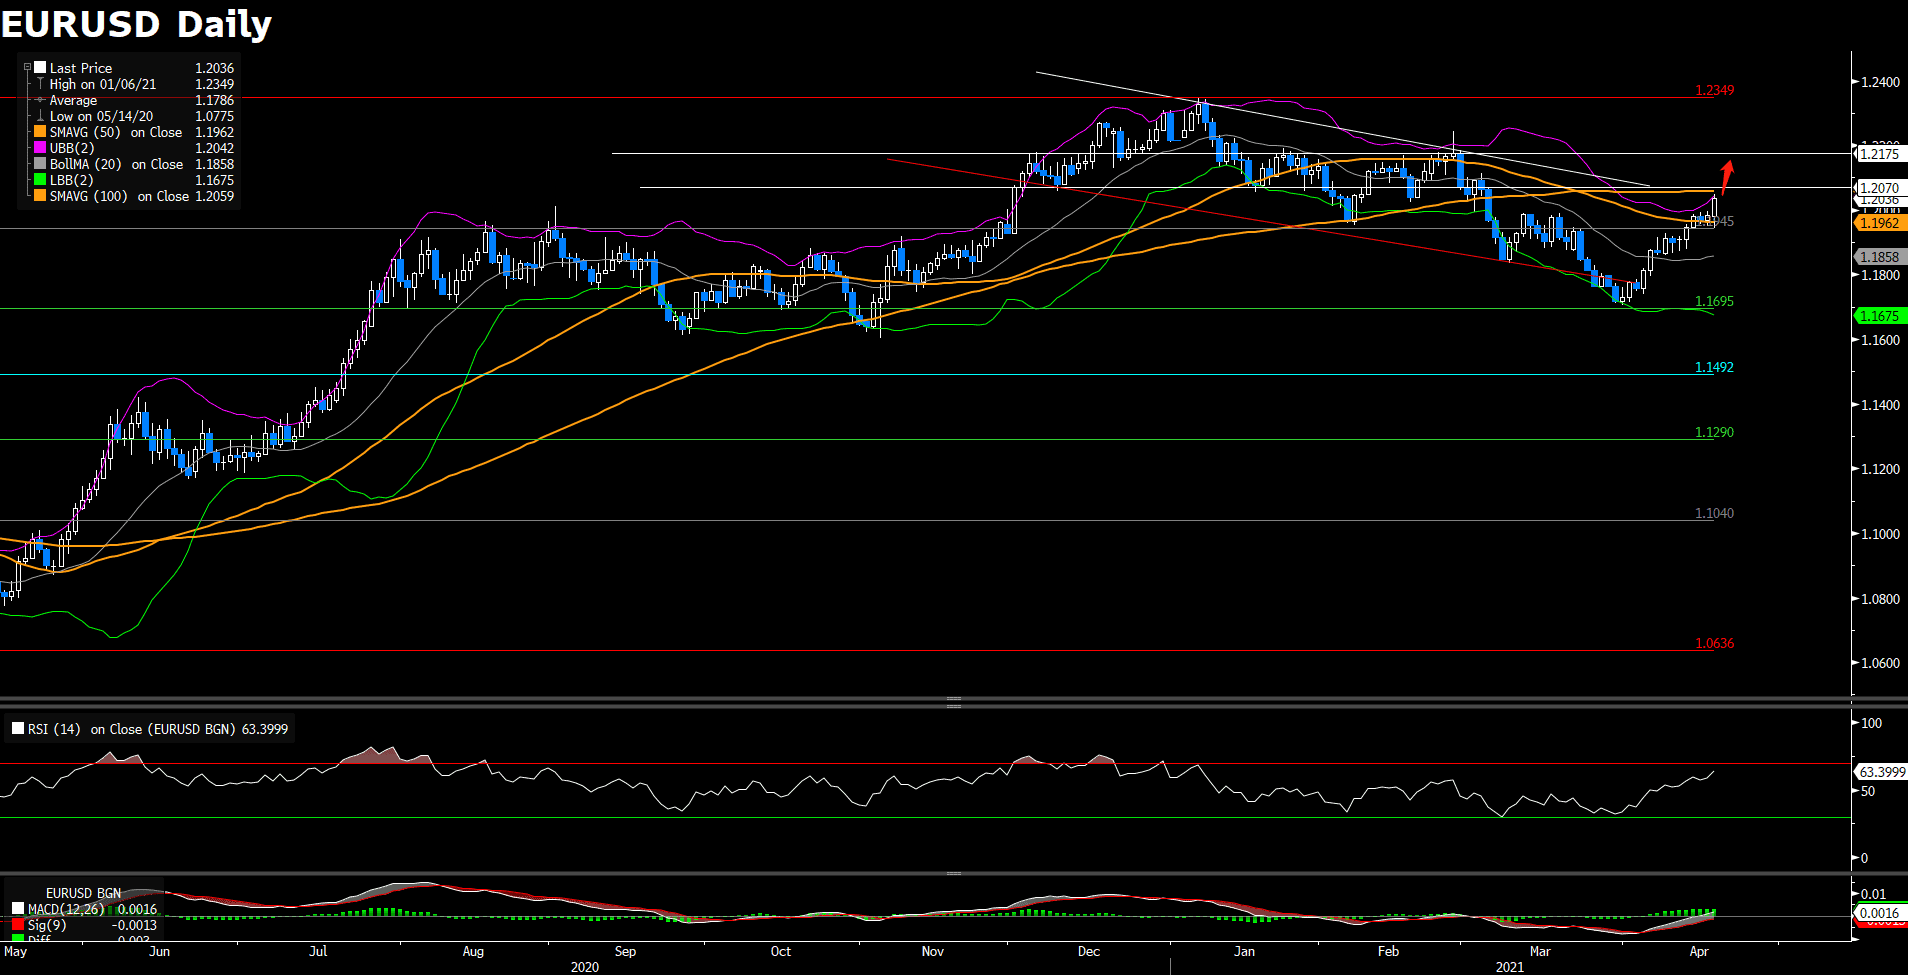
EURUSD slightly move in the day market which gird in tiny horizontal channel, trading at 1.2086 as of writing. As the lastest CFTC report, the EUR net speculator’s positioning increasing sharply. For RSI side, indicator show 59 figure at the moment, suggest a bullish momentum in short run. Furthermore, 15 and 60-long SMAs indicator are remaining acending trend. Therefore, we still optimistic for next bullish momentum that base on currently thread. However, there has a pursuant resistance at 1.2106 on the north side. If euro penetrate the resistance, we believe euro would hold the bull movement ahead.

Resistance: 1.2106

Support: 1.2071, 1.199, 1.192


AUDUSD (4 Hour Chart)

Aussie dollar has remians on upward track to post strong daily gains around 0.78 level which amid weakness greenback and benefit by booming commodities price as it commodities-linked characteristic. In the absence of worthnothing news, the pickup witnessed in copper prices provided a boost to the Aussie. For technical side, RSI indicator has risen to 68 figures which suggest a bullish guideline. On average price view, 15 and 60-long SMAs indicator are both sprawling upward trend.

Overall, we expect market still have room for upper side if greenback remaining weak\ness and rising price of commodities marketplace. Elsewhere, we see there has a strong resistance in short distance on 0.783 around. Moreover, unstopable bullish sentiment will drive RSI too quick to over bought threholds that might spur some sell-off order to the market.

Resistance: 0.783

Support: 0.775, 0.7695, 0.7656


USDCAD (Daily Chart)

Just like other commodities-linked currencies, loonie also driven by weakness greenback and inflation expectation of commodities market. As of writing, loonie tumbled during the north American session, reaching the lowest level since March 18th and also the multi-year low. Pair broke 1.246 then close around 1.2394 level. For RSI perspective, indicator has drop to 30 figure which pretty close to over sought barrier. Moreover, 15 and 60-long SMAs indicator have death cross in recently day.

Integrity all spots, we foresee market will reverse currently movement in short term as trigger the critical support level. On slip side, if market sucessive tamp down over nadir level, there will extend the plummet momentum and sentiment because there lack of a price cluster support.

Resistance: 1.246, 1.2491, 1.2587

Support: 1.238


Economic Data

Currency

Data

Time (GMT + 8)

Forecast

JPY

BOJ Outlook Report (YoY)

11:00

JPY

BOJ Press Conference

11:00

USD

CB Consumer Confidence (Apr)

22:00

113

VT Markets Notification of leverage change on Indices

Dear Client,

To provide clients with a good trading experience and optimize our competitiveness. We are glad to announce that we’ll increase the leverage of all index products to 333:1 on 3rd May.

A gentle reminder that if you are holding a position in an index product:
1. The index positions you hold during this adjustment will continue to be held.
2. The margin requirement will be reduced and the margin level will be increased after the adjustment.

If you’d like more information, please don’t hesitate to contact trading@vtmarkets.com.

VT Markets The Adjustment Of Weekly Dividend Notification

Dear Client,

Warmly reminds you that the component stocks in the stock index spot generate dividends. When dividends are distributed, VT Markets will make dividends and deductions for the clients who hold the trading products after the close of the day before the ex-dividend date.

Indices dividends will not be paid/charged as an inclusion along with the swap component. It will be executed separately through a balance statement directly to your trading account, the comment for which will be in the following format “Div & Product Name & Net Volume ” .

Please note the specific adjustments as follows:

If you’d like more information, please don’t hesitate to contact info@vtmarkets.com.

VT Markets Notification of Server Upgrade

Dear Client,

As part of our commitment to providing the best reliability and service to our customers, we are planning an upgrade in our server on Apr 24th 2021.

As a result, we will be conduct maintenance according to the schedule below.
Start date and time: 2021-04-24 5:00 GMT+3(Server time)
End date and time: 2021-04-24 7:00 GMT+3(Server time)

The impact can only make customers be unable to log in to the MT4 /MT5 software temporarily, and that won’t affect any order which has been opened.

After the upgrade, clients can login to MT4/ MT5 software using the server which is shown in the account activation mail.

No action is required by our customers. Your services will come back online at the end of the maintenance.

Thank you for your patience and understanding with regard to this important initiative.

If you have any questions, our team will be happy to answer your questions.Please mail to info@vtmarkets.com or contact the service online.

Daily Market Analysis

Market Focus

U.S. stocks had their biggest slide in five weeks after President Joe Biden was said to propose almost doubling the capital-gain tax for the wealthy. The dollar advanced.

The S&P 500 turned lower after Bloomberg News reported that for those earning $1 million or more, the new top rate, coupled with an existing surtax on investment income, means that federal tax rates for rich investors could be as high as 43.4%. Speculation arose that some traders may sell shares before any change is made to capture the lower rate.

Equities whipsawed throughout the session amid mixed economic data and renewed concern the pandemic was worsening. All major groups in the S&P 500 fell, led by material, energy and tech shares. AT&T Inc. jumped after beating earnings estimates. Intel Corp. — the biggest chipmaker — slid in afterhours trading as it reported a drop in data-center revenue and a steep slump in gross profit margin.

Elsewhere, Bitcoin declined for the sixth time in seven days, extending losses after the higher capital gains proposal was revealed. Investors already face a capital-gains tax if they hold the cryptocurrency for more than a year.


Main Pairs Movement:

The dollar rose as reports of President Joe Biden considering almost doubling the capital gains tax rate weighed on risk appetite, with U.S. stocks headed for worst day in four weeks. The euro slipped after the European Central Bank confirmed that it was not yet discussing a phase-out of its emergency bond purchases. U.S. 10-year bond yields slid for a third day, edging lower to 1.55%; U.S. stocks headed for their biggest drop since mid-March.

Here are the takeaways from the ECB decision and news conference.

1.The ECB kept policy steady as widely expected, confirming that the latest incoming information pointed to a continued need for “significantly higher” emergency bond purchases

2. Pressed on whether the last weeks’ purchase figures really constituted a “significant” increase, President Christine Lagarde stressed the focus must be on monthly numbers, rather than weekly

3. She also said it would be premature to discuss phasing out the crisis tool, and offered a downbeat assessment of the short-term risks to the economy. A number of analysts expect buying to slow again in the third quarter

4. Lagarde highlighted that she doesn’t see the ECB and the U.S. Federal Reserve moving in tandem, as the two economies are “not on the same page”

5. Market moves were limited, with the euro erasing a gain to trade around 1.2026 versus the dollar; German and Italian bonds also reversed earlier

USD/JPY is little changed at 108.09, dropped as much as 0.2% as Tokyo Governor Yuriko Koike sought to reimpose a state of emergency. NZD/USD sinks 0.8% to 0.7159 to be the worst performer in G10. The kiwi’s decline was led by sales against the Aussie, according to an Asia-based FX trader. AUD/NZD snapped a three-day drop to rise 0.1%.


Technical Analysis:

EURUSD (4 Hour Chart)

The European Central Bank had a monetary policy meeting. As widely anticipated, European policy makers decided to leave rate unchanged. President of ECB said it would be premature to discuss phasing out the crisis tool, and pessimitic assessment of the short-run risks to the economy. On the technical side, RSI indicator has fallen below neutral line to 49.7 figure as of writing, suggesting a shred of bearish movement. On the other hands, 15-long SMA indicator turn side to south way but 60-long SMA indicator remain north way.

On price action, it is obvious that euro dollar attain a strong downside support after correction to 1.199 level couple times. As the mixed information, we foresee market still have a north side chance. However, poor indicator suggestion is pinning the marketplace. Therefore, 1.19 is still vital first support level which need immediately to be defended. If penetrate downward further, 1.192 will be the next support level.

Resistance: 1.2071, 1.2106

Support: 1.199, 1.192, 1.1877


GPBUSD (4 Hour Chart)

At the time of writing, pound slip to 1.3839. It seems loss the gravity that down from 1.9349 to low 1.3826 while U.S. session. In imminent sessions, UK Retail Sales is due on Friday, along with the flash PMIs data. Reuters reported that “Brititsh manufacturing’s expectations of an economic rebound rose to highest since 1973 this month as the country begain recovery from COVID-19 pandemic”. However, we need to faint wary of UK PM was warning the next pandemic wave probably forthcoming.

For RSI side, indicator has drop to 37.8 figures, suggesting a bearish momentum ahead. On price average perspective, 15-long SMA turn negative slope whilst 60-long SMA retain upward movement. Currently, we see price has plummeted over the former critical support level at 1.39 which is neckline of previous double bottom. Therefore, we expect market will choppy in a tiny range between first resistance and support gauge. On slid way, if consecutive go down after 1.3822 level, it could induce continuosly downward movement.

Resistance: 1.4, 1.3959, 1.39

Support: 1.3822, 1.3796


XAUUSD (4 Hour Chart)

Gold stopped the previous two days snap up momentum that slipped to alongside 15-long SMA indicator; at the meantime, 15 and 60-long SMAs indicator are remaining the asceding trend. Basically, gold market has been dragged down by overwhelming greenback after U.S. president Joe Biden want to rose up the tax. For RSI view, indicator shows 56 figures as of writing which suggest a glimmer of bullish momentum.

All of all, we stll feel optimistic for upcoming market bull movement. Therefore, if we have to keep upward momentum, any correction need to be stop at $1759.7 level on slid way.

Resistance: 1800.7, 1812.8

Support: 1759.7, 1754.5, 1722.75


Economic Data

Currency

Data

Time (GMT + 8)

Forecast

GBP

Retail Sales (MoM)(Mar)

14:00

1.5%

EUR

German Manufacturing PMI (Apr)

15:30

65.8

GBP

Composite PMI

16:30

GBP

Manufacturing PMI

16:30

GBP

Services PMI

16:30

USD

New Home Sales (Mar)

22:00

886 K

EUR

ECB President Largarde Speaks

22:30

Daily Market Analysis

Market Focus

Asia stocks are poised to bounce after U.S. equities snapped a two-day drop on a rally in companies that stand to benefit the most from an economic revival. The dollar fell, while Treasuries stabilized.

Futures pointed higher in Japan, Australia and Hong Kong. Most major groups in the S&P 500 rose, with raw-material, energy and financial shares leading the charge. The Russell 2000 Index, a gauge of small caps, climbed more than 2%, outperforming major benchmarks.

Oil fell for a second day with an increase in U.S. crude inventories compounding concerns around a choppy global demand recovery. Gold edged higher.

Equities rebounded as traders sifted through corporate results for signs on whether an anticipated jump in profits would bring with it forecasts for stronger growth. Earlier losses were driven by concern over a flare-up in coronavirus cases around the world that could jeopardize an economic rebound, particularly with stocks trading near their all-time highs.


Main Pairs Movement:

The Canadian dollar rallied after policy makers pared back their bond buying program, making Canada the first major economy to reduce emergency levels of monetary stimulus. A gauge of the U.S. dollar retreated as stocks rebounded and commodity currencies edged higher.

USD/CAD fell as much as 1.2% to 1.246, the most since June 2020, backtracking on an earlier gain of 0.4% while the central bank said the recovery will still need extraordinary support, it also indicated that it’s bringing forward its expected timeline for rate increases.

NZD/USD climbed 0.5% to 0.7211, while AUD/USD rose 0.4% to 0.7762. USD/JPY erased an earlier decline to be little changed at 108.12.

EUR/USD fell less than 0.1% to 1.203 after earlier slipping as much as 0.3%. The European Central Bank meeting on Thursday carries little risk of setting off fireworks in the currency market.


Technical Analysis:

EURUSD (4 Hour Chart)


Euro dollar choppy in the day in a tiny range for second consecutive day, trading at 1.2034 as of writing. In day movement, euro dollar once slipped to 1.2 in earlier session then rebound from strong psychological level. For technical side, even though RSI indicator once went down to 50 figure, it pull up to 58 figure while market close which suggest a bull movevment ahead. On average price perspective, 15 and 60-long SMAs indicator still held ascending momentum. Therefore, for price action perspective, we believe euro dollar still have room to north side.

On the other hands, investors wait for the tomorrow ECB rate decision. Most market participant expect ECB could more clarify on Crisis Exist subject.

Resistance: 1.2071, 1.2106

Support: 1.199, 1.192, 1.1877


GPBUSD (4 Hour Chart)

Sterling has bounced back above 1.39, recovering it earlier session loss amid U.K. CPI missed expectation with 0.7% and PM warn of next covid wave whilst greenback reward from risk-off sentiment in share market. For technical side, RSI indicator shows 57 figure, suggesting a slighty-bull movement expectation. On Moving Average view, both 15 and 60-long SMAs indicator retain upward trend.

For price action side, we see sterling obtain a retreatment on 1.39 where is neckline of double bottom we considered a strong support level. Therefore, we expect market still have a bullish movement in further marketplace but it have defend 1.39 level while correction term.

Resistance: 1.4, 1.3959

Support: 1.39, 1.3822, 1.3796


XAUUSD (4 Hour Chart)

Gold has hovered two consecutive day while it is towarding to 1800 level as greenback weakens, trading at 1793.79 as of writing. A slipped of greenback as well as U.S. 10 year Treasuries yields boosted metal sharply up. Meantime, an improvement in market sentiment helped gold. For RSI view, indicator is close to the 70 figures which mean market gradually situate in over bought sentiment. On average price side, long and short-term SMAs indicator are both retaining it downwind trend.

All of all, we feel optimistic for upcoming bull market movement. However, we see strong pyschological resistance at 1800 on upper side. Therefore, if we have to keep upward momentum, any correction need to be stop at $1759.7 level on slid way.

Resistance: 1800.7, 1812.8

Support: 1759.7, 1754.5, 1722.75


Economic Data

Currency

Data

Time (GMT + 8)

Forecast

EUR

Deposit Facility Rate (Apr)

19:45

-0.5%

EUR

ECB Marginal Lending Facility

19:45

EUR

ECB Monetary Policy Statement

19:45

EUR

ECB Interest Rate Decision (Apr)

19:45

USD

Initial Jobless Claims

20:30

617 K

EUR

ECB Press Conference

20:30

USD

Existing Home Sales (MoM)

22:00

6.19 M

Daily Market Analysis

Market Focus

U.S. stocks fell for a second day as rising virus cases around the world led to renewed concern over the continued economic impact, overshadowing a batch of solid corporate results.

The S&P 500 extended its slide from an all-time high, with investors showing caution ahead of the brunt of the earnings season. All eyes will be on whether an anticipated rise in profits will bring with it forecasts for stronger growth ahead. International Business Machines Corp. climbed after reporting its largest revenue growth in 11 quarters, while United Airlines Holdings Inc. paced a selloff in travel stocks on a bigger-than-expected loss. Netflix Inc. plunged in post market trading as its first-quarter subscriber growth fell short of the average analyst estimate.

While American equities are trading at a valuation that’s about 35% above the average of the past decade, investors are focused on what’s forecast to be the best earnings season in two years. One of their biggest concerns is whether companies are equipped to handle mounting inflation pressures as the economic recovery gains momentum.

Elsewhere, the dollar rose for the first time in seven sessions, while the Treasury 10-year yield dropped to the lowest level in more than five weeks.


Main Pairs Movement:

A gauge of the dollar snapped a six-day losing streak on Tuesday as commodity currencies slipped along with crude oil after a U.S. House committee cleared a bill that opens OPEC to Justice Department antitrust lawsuits.

USD/CAD rose as much as 0.6% to 1.2613, breaching its 55-DMA as it eyes the April 13 high of 1.2629; it was the pair’s biggest intraday gain in almost five weeks. Weakness in the loonie comes ahead of a Bank of Canada policy meeting Wednesday. The euro also slipped after a poll showed the German Green party taking a seven-point lead over Chancellor Angela Merkel’s conservative bloc.

AUD/USD fell by as much as 0.5% to 0.7719 after earlier climbing as much as 0.7% to 0.7816. Move may have been partly driven by profit-taking and put demand. Other than this, NZD/USD slid 0.2% to 0.7173 as commodity currencies backed down in U.S. trading, erasing an early advance of as much as 0.6%.


Technical Analysis:

EURUSD (4 Hour Chart)

Euro dollar ebbed a little as it bull move amid sterling correction that drive dollar pick up, currently trading at 1.2036. At the current stage, market still move along with in upper side of 15-long SMA while 60-long SMA retain it ascending trend. Moreover, RSI indicator show a bullish signal as it set at 61.3 figures. Integrity above perspective, we foresee the market will supress by first resisitance at 1.2106 level, therefore, remaining a room for north side. For next check point, we need to ensure will market stand firmly above the 1.199 level where obviously a neckline of bottom pattern.

Resistance: 1.2071, 1.2106

Support: 1.199, 1.192, 1.1877


GPBUSD (4 Hour Chart)

Sterling wrong-foot correction in daily market lead it loss 0.32%, trading at 1.3941, after yesterday coup movement which aslo induced dollar index binge. Absolutely, it is seemingly impeded by pyhcological resistance at 1.4 level. On the other hands, RSI indicator also cold down from torrid overbought territory while it slip to 62 figure , still suggesting a bullish guidance at least for short term. Furtonutely, both 15 and 60-long SMAs indicator are still on acending path.

All of all, we expect market will remain the bullish movement for long term but short run is more likelihood of consolidation move. Therefore, bull side should entrench the first support level on 1.39 which also considered a neckline of W pattern. On contrast, we see there lack of an effective upper boundary expect for the 1.4 level which suffocated by two-month-long upside price cluster resistance.

Resistance: 1.4, 1.3959

Support: 1.39, 1.3822, 1.3796


XAUUSD (4 Hour Chart)

Gold inverted yesterday move that turn back on the bullish trajecctory, trading at day high $1777.7. On technical side, RSI indicator trading at 60.7 figure which suggest a bullish momentum for short term. At the meantime, 15 and 60-long SMAs indicator are both remaining upward trend. For price action perspective, after penetrated 1759.7 level, gold seemingly situate a solid prosperity. Therefore, we expect there still have window for pick up side. On upper side, we see phycological figure at 1800 will be the first critical resistance. If retain movement furtther, next resistance eyes on 1812.8. On lower side, 1759.7 still be the first barrier where is the shoulder of double bottom.

Resistance: 1800.7, 1812.8

Support: 1759.7, 1754.5, 1722.75


Economic Data

Currency

Data

Time (GMT + 8)

Forecast

NZD

CPI (QoQ)(Q1)

06:45

0.7%

AUD

Retail Sales (MoM)

09:30

GBP

CPI (YoY)(Mar)

14:00

0.8%

GBP

BoE Gov Bailey Speaks

18:30

CAD

Core CPI (MoM)(Mar)

20:30

CAD

BoC Monetary Policy Report

22:00

CAD

BoC Interest Rate Decision

22:00

0.25%

USD

Crude Oil Inventories

22:30

-2.975 M

CAD

BoC Press Conference

23:00

Daily Market Analysis

Market Focus

US stocks market declined from an all- term high as investors waited for the warning season later in the week. Technology shares declined, led by Tesla Inc; Tesla contributed the most to the decline as one of its cars that happened to crash and kill two passengers. At the end of the day, the Dow Jones Industrial Average fell 123 points; the Nasdaq dropped 1% while the S&P 500 declined 0.5%.

American banks are cashing in on strong earnings to raise more debt at low rates. Banks are raising debt in bond market today. Such banks like Morgan Stanley, who launched a $7.5 billion bond sale with JPMorgan. With bond rates creeping up, issuers may prefer to front load borrowing rather than spread it out over the course of a year.

Emission- curbing metal, Palladium is on the way to its fresh record high as demand is getting back from restocking by automakers, who use palladium to build catalytic converters. As the economic recovery is getting better, restocking is expected to start taking place in the second half of 2020.


Main Pairs Movement:

Surge in imports at US ports becomes one of reasons to drag the US dollar down. With the Federal Reserve decided to stay course in the next coming months, the deterioration in trade deficits might undermine the US dollar, strengthening the dollar negative narrative. One of the examples is the surge of imports at the largest US ports on the west coast, implying that trade deficits are essentially widening fast. The diagram below has shown that imports have significantly increased.

The British Pound is up more than1.1% against the US dollar, aiming for February’s high above $1.42. The rally in the British Pound seems to have taken on a life of its own. Pound’s self- rally can be seen by the rising euro and falling dollar dichotomy, but pound’s rising momentum now seems to have taken on its own rocket ride. The bulls in the British Pound can possibly be the reason that the UK was able to quickly inoculate its people, and at the same time be able to reopen its economy with a fast pace.

The Japanese Yen is on the way to knock on the door of the major level, 108, against the US dollar. The rally seems to be mostly based on safe- haven demand, the Yen. And one of the possible moves might be the geological risks that the current crisis in Myanmar, which most relevant to the Japanese Yen. At the same time, another possible story might be that Japanese life insurers are starting a new year and determining whether or not to hedge their currency risk.

The EURUSD climbs above 1.20 level as the US dollar falls even though the US yields rise. Optimism about European region’s vaccination campaign has played a big role to help the bulls in the euro dollar.


Technical Analysis:

EURUSD (Daily Chart)


EURUSD has shown that the bulls are in charge, currently trading at 1.2035. With its current bullish momentum, the pair is heading toward the next immediate resistance at 1.2070. If the pair can successfully breach the resistance, it will accelerate toward the next level at 1.2175 as the upward momentum will lead the pair trade above both 20 SMA and 50 SMA. Moreover, the technical indicator, the MACD continues to lend support to the bulls while the RSI has not yet reached the overbought condition. That being said, EURUSD still sustains its upward traction.

Resistance: 1.2070, 1.2349

Support: 1.1945, 1.1695, 1.1492


GPBUSD (4 Hour Chart)

GBPUSD surges toward 1.40, extending its gain for a siixth consecutive day. However, in the near- term, its gain might pause as it nearly reaches the next immediate cap at 1.3993. At the same time, the RSI of 77 shows that the pair is extremely overbought despite of the MACD’s bullish signal remains very strong. In a bigger outlook, GBPUSD retains its bullish momentum since the pair has broken above its 200 SMA before rally over 150 pips while it is about 100 pips above the 50 SMA.

Resistance: 1.3993

Support: 1.3916, 1.3869, 1.3831


XAUUSD (Daily Chart)

After contesting the initial hurdle at $1778, Gold faces the adjustment, currently trading at 1770.45. In the near- term, gold retains bullish as its upward momentum remains valid according to the technical indicators; the MACD continues to lend support to gold’s bulls while the RSI is outside of the oversold territory, giving the pair continuation to extend further north. At the moment, the pair is in the stage of adjustment since it has reached the upper band of Bollinger Band, suggesting a temportary pause for the upside trend. On the upside, if gold can once again breach the resistance at 1778, then it will open up a path toward the next resistance at 1861.15; to the downside, if gold fails to break through the hurdle, then the initial price range of the adjustment is expected to see in between 1778 and 1749.27.

Resistance: 1778, 1861.15, 1953.46

Support: 1749.27, 1684.94


Economic Data

Currency

Data

Time (GMT + 8)

Forecast

AUD

RBA Meeting Minutes

09:30

N/A

CNY

PBoC Loan Prime Rate

09:30

N/A

GBP

Average Earning Index + Bonus (Feb)

14:00

4.8%

GBP

Claimant Count Change (Mar)

14:00

N/A

VT Markets The Adjustment Of Weekly Dividend Notification

Dear Client,

Warmly reminds you that the component stocks in the stock index spot generate dividends. When dividends are distributed, VT Markets will make dividends and deductions for the clients who hold the trading products after the close of the day before the ex-dividend date.

Indices dividends will not be paid/charged as an inclusion along with the swap component. It will be executed separately through a balance statement directly to your trading account, the comment for which will be in the following format “Div & Product Name & Net Volume ” .

Please note the specific adjustments as follows:

If you’d like more information, please don’t hesitate to contact info@vtmarkets.com.

Daily Market Analysis

Market Focus

Not even a week’s worth of evidence that the U.S. economy is coming back from the COVID-10 pandemic period has been able to derail the concerted rally sweeping stocks and bonds.

The S&P500 has surged up to record setting high. The Dow30 index gained consecutive days that crossed the 34000 thresholds for the first time ever, settle down to 34200.67. Wall Street wrapped up another winning week with the three major benchmarks all gaining more than 1%. The S&P 500 and the Dow posted their fourth straight positive week, while the tech-heavy Nasdaq has registered gains for three weeks in a row.

The last of the six largest U.S. banks to report– Morgan Stanley — posted stronger-than-expected earnings, bolstered by strong trading and investment banking results. Shares of the bank dipped 2.8%, trimming its year-to-date gains to about 14%.

The University of Michigan said Friday its preliminary consumer sentiment index rose to a one-year high of 86.5 in the first half of this month from 84.9 in March. At the meantime, strong housing data also propel the confidence for economy recovery.

Federal Reserve Governor Christopher Waller said Friday the U.S. economy is set to take off, but there’s still no reason to start tightening policy.


Main Pairs Movement:

The dollar fell, poised for the biggest weekly pullback since December, as a steep decline in Treasury yields curbed the allure of the U.S. currency. The franc gained Friday amid the Biden administration’s decision to drop Switzerland’s currency manipulator label. U.S. equities were set for another record high close.

EUR/USD +0.1% to 1.1978; touched 1.1995, highest since March 4; talk of barrier at 1.20 slows the ascent with buy stops above. EUR/GBP -0.3% at 0.86603; earlier climbed as much as 0.4% to 0.87192, the strongest level versus the pound since February as the region’s vaccine rollout gathers pace.

The New Zealand and Australian dollars were the worst performers in the G-10. USD/JPY +0.1% to 108.82; rose as much as 0.2%, but still exposed to further downside risks should U.S. yields resume a decline.


Technical Analysis:

EURUSD (4 Hour Chart)

Euro dollar continuously hit 1.199 level, its highest since March which also the cogent resistance level at current price action. Euro rebound from month-low was pushed by falling U.S. Treasury yields. At the meantime, U.S. policymakers have repeated multiple times this week that the ongoing massive stimulus program will remain in place until the economy actually recovers to pre-pandemic levels. For RSI aspect, indicator record 62 figure which suggest a bullish momentum. At moving average perspective, 60-long SMAs retain it ascending movement but 15-long SMAs is waning upward momentum to flat move.

Therefore, we foresee market will consolidate between 1.1900 and 1.192 range as mixed information. Other than this, if Treasuries yields keep moving to downward, euro still got the big chance for upper side.

Resistance: 1.199

Support: 1.192, 1.1877, 1.1796


GPBUSD (4 Hour Chart)

Sterling hovered for fifth consecutive days toward to last peak at 1.39 level which supported by a decline of greenback as well as U.S. Treasuries yields. On RSI side, indicator held 64 figure as of writing, suggesting a bullish momentum further. On average price aspect, it is noteworthy that happened a golden cross in the day.

On price action perspective, market seemingly is heading to a double bottom pattern as month-long scale. Therefore, we expect that still have a room for bull move in further market. On up side, the immediate resistance would be 1.3848, 1.3867 following.

Resistance: 1.3848, 1.3867

Support: 1.3798, 1.3772, 1.3718


XAUUSD (4 Hour Chart)

Gold continue accelerate to higher stage amid U.S. Treasuries yields sucessively slipped, trading at 1778.18 as of writing which hit 1 month peak. For technical perspective, RSI indicator is approaching over bought area again in this two day, however, daily chart still under 70 level which giving the pair a positive side for further extend. On ther other hand, 15 and 60-long SMAs indicator are both remaining upward trend.

All of all, after solidly stand above the bottom pattern, we believe the market will consistenly edge higher level. For the next immediate, we eyes on the pychological number at 1800 because there seems not price cluster upon. On defend side, certainly, 1760 around should be the first critical support as it is the shoulder level of bottom pattern.

Resistance: 1800, 1812.8

Support: 1759, 1754.5, 1722.75


Economic Data

Currency

Data

Time (GMT + 8)

Forecast

AUD

RBA Meeting Minutes

09:30

CNY

PBoC Loan Prime Rate

09:30

GBP

Average Earning Index + Bonus (Feb)

14:00

4.8%

GBP

Claimant Count Change (Mar)

14:00

Back To Top
server

Hello there 👋

How can I help you?

Chat with our team instantly

Live Chat

Start a live conversation through...

  • Telegram
    hold On hold
  • Coming Soon...

Hello there 👋

How can I help you?

telegram

Scan the QR code with your smartphone to start a chat with us, or click here.

Don’t have the Telegram App or Desktop installed? Use Web Telegram instead.

QR code