Daily Market Analysis

Market Focus

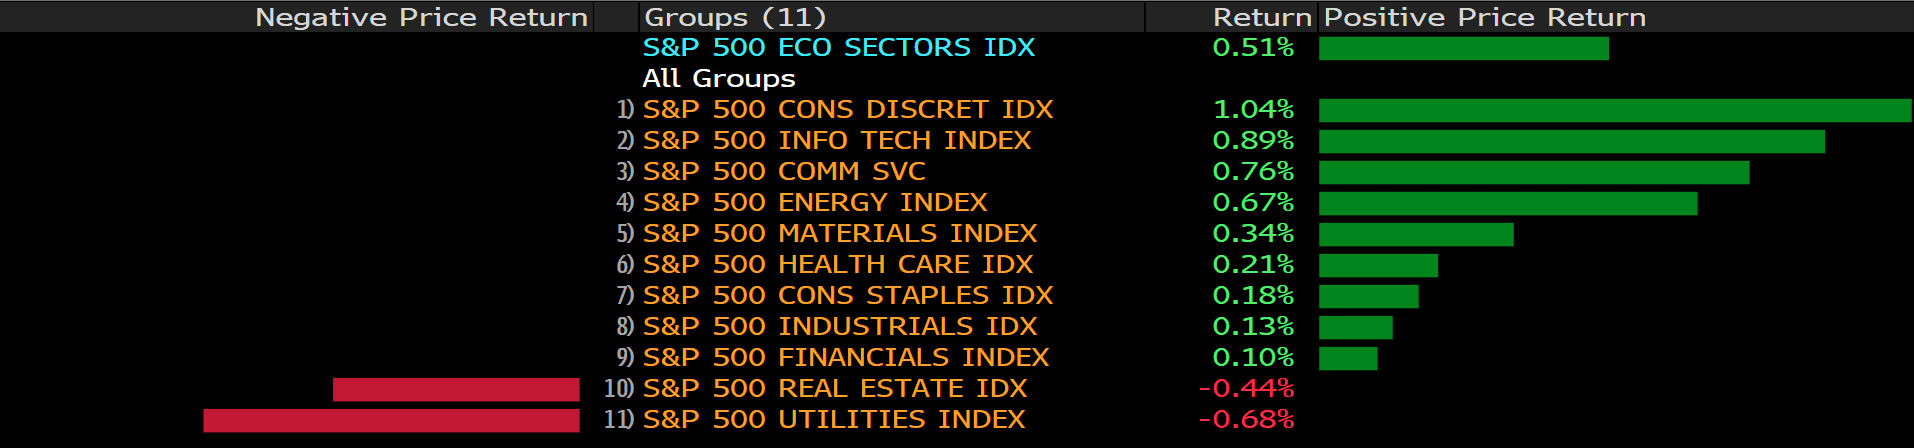
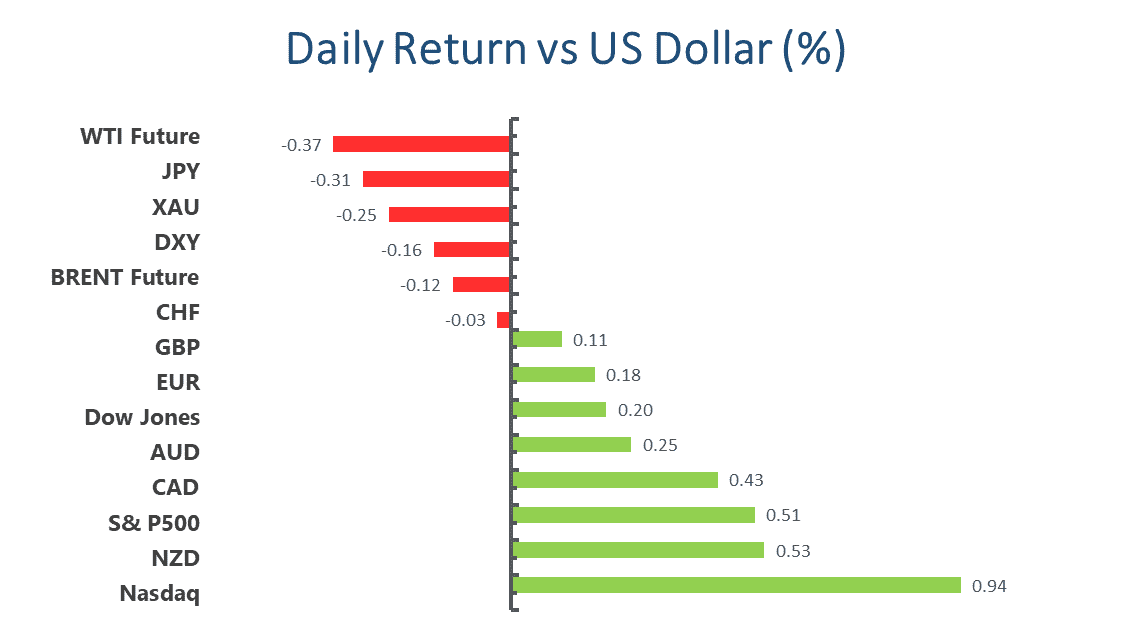
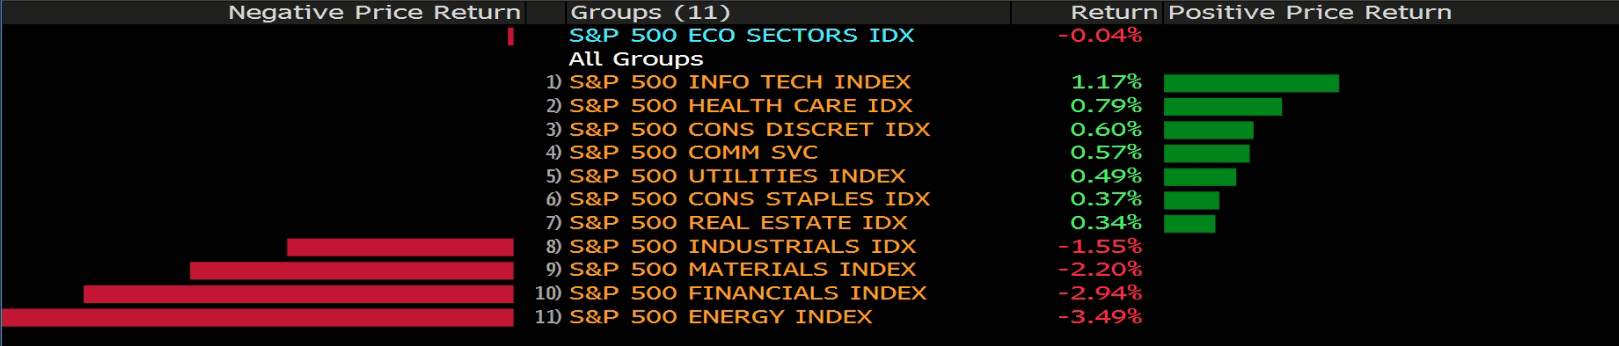
Stocks climbed to an all-time high as President Joe Biden’s bipartisan $579 billion infrastructure deal added to optimism the economic recovery is taking hold. Nasdaq 100 rose 0.6%. Dow Jones rose 1%. Companies that stand to benefit the most from a rebound in activity outperformed — with financial and energy shares leading gains in the S&P 500. Caterpillar Inc. (+2.6%), the world’s biggest maker of mining and construction equipment, jumped alongside raw-material producers such as U.S. Steel Corp. (+3.36%) and Nucor Corp. (+1.99%).

一張含有 文字 的圖片

自動產生的描述

Wall Street banks are poised to announce a deluge of dividend increases and stock buybacks after Fed’s stress tests showed the industry built up a stockpile of cash during the pandemic.

Lenders can announce their plans for distributing capital after the market closes on June 28, and the industry’s strong results mean payouts may be the largest ever following the Fed’s annual exams. Early estimates indicate the six biggest U.S. banks, including JPMorgan Chase & Co., Bank of America Corp. and Citigroup Inc., could return more than $140 billion to shareholders.

The passing marks, announced Thursday by the Fed, indicate that firms are officially free from restrictions that the regulators put on dividend payments and share repurchases last year when Covid-19 was ravaging the economy. The banks’ solid performance also signals that the industry has grown much more comfortable with the exercises, which used to trigger anxiety and frustration across Wall Street.

However, as the news suggests the Fed’s indirect recalling of the pandemic-led relief measures, investors do worry for the monetary policy adjustments and the same weigh on the risk appetite.


Main Pairs Movement:

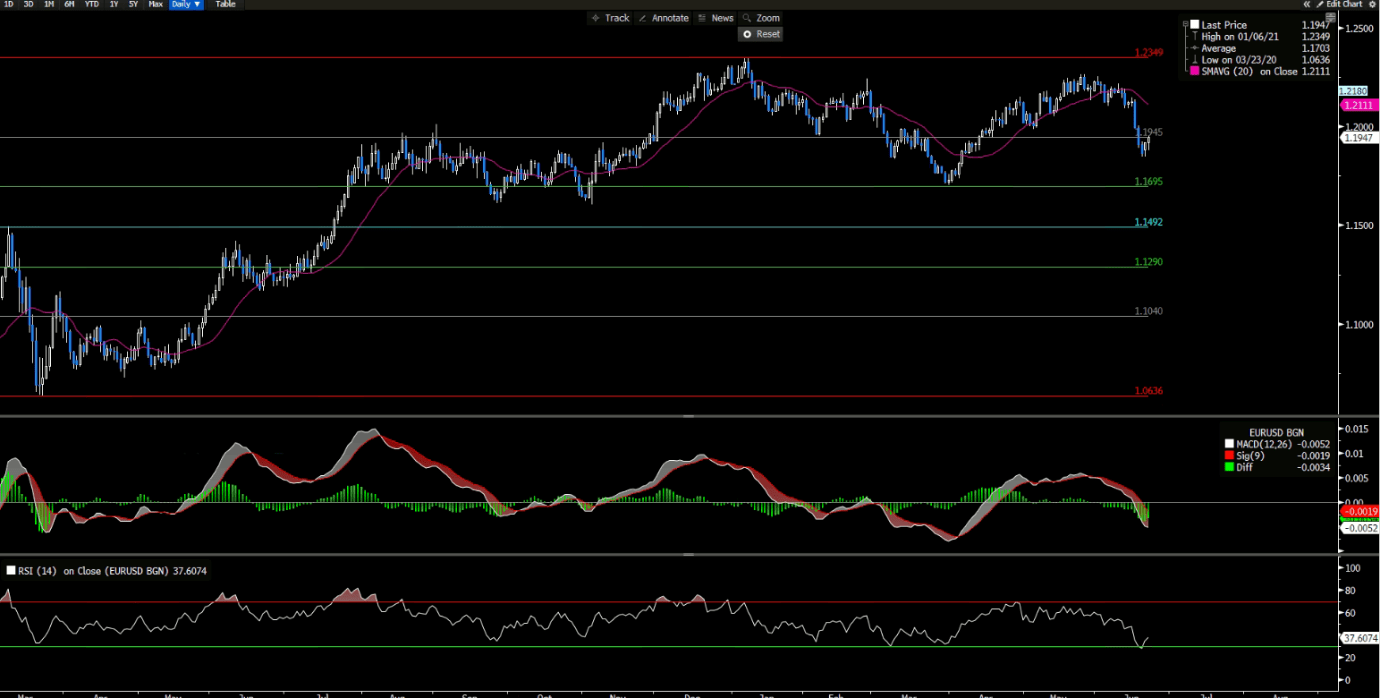
Similar to the previous day, the greenback lost some ground throughout the first half of the day, to recover most of it during the American session. Trading was dull as released economic data were mixed. The euro pair hovered around familiar levels above the 1.1900 level, while antipodean currencies consolidated against their American rival. Loonie closed at 1.2320, slightly higher than yesterday.

US data was somewhat encouraging, although most of the figures missed the market’s expectations. Weekly Initial Jobless Claims printed at 411K, while the previous weekly figure was revised to 418K. Durable Goods Orders were up 2.3% in May, while the Q1 GDP was confirmed at 6.4%. The numbers indicate that the US economic recovery may have reached a plateau. It is not bad news but may prevent the greenback from strengthening further.

Sterling was the worst among the major currencies, falling after the BoE’s monetary policy announcement. As widely anticipated, policymakers remained rates and easing programs unchanged. However, the following statement offered a dovish tone. “The Committee does not intend to tighten monetary policy at least until there is clear evidence that significant progress is made in eliminating spare capacity and achieving the 2% inflation target sustainably.” Apparently, clichés were not satisfying. Speculators were looking for a more hawkish tilt. Cable trades around 1.3910.

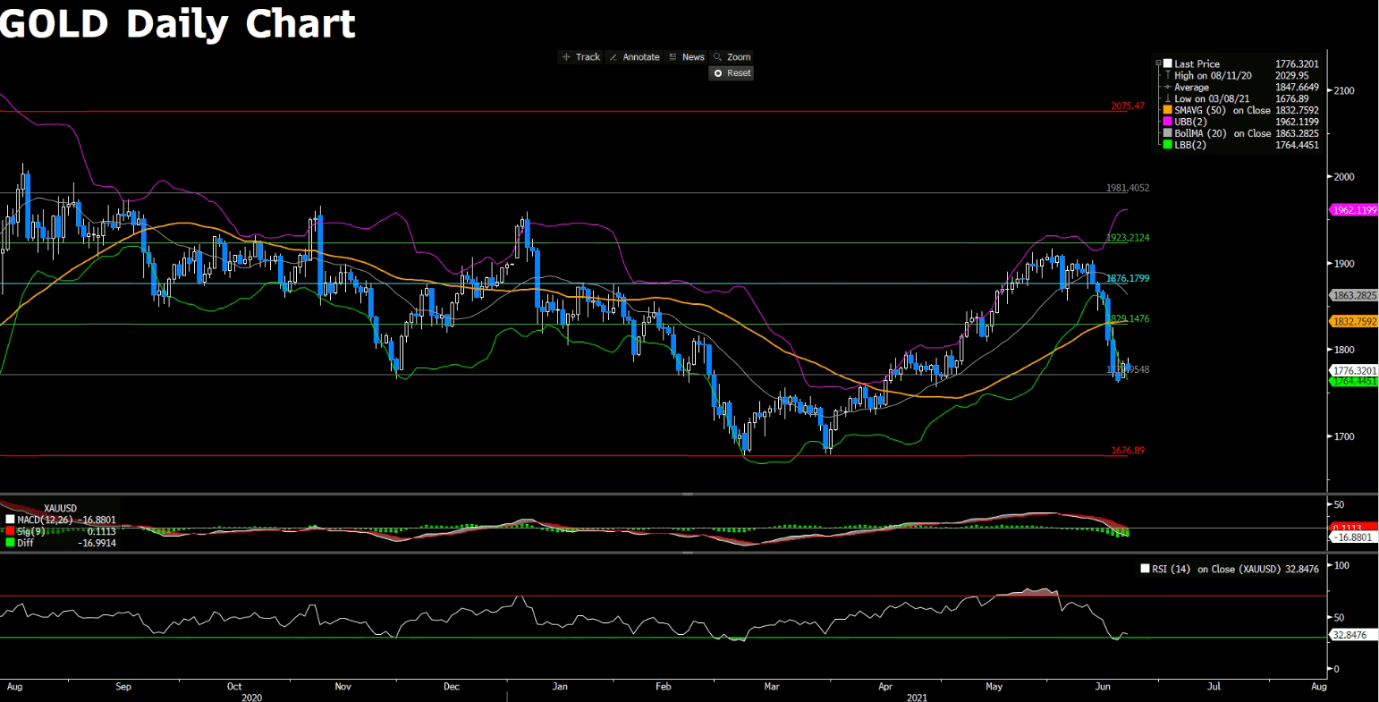
Gold faced headwinds during the US afternoon, as stocks reached record high. The rally in equities was backed by US President Joe Biden’s announcement, as he said that they reached a bipartisan deal on the infrastructure spending plan. The yellow metal settled at around $1,775.00 per ounce.

Crude oil prices bounced from intraday lows, posting modest daily gains. WTI settled at $73.30 a barrel, while Brent stands firmly above $75.00, trading at $75.54 as of writing.

Cryptos are on the way to recover its huge loss on Monday. Bitcoins traded higher in a third consecutive day, attacking the $35,000 resistance; Ethereum alike tried to break though the $2,000 level, trading at $1,990 at the moment.


Technical Analysis:

USDJPY (4- Hour Chart)

USDJPY erodes overnight gains from the highest level during the American session as the mixed signals on the US inflation concerns keep the greenback bulls on the defensive. From the technical perspective, after contesting the resistance level of 111.12, USDJPY struggles to find acceptance above the level, resulting in a pullback afterward. However, the pair remains its offered tone since it continues to trade within the ascending channel, signaling that the bullish momentum has not ended yet; the pullback might be a signal to adjust its overbought readings as the RSI was around 70 when the pair hit 111.12 on the 4- hour chart. At the same time, sustainly advancing above its simple moving averages also supports USDJPY’s bullish traction.

Resistance: 111.12

Support: 110.51, 109.14, 109.84


EURUSD (4- Hour Chart)

EURUSD enters consolidative phase as both currencies are without clear directional strength. On the 4- hour chart, the pair shows that it keeps finding the support level of 1.1919 while trading in between the upper bounce and the midline of the bollinger band, showing that the pair is poised to extend its bullish momentum in the near- term. The short- term bulls are supported by the MACD, as the MACD line is above the signal line. To the upside, if the pair successfully breaches this consolidative phase around 1.1919 region, then it will head toward the next resistance of 1.1985 to 1.2000, where the psychological level is. Technical indicators aim higher after consolidating around their midlines, which reflect the greenback’s limitation.

Resistance: 1.1985, 1.2052

Support: 1.1919, 1.1837


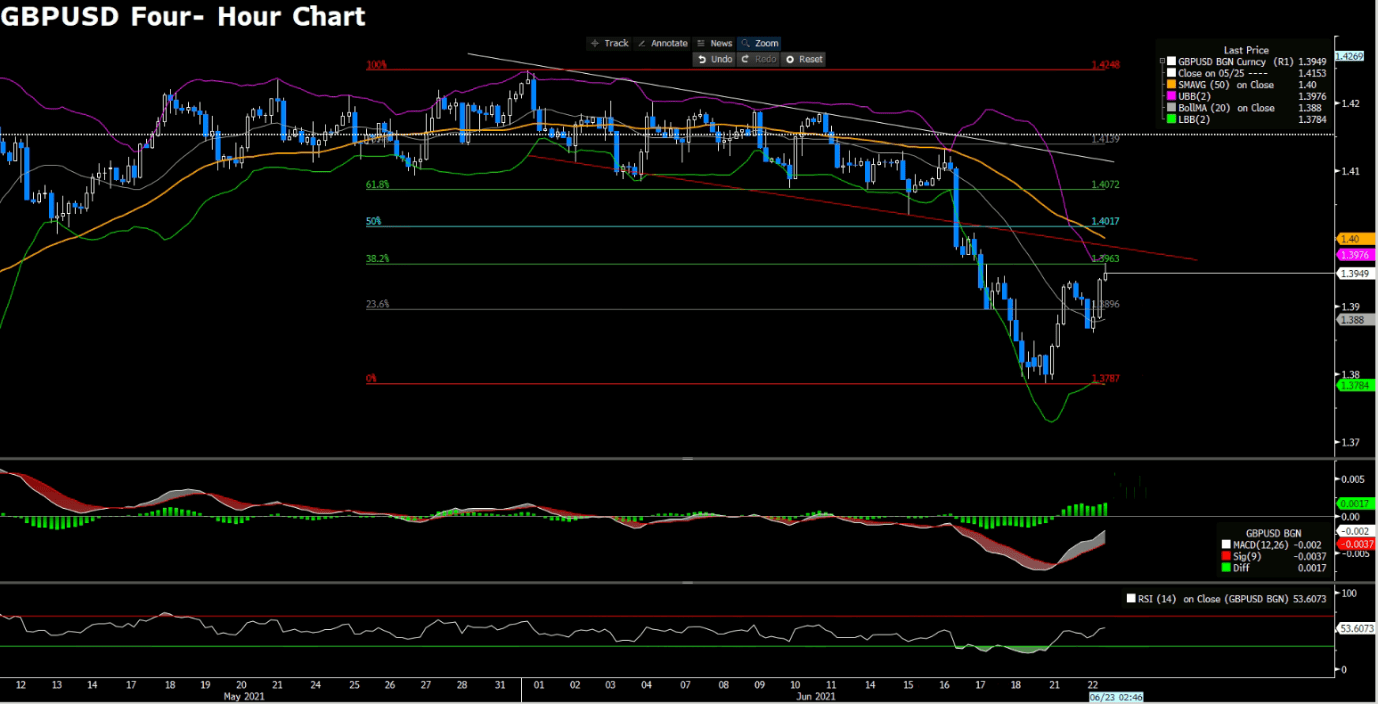
GBPUSD (4- Hour Chart)

The British pound weakens against the greenback on diappointing BOE as BOE decides to maintain the monetary policy on hold, not intending to tighten the monetary policy. From the technical perspective, after the strong move this week, GBPUSD slides as the double top formation was previously formed in the near- term. The consoliadation might take places as the RSI is in the neutral condition and the pair is at the moment trading on the midline of the bollinger band, which signal that the clear move of the pair is indecisive as of now. And the price range for the consolidation is expected to see in between 1.3963 and 1.3896. To the downside, a convincing breach below 1.3896 will be seen as a fresh trigger for the bears; on the other hand, a break above 1.3963 will be seen as a short- term bullish momentum.

Resistance: 1.3963, 1.4017, 1.4072

Support: 1.3896, 1.3787


Economic Data

Currency

Data

Time (GMT + 8)

Forecast

USD

Fed Bank Stress Test Results

04:30

N/A

JPY

Tokyo Core CPI (YoY) (Jun)

07:30

-0.1%

JPY

CPI Tokyo Ex Food and Energy (MoM) (Jun)

07:30

N/A

USD

Core PCE Price Index (YoY) (May)

20:30

3.4%

USD

PCE Price index (YoY) (May)

20:30

N/A

Daily Market Analysis

Market Focus

US equities traded in narrow range as momentum ran out of fuels. The tech heavy Nasdaq 100 index continue to make new highs to 14,274, lifted by rally in Tesla Inc. On the other hand, S&P 500 and the Dow Jones Industrial Average Index closed in the red, dipped 0.11% and 0.21% respectively.

The well-respected Dallas Fed President Robert Kaplan noted that the economy will likely outperform Federal Reserve’s expectation, leading to a possible early start of its tapering program. He explicitly said “I think we’d be far better off, from a risk-management point of view, beginning to adjust these purchases of Treasuries and mortgage-backed securities” during an interview with Bloomberg News. Wednesday’s upbeat manufacturing PMI of 62.6, the highest figure since 2007, further underpins a strong economic recovery in the US.

Treasury Secretary Janet Yellen said her department may start to ease emergency measures to avoid breaching the US debt limit as soon as August. ‘Suspension of debt limit’ means the Treasury Department can borrow as much as they need to pay off its current debts and obligations. With the current suspension set to expire on July 31, Yellen urged Congress to extend the suspension or increase the ceiling, and warned failing to do so would have absolutely catastrophic economic consequences.


Main Pairs Movement:

Major pairs are playing tug of war between gains and losses while trading at familiar levels on Thursday. Sentiment led the way, with currencies following the lead of stocks. USD fell throughout the first half of the day, regaining most of its lost at the final trading session of the day. The exception was USD/JPY which extended to a fresh yearly high of 111.10.

Markit released its June PMIs for all major economies. In general, the manufacturing sector recovery keeps outpacing that on the services sector. Despite mixed numbers, all figures indicated economic expansion.

The euro pair ended the day around 1.1930, slightly lower than yesterday, while cable settled around 1.3970, holding on to modest intraday gains. Commodity-linked currencies advanced against the greenback for a third consecutive day due to rising commodity prices, oil price as an example.

Gold once surged to $ 1,794.98 a troy ounce but changed course during the US afternoon and appeared doji at the end of the day.

Crude oil primers peaked at fresh yearly highs, easing modestly ahead of the close. WTI settled above $ 73.00 a barrel, as well as Brent touched $76 after the EIA reported that stockpiles decreased by 7.6 million barrels in the week ending June 18, better than anticipated.

The Bank of England is having a monetary policy meeting, although no fireworks are expected this time, as the bank won’t publish fresh macroeconomic projections, while there won’t be a speech from Governor Bailey.


Technical Analysis:

USDJPY (Four- Hour Chart)

USDJPY edges higher as Bank of Japan points to persistenetly low inflationary pressure while Powell cools down inflationary concern. On the four- hour chart, USDJPY is bullish in the outlook as it is well located in the ascending channel. At the moment, the pair even extends further above the trend line, heading toward the next immediate resistance of 111.10, which gives the pair more momentum to the upside. In the meanwhile, the piar keeps advaning above all of its SMAs, which indicates that the pair is gainning bullish traction. However, the pair might possibly confront an adjustment as the RSI is nearly in the overbought readings whilist the pair has reached the upper bounce of the bollinger band.

Resistance: 111.10

Support: 110.25, 109.72, 109.29


EURUSD (Daily Chart)

EURUSD weakens after hitting six- day highs at 1.1970, the highest since last Thursday. Failing to breach its resistance level of 1111 means that the pair is losing its short- term bullish tone. A consolidation will be likely to happen in the range of 1.1945 and 1.1860, which are the immediate resistance and support. On the daily chart, the pair remains bearish as it continues to trade below its SMAs; meanwhile, the MACD signals the note that the bearish momentum continue to be in control. To the upside, the pair needs to climb all the way up above 1.207 to reverse its current bearish mode. Otherwise, the pair remains bearish as the time of writing.

Resistance: 1.1945, 1.2349

Support: 1.1695, 1.1492, 1.1290


GBPUSD (Four- Hour Chart)

GBPUSD advances for the third session toward psychological resistance of 1.4000. Despite of still falling below the ascending channel, the pair seems to be on the track toward its bullish mode. Recent bullish move is not over yet, as the RSI is still outside of the overbought terriotry and the MACD is postive, lending supports to bulls. To the upside, the pair is heading to its next immediate resistance of 1.3968; if the pair can successfully breach the level, then it is one step closer back to the bullish trend.

Resistance: 1.3968, 1.4017, 1.4072

Support: 13896, 1.3787


Economic Data

Currency

Data

Time (GMT + 8)

Forecast

EUR

ECB President Lagarde Speaks

00:00

N/A

EUR

German Ifo Business Climate Index (Jun)

16:00

100.6

GBP

BoE Interest Rate Decision (Jun)

19:00

0.1%

GBP

BoE MPC Meeting Minutes

19:00

N/A

USD

Core Durable Goods Orders (MoM) (May)

20:30

0.8%

USD

GDP (QoQ) (Q1)

20:30

6.4%

USD

Initial Jobless Claims

20:30

380K

Daily Market Analysis

Market Focus

Stock futures opened slightly higher Tuesday evening, holding onto gains from the regular session. The three major indexes ended higher for a second straight day, and the Nasdaq Composite surged to a record high as technology stocks outperformed. Microsoft (MSFT) shares steadied after jumping to a record level, bringing its market cap up to $2 trillion.

The S&P 500 extended gains into a second day as the Fed chief said he’s got “a level of confidence” that prices will eventually come down, while noting that it would be “very, very unlikely” to see the kind of 1970s-style inflation. In a testimony to the House Select Subcommittee Tuesday, Powell also said that a 5% inflation environment wouldn’t be acceptable, and urged patience at evaluating data on prices.

“So inlfation is larger than they expected,” said Art Hogan, chief strategist at National Securities. “That part is true. But the part about that’s going to force their hand faster than we think is the part that he’s pushing back on. I think markets have calmed down about that.”

Earlier Tuesday, New York Fed President John Williams noted that a discussion about raising interest rates is still “way off in the future.” At the same time, his Cleveland counterpart Loretta Mester said very low rates for a long period of time and unconventional policy tools such as asset purchases can lead to too much risk-taking and financial-stability issues.


Main Pairs Movement:

Optimism returned to financial markets and weighed on the greenback. However, dollar’s losses were limited and seemed corrective after last week’s surge. US Federal Reserve chief Jerome Powell testified before Congress on the Fed’s response to the pandemic.

High-yielding currencies posted modest intraday advances. The euro pair is currently trading at 1.1930, cable stands at 1.3940, while aussie hovers around 0.7560. The loonie pair approached the 1.2300 level, while ninja nears 2021 high at 110.96.

UK Health Minister Matt Hancock said covid-related data looks encouraging and suggests lockdown can fully end on July 19 as planned because a recent rise in cases is not resulting in deaths. On the other hand, concerns arose globally after the report of a new covid variant called Delta Plus, which may trigger new waves.

Little action around commodities. Gold keeps hovering around $ 1,780 per ounce, while crude oil prices retained gains. WTI settled at $73.00 a barrel, and Brent again stands on the $75.00 price level.

Cryptocurrencies were extremely volatile in the previous day. Bitcoin once tumbled below $30000, first time since January, and now rebouned back to $33500. Ethereum alike plummeted to its lowest level since March, and now struggled to get back to the $2000 price level.


Technical Analysis:

XAUUSD (Daily Chart)

Gold trades in a narrow range, around $1770ish, amid Powell’s testimony. In the near- term, bulls seem to be in control of gold as gold has breached the key resistance at $1770.95. In the meanwhile, both RSI and bollinger band signal that gold still have chance to the upside as the RSI is slightly above the oversold territory and gold is currently in the lower band of bollinger band, suggesting that gold is due to a bounce back. To the upside, if gold can climb all the way to its next resistance around $1820, then it will confirm its bullish as it will trade above the 50 SMA. Otherwise, the downside momentum is still in control in the bigger outlook.

Resistance: 1786.38, 1811.25, 1836.12

Support: 1755.6, 1705.86


EURUSD (Daily Chart)

EURUSD edges higher above 1.1930 level during the American trading hour. From the technical perspective, the pair remains bearish in the short- term as it continues to fall within the descending channel. The pair keeps clinging around Fibonacci resistance, the 61.8% retracement at 1.1945. On the daily time frame, the pair is scheduled to the downside as it is unable to recover above the 20 SMA. The technical indicator, RSI, retreats from the previous oversold territory whilst the MACD continues to lend supports to the bears. All in all, the pair remains skewed to the downside unless it can advance and breach above the 20 SMA, which is around 1.2100 level.

Resistance: 1.1945, 1.2349

Support: 1.1695, 1.1492, 1.1290


GBPUSD (Four- Hour Chart)

From the technical aspect, after the recent decline, GBPUSD reverses from bearish to bullish in the near- term. The bulls seems to be held and supported by the technical indicators; MACD is now bullish, lending supports to bulls, whilist the RSI is outside of the overbought territory, giving the pair rooms to extend further north. On the four- hour chart, the pair is heading to its next resistance at 1.3963. In order to turn bullish in a bigger outlook, the bulls need to break the price to the resistance level of 1.4139 to return to its former ascending channel. So far, the sterling is moving away from the descending trend line; further move of the pair will be afftected by the announcement of the BoE’s meeting.

Resistance: 1.3963, 1.4017

Support: 1.3896, 1.3787


Economic Data

Currency

Data

Time (GMT + 8)

Forecast

EUR

German Ifo Business Climate Index(June)

16:00

100.6

GBP

BoE Interest Rate Decision (Jun)

19:00

0.1%

GBP

BoE MPC Meeting Minutes

19:00

N/A

USD

Core Durable Goods Orders (MoM) (May)

20:30

0.8%

USD

GDP (QoQ) (Q1)

20:30

6.4%

USD

Initial Jobless Claims

20:30

380k

Daily Market Analysis

Market Focus

Dow Jones futures, along with S&P 500 futures and Nasdaq 100 futures, were higher late Monday following the Dow Jones-led stock market rally. On Monday, the tech-heavy Nasdaq gained 0.84% (118.5 points), while the S&P 500 rallied 1.4% (59.2 points). The Dow Jones Industrial Average surged 1.8%, or 586 points. Among the Dow Jones leaders, Apple (AAPL) advanced 1.4% Monday, while Microsoft (MSFT) moved up 1.2% in today’s stock market; Tesla (TSLA) fell 0.4% Monday, as it battles to retake its long-term 200-day moving average.

Federal Reserve Chair Jerome Powell said inflation had picked up but should move back toward the U.S. central bank’s 2% target once supply imbalances resolve. “Inflation has increased notably in recent months,” Powell said in written remarks prepared for his Tuesday testimony before the House Select Subcommittee on the Coronavirus Crisis, citing increases in oil prices and a “rebound” in spending as the U.S. economy reopens. “As these transitory supply effects abate, inflation is expected to drop back toward our longer-run goal.” he said.

However, some Fed officials estimate that the central bank may need to tighten policy sooner than it expects. Dallas Fed President Robert Kaplan said he favors starting the process of tapering the central bank’s ongoing bond purchases “sooner rather than later,” while his counterpart from St. Louis, James Bullard, called it “appropriate” that policy makers last week opened the taper debate. Neither Bullard nor Kaplan votes on the Federal Open Market Committee this year.

Powell’s remarks reprised his opening comments at his June 16 press conference, following a policy meeting of the central bank. Investors will tune in to the hearing Tuesday for potential questions that shed more light on his view on the pace of the economic rebound and for how much longer the central bank should keep its monetary policy on an emergency footing.


Main Pairs Movement:

Dollar underwent a correction due to its extreme overbought conditions, but it remains the strongest currency across the Forex board. It lost most of its gains in the previous day during the North America session amid solid equity rallies.

Euro pair corrected up to 1.1920, holding nearby at the end of the day. ECB’s President Christine Lagarde said that the outlook for the euro area economy is brightening as the pandemic situation improves but warned about the need to remain vigilant, suggesting that tightening would be premature.

Cable surged on the optimistic market mood despite worrisome comments from the UK Prime Minister Boris Johnson. Johnson said that cases of the coronavirus Delta variant are still going up, and thus they need to be cautious on easing restrictions. He then added that data is looking good ahead of the July 19 deadline, but traveling will still be “difficult.”

Aussie trades around 0.7540, helped by the better performance of equities. Loonie pair plummeted over 100 pips on a daily basis, benefitting from the greenback’s corrective decline and soaring crude oil prices. WTI closed the day at $73.00 a barrel, while Brent climbed 2.20% during the day. Gold posted a modest daily advance. Spot gold settled at $ 1,784 a troy ounce.


Technical Analysis:

XAUUSD (Daily Chart)

Gold looks to pick up the recovery after dropping to the monthly low. In the near- term, it is expected to see some bulls on gold as it needs an adjustment from its oversold condition. From the technical indicators, both RSI and bollinger band show that gold needs a rest from its bearish momentum. The RSI is currently near 30 level, indicating that gold is due to a bounce back; at the same time, gold has reached the very lower band of bollinger band, which also suggests a bounce back from gold. At the moment, gold is clinging at the resistance level, 1780ish; to the upside, if gold can successfully breach the resistance, it will head toward 1811.25.

Resistance: 1786.38, 1811.25, 1836.12

Support: 1755.6, 1705.86


EURUSD (Daily Chart)

EURUSD recovers back to 1.1910 level to start the week as the time of writing, correcting extreme oversold conditions from last week. The pair remains bearish as it declined all the way below the descending channel to a new low last week; despite of showing a bounce back on Monday, the outlook remains bearish. After plunging sharply to April’s support level at 1.18760, the pair bounces back a little to its immediate resistance level at 1.1945. At the moment, the RSI is located at 30ish level, which is close to the oversold territory, giving the pair rooms to bounce back for an adjustment. Moreover, the MACD seems to turn positive on the four hour chart, lending supports to bulls. As the time of writing, EURUSD is trading along the resistance level at 1.1945; if it can successfully breaches the level, it will potentially head to the next resistance at 1.2070; otherwise, the pair might consolidate in the range of 1.1945 and 1.18760 in the near- term.

Resistance: 1.1945, 1.207, 1.2175

Support: 1.18760, 1.1695


GBPUSD (Four-Hour Chart)

GBPUSD advances beyond 1.3900 today, extending the corrective pullback. From the technical perspective, the intraday retreat from 1.3800 level could be attributed to a correction from the previous oversold condition. On the four- hour chart, GBPUSD remains bearish as it continues to fall below the descending channel; however, the short- term momentum seems to turn bullish as the technical indicator, RSI, is currently in the neutral position, giving the pair rooms to extend further north; in the meantime, the MACD has turned to positive, lending supports to bulls. To the upside, GBPUSD is expected to head toward the next immediate resistance at 1.3963, and 1.3896 will become the immediate support for the pair.

Resistance: 1.3896, 1.3963, 1.4017

Support: 1.3787


Economic Data

Currency

Data

Time (GMT + 8)

Forecast

BRL

BCB Copom Meeting Minutes

19:00

N/A

USD

Existing Home Sales

22:00

5.72M

VT Markets The Adjustment Of Weekly Dividend Notification

Dear Client,

Warmly reminds you that the component stocks in the stock index spot generate dividends. When dividends are distributed, VT Markets will make dividends and deductions for the clients who hold the trading products after the close of the day before the ex-dividend date.

Indices dividends will not be paid/charged as an inclusion along with the swap component. It will be executed separately through a balance statement directly to your trading account, the comment for which will be in the following format “Div & Product Name & Net Volume ” .

Please note the specific adjustments as follows:

If you’d like more information, please don’t hesitate to contact info@vtmarkets.com.

Daily Market Analysis

Market Focus

US equity market declined on four-consecutive days. The Dow Jones Industrial Average index suffered the most, dropped 1.58%. Meanwhile, the tech heavy Nasdaq and the S&P 500 index also fell 0.81% and 1.31% respectively. All sectors within the S&P 500 settled in the red.

The European Central Bank will allow banks to exclude deposits held at the central banks when calculating their leverage ratio until March next year. The ECB’s attitude toward a loose leverage ratio is a strong contrast to the US, which the Fed has ended a similar exemption in March. It further reveals European banks’ dependence on bank loans, rather than capital markets, as a source of corporate financing.

Michael Burry, one that is famous for winning bet against housing bubbles in 2008, has warned retail traders about “losses as the size of countries” in the event of crypto and meme-stock declines. “When crypto falls from trillions, or meme stocks fall from tens of billions, #MainStreet losses will approach the size of countries. History ain’t changed,” tweeted from Burry. Worth mentioning today is quad-witching day, with tons of stock and index options set to expire, options’ gamma will also deplete. It will take some time for gamma to refill, which leaves room for volatility to kick in.


Main Pairs Movement:

The US dollar rally continues on Friday, with the dollar index soared to 92.2 from pre-FOMC’s 90.5, refreshed the largest weekly gain since last March. Non-US currencies are flashing oversold across four-hour and daily timeframes, and we anticipate a cool off or rebound during next week’s trading.

All other major currencies were dropping against the dollar greenback on Friday except for the Japanese Yen. The 10-year US Treasury yields have been falling on Thursday and Friday, dipped total of 14 basis point to settle around 1.447%. It seems like investors are pricing in a high inflation in the near future as observed from a tightening in the 2- and 10-year bond yield spread. Short-dated bonds are less desirable if near term inflation remains high, the shift in demand from short-dated to longer term bonds will create downward pressure on long rates. With rates dropping in the long-end of the yields curve, carry trade investors want to undo their position, thus enhance the value of Japanese Yen.

Oil price continues to advance after a temporary pullback. With economic activities gradually return to pre-pandemic levels, demand for crude oil in either industrial or household use may outrun supply in the short term, therefore causing a surge in oil price. We may see yet accelerating upward momentum in fuel price as summer approaches. WTI and Brent crude oil gained 0.87% and 0.55% on Friday.


Technical Analysis:

XAUUSD (Daily Chart)

Gold looks to end its five-consecutive plunge after finding some support around $1770. The yellow metal rebounded to contest 50% Fibonacci level of $1798 earlier today, but the upward momentum quickly faded. Nonetheless, the sell off decelerated around $1770, and has hope to slowly recover some of its losses as daily RSI breaching oversold threshold, thus will prompt some profit-takings from sellers. The immediate resistance remains to be today’s high of $1798, followed by 1825. We cannot completely rule out a further plummet as current fundamentals are acting against inflation-hedge Gold.

Resistance: 1798, 1825, 1860

Support: 1770, 1734, 1680


USDCHF (Daily Chart)

USDCHF lifted off post hawkish Fed announcement, appreciation in the last three days completely erased losses in the past two months. Multiple key resistance lines failed to contain the bulls, and price went straight to challenge March support line at 0.923, which also marks the 61.8% Fibonacci level. We expect some pullbacks to take place next week towards 0.9154, if breached then 0.908 may lend some support to the continuation of an uptrend. RSI is on the verge of a overbought zone, currently printing 69.3.

Resistance: 0.923, 0.932, 0.947

Support: 0.916, 0.908, 0.9


GBPUSD (Daily Chart)

Cable officially ended its bullish trend which started from July 2020 by breaking a big ascending trendline. Price is currently finding ground at 1.38 handle, and we expect this pair to retrace upward to validate some of the key levels such as 1.389 and 1.396. The selling bias were certainly very strong this week given reopening concerns in the UK and the Fed’s surprise. However, UK remains to be top listed country to initial a full reopening, so investors need to keep a close eye on developments of the mutated virus in Britain. Any positive headline could easily boost Sterling, though it is unlikely to recapture the mentioned upward trendline.

Resistance: 1.4, 1.422, 1.437

Support: 1.382, 1.368, 1.352


Economic Data

Currency

Data

Time (GMT + 8)

Forecast

GBP

BoE Gov Bailey Speaks

21:00

Daily Market Analysis

Market Focus

Reflation trades that have ruled the market for most of 2021 were in retreat Thursday. Stock market was mixed. Dow Jones slumped 0.62%, while Nasdaq rose 0.87%. Tech stocks are back in favor of the investors, the old world order in stock seems back as reopening trade takes lumps.

一張含有 文字 的圖片

自動產生的描述

“The recent moves across the curve are interpreted by some as a sign of declining growth prospects,” said Adam Phillip, managing director of protfolio strategy at EP Wealth Advisors. “And when the outlook for growth dims, investors gravitate back to growth-oriented stocks.”

On the other hand, debates amid the newly signed federal holiday have taken place in the Wall Street. While most government workers will be granted paid time off Friday as the holiday falls on Saturday this year, the same won’t be true for financial markets. Before deciding whether to close , U.S. exchanges rely on input from several participants including banks, broker-dealers and regulators.

The Fed plans to operate normally Friday and Monday, but SEC decides a day-off. Any decision about whether to make Juneteenth a market holiday “will be part of our annual calendar review during which we consult with stakeholders,” Katrina Cavalli, a Sifma spokeswoman, said in an e-mailed statement. CMC Group Inc., the wrold’s largest futures exchange, will follow Sifma’s lead, according to its spokeswoman. The holiday also falls on a weekend in 2022.


Main Pairs Movement:

Greenback continued to win over most of its major rivals, except JPY, which was supported by falling government bond yields. However, traders keep pricing in the latest hawkish stance from the US Federal Reserve, which indicated two rate hikes in 2023 amid escalating growth and inflation forecast.

Fiber hovered around 1.19, while cable bounced up and down at 1.39, struggling to rebound. Antipodean currencies advanced at the beginning of the day due to upbeat New Zealand GDP and better-than-expected Australian employment figures, but soon the robust American dollar resumed its advance, pushing rivals to multi-month lows. Aussie bounced off it yearly low at 0.7532, one step ahead of a steeper slide. Loonie trades around 1.235, its highest since late-April.

Commodities slumped hard during the day. Gold made its fifth decline to $1,767.29, while oil prices were also down, but managed to bounce a bit ahead of the close. WTI settled at $71.00 a barrel, and Brent $73.00.

US Treasury yields retreated from post-Fed peaks. The yield on the 10-year Treasury note currently stands around 1.506% after hitting 1.594%.

Cryptos continued their correction. Bitcoin climbed to $39559 earlier today, and hours later plummeted below $38000. Ethereum basically followed its big brother’s step, with a daily high at $2460.5, and once flirted with the $2300 support line.


Technical Analysis:

EURNOK (Daily Chart)

EURNOK has started its corrective trend since late-April. The 50% Fibonacci appears to be a strong resistance for its upward attempts, and there’s a greater headwind from the fundamantal side. The Norges Bank’s hewkish messege which depicted the whole rate-hiking blueprints was released this morning. The cross plunged to the 38.2% Fibonacci at the moment but soon rebounded to its previous level, failing its yet again attempt to break 50% Fibonacci, and now trades at 10.174, a price in between. In our opinion, the disappointing market reaction derived from the investors focusing more on the post-FOMC phenomena. However, rate differentials will provide a consistent downward traction for EURNOK, and we anticipated that the cross will move to fresh low below 9.90 at the end of the month.

Resistance: 10.191, 10.259, 10.344

Support: 10.122, 10.037, 9.900


XAUUSD (Daily Chart)

XAUUSD has sharply declined for two consecutive days and breached every DMA support due to FOMC’s hawkish signals. Gold breached below $1800, and traded at a price last seen in mid-Apirl. On the downside, the $1765 support line awaits violation, and since there’s no apparent support after that level, the yellow metal may go straight forward to the yearly low at $1680 and call for a rebound. On the technicals, the MACD histogram appears strongly bearish, and the RSI indicator has just landed at the oversold territory. Given the robust selling pressure and negative fundamentals, we speculates the pair to extend further south if it really breaks the $1765 support.

Resistance: 1809, 1850, 1905

Support: 1756, 1678


GBPJPY (Daily Chart)

GBPJPY breached the symmetrical triangle and stretched lower to the south today as the safe-haven JPY took advantage of the risk-off market sentiments after the FOMC meeting, and concerns on the EU-UK conflict over Northern Ireland protocol as well as the delayed lockdown easing in England keeps acting as headwinds for the pound.

On the technicals, the MACD histogram remains bearish, while the RSI indicator dropped below 50, suggesting a negative market mood toward the cross. Given available information, we speculate that the downward adjustment may persist, unless the upcoming Japan inflation data and BOJ meeting surprise the market.

Resistance: 155.30, 156.076

Support: 151.266, 149.064


Economic Data

Currency

Data

Time (GMT + 8)

Forecast

JPY

BoJ Monetary Policy Statement

11:00

JPY

BoJ Interest Rate Decision

11:00

-0.1%

JPY

BoJ Press Conference

14:00

VT Markets The notification of MT4 software version upgrade

Dear Client,

In order to provide you with a better user experience with VT Markets, we are glad to announce that we will upgrade our MT4 software and server to version 1335 on June 19, 2021 (Saturday), so as to ensure a better trading experience.

If your software version has not been updated yet, we sincerely recommend that you upgrade to the latest version (1335) after June 19, 2021.

The steps to check your MT4 software version are as follows:
PC: Open the MT4 software Help -About;
Android: Open the MT4 app – About;
iOS: Open the MT4 app-Settings – About.

For PC users, please uninstall the software and install the latest version from the following link:
https://www.vtmarkets.com/trading/platforms/metatrader-4/

For Android users, please go to the following link to update your MT4 version:
https://play.google.com/store/apps/details?id=net.metaquotes.metatrader4

For iOS mobile users, please go to the following link to update your MT4 version:
https://apps.apple.com/au/app/metatrader-4/id496212596

If you’d like more information, please don’t hesitate to contact trading@vtmarkets.com.

Daily Market Analysis

Market Focus

US equity market dropped as Federal Reserve is actually more hawkish than market expected. Though the initiation of tapering talk is widely anticipated, but two interest rate hikes by the end of 2023 reveal by the dot plot had investors surprised. The Nasdaq 100 and Dow Jones Industrial Average index lost 0.34% and 0.77% respectively. All sectors closed in the red within the S&P 500 index except for Consumer Discretionary shares. The 10-year US Treasury yield surged 7.5 basis points to 1.57%.

The Federal Reserve kept interest rate unchanged, and here are Bloomberg’s key takeaways from the FOMC statement and Chair Jerome Powell’s press conference:

– Inflation: Inflation forecasts for this year moved up, with PCE rising to 3.4% from 2.4% and core PCE to 3% from 2.2%. Next year’s forecasts for both edged up just a tenth of a percentage point to 2.1%, signalling Fed participants don’t see this year’s jumps lasting significantly into next year.

– Dot plot: The 2023 median dot was higher, a lot higher. It showed 13 officials seeing at least one rate hike in 2023 and 11 seeing two. Additionally, 7 participants are calling for a rate high as early as 2022. Only five members had rates unchanged, and the median is now 0.625%. Powell tried to calm the market by saying the main takeaway from the dot plot should be that many participants are more comfortable that the economic conditions in the Fed’s forward guidance will be met somewhat sooner than previously thought.

– Unemployment rate: forecast at 4.5 in 2021, 3.8 in 2022, and 3.5 in 2023 from 4.5, 3.9 and 3.5 respectively. Powell said labor supply and demand are not matching up well, but that it should clear in coming months.

– IOER: there was a five basis point hike to 0.15%.

– Tapering: Fed will begin meeting-by-meeting to assess progress towards goal and talk about tapering, and emphasize tapering will be “orderly, methodical and transparent”.


Main Pairs Movement:

Euro is the second worst performing currency against the dollar on Wednesday, the first being Swiss Franc, plunged 0.97% and 1.11% respectively. The Fed has turned from extreme dovish to slightly hawkish, and will finally start to kick off the long-expected tapering talks in forthcoming meetings. Given ECB’s plan to bulk up monetary and fiscal spending in the second half of 2021, this officially marks the divergence between Federal Reserve and European Central Bank. The outlook for Euro is not so bright in the 2H20.

Cable also fell 0.6% amid strengthening dollar. Today’s plunge is more likely a temporary shock to the Sterling rather than a long-term bearish trend like the Euro. Speculators are still factoring in the delayed of reopening from the Britain. However, we don’t think this delay will prolong into the summer given UK’s successful vaccination campaign. Once the delta variant concern is taken off the table, the UK economy will steer in full speed. An optimistic and hawkish BoE will continue to underpin the Pound, ad it is highly possible that they will act ahead of the Federal Reserve in easing QE.


Technical Analysis:

GBPUSD (Daily Chart)

Cable finally exited its consolidation phase from downside. After trapped within a tight range between 1.42 and 1.408 for more than a month, the bears are set to seek gains in the south. Price promptly plunged toward the ascending trendline after FOMC statement release, and was finding support around 1.402 as of writing. Further on the downside, an immediate horizontal resistance would be the big 1.4 round number, followed by May’s low of 1.38, and 1.367.

Resistance: 1.42, 1.437, 1.464

Support: 1.4, 1.382, 1.369


XAUUSD (Daily Chart)

XAUUSD continues to head south after penetrated the 2-month ascending trendline and DMA20 dynamic support. The yellow metal breached below 61.8% Fibonacci level of $1850, which previously defended bears’ attack. Closing below this level could open doors for sellers to capitalize on large downside space, where we might witness February’s huge plummet in gold price given the lack of inflation-hedge demand post FOMC meeting. On the downside, $1815 will be the next key level to watch for.

Resistance: 1890, 1920, 1960

Support: 1815, 1780, 1743


USDCAD (Daily Chart)

USDCAD is undergoing a U-shape recovery after price was extremely subdued for the past two-months. However, it is not completely out of the woods yet since a big downward trendline still hangs above current price level, we need to see a solid breakout from the trendline to confirm a bullish reversal in USDCAD. In the near term, this pair looks to contest 1.23 hurdle, and failing to overcome this level could put the bears back into the driver’s seat as the persistent higher oil price always bolsters the Canadian dollar.

Resistance: 1.23, 1.25, 1.264

Support: 1.2, 1.1925, 1.18


Economic Data

Currency

Data

Time (GMT + 8)

Forecast

NZD

GDP (QoQ) (Q1)

06:45

0.5%

AUD

Employment Change (May)

09:30

30.0K

CHF

SNB Interest Rate Decision

15:30

2.0%

CHF

SNB Press Conference

16:30

EUR

CPI (YoY) (May)

17:00

USD

Initial Jobless Claims

20:30

359K

USD

Philadelphia Fed Manufacturing Index (Jun)

20:30

31.0

USD

Fed Chair Yellen Testifies

22:00

Daily Market Analysis

Market Focus

US stocks retreated from their peaks after the retail sales missed the expectations. Tech shares closed in the red, with the Nasdaq 100 dropped 0.71%, and Dow Jones declined 0.27%. Energy shares gained traction, but still could not lift the S&P 500 index as Real Estates and Tech stocks dragging behind.

Investors remained calm ahead of Fed’s policy decision. The statement is set to include updated forecasts, and communication of any taper plans well in advance. “After nearly a year of anti-climactic FOMC meetings, tomorrow’s meeting has the potential to move markets because it will likely start the process of the Fed communicating tapering of this historic accommodation,” commented Tom Essaye former Merrill Lynch trader.

China called the US “very ill indeed,” after President Joe Biden formed an anti-China ally during his Europe trip. China Foreign Ministry spokesman Zhao critized Biden’s efforts to counter China’s global economic expansion and told reporters “The G-7 had better take its pulse and come up with a prescription.” Tension continues to mount between the developed nations and the rising giant, though no actions are taken so far, but such development worries investors.


Main Pairs Movement:

Market turned cautious after the US depressing retail sales figures and the better-than-expected PPI. Investors focus on news about the Delta variant of COVID and uncertainty US infrastructure as the Fed’s decision approaches. Cryptos are struggling to cling gains.

The dollar index performed well heading into the US opening but turned sour after the release of the macros, closing the day mixed. The swissy and the fiber are unchanged against its American rival, as well as the Japanese Yen, while the loonie and the sterling declined significantly.

US 10-year Treasury yields has breached 1.50% after US retail sales release, seemingly consolidating its previous gains. The UK and Canada CPI and industrial output also stand out on the economic calendar, along with the New Zealand GDP.

Oil price edged further north. WTI traded at $72.5, and Brent traded at $74.24, both recovering to the past-pandemic price level. Gold continues to fall, traded at $1858.82 as of writing.

Cryptos seems experiencing a correction. Bitcoin surged to $41330 earlier today, and rapidly dropped below $40000 within two hours, and Ethereum slightly decreased toward its $2,500 support after it bounced off $2,600.


Technical Analysis:

GBPUSD (Daily Chart)

GBPUSD has declined for three consecutive days, and the selling pressure seems still strong. The MACD histogram remains bearish, while the RSI indicator fell under 50. Sterling fell short for demand despite the goodish UK employment report as analysts are worried about the delay of the lockdown program forcing some struggling businesses to lay off. On the other hand, though Fed is supposed to remain monetary policy unchanged, a less dovish statement are still possible given the upbeat inflation figures, and this may further dragged the pair down. The instant support for cable appears at 1.40, followed by the quarterly low, 1.367.

Resistance: 1.424, 1.438

Support: 1.40, 1.367


USDCAD (Daily Chart)

After three consecutive week’s consolidations, USDCAD finally broke through the 1.2 to 1.215 interval. Similar to other major pairs, the breakthrough of the loonie derived from the expectations of a slightly less dovish Fed after the US greater-than-expected inflation figures poped up. The MACD histogram appears bullish, while the RSI indicator has just consolidated in the buy-side territory.

However, pressure from the rising oil price is still a concern, adding that the policymakers’ attitude toward the higher inflation is still unclear, a solid rebound is still questionable. The FOMC press conference that takes place this Wednesday will provide further instructions from the officials. The best strategy is to stay positive but prudent before that.

Resistance: 1.225, 1.2367

Support: 1.215, 1.20, 1.192


AUDNZD (Daily Chart)

AUDNZD was rejected by the 1.081 resistance last Friday and slipped below 1.080 at the beginning of the week, traded 1.0794 as of writing. The Australian dollar got slightly weaker on the dovish RBA meeting minutes as the policymakers suggested no rush to taper, albeit emerging reflation.

However, due to the technicals, the bullish sentiment seems to resume a little more time, as the RSI indicator still haven’t reached the overbought territory, and the MACD histogram remain positive. The strong 1.081 resistance level is the key. If breached, then, at least in the short term, the upside traction will still prevail.

Resistance: 1.081, 1.0945, 1.1045

Support: 1.060, 1.054, 1.042


Economic Data

Currency

Data

Time (GMT + 8)

Forecast

GBP

CPI (YoY) (May)

14:00

1.8%

CNY

Industrial Production (YoY) (May)

15:00

9.0%

USD

Building Permits (May)

20:30

1.730M

CAD

Core CPI (MoM) (May)

20:30

0.4%

USD

Crude Oil Inventories

22:30

-3.290M

USD

FOMC Meeting Minutes

02:00 (June 17)

USD

FOMC Statement

02:00 (June 17)

USDD

Fed Interest Rate Decision

02:00 (June 17)

Back To Top
server

Hello there 👋

How can I help you?

Chat with our team instantly

Live Chat

Start a live conversation through...

  • Telegram
    hold On hold
  • Coming Soon...

Hello there 👋

How can I help you?

telegram

Scan the QR code with your smartphone to start a chat with us, or click here.

Don’t have the Telegram App or Desktop installed? Use Web Telegram instead.

QR code