Bull Traps: Understanding How They Work and How to Spot Them
A bull trap happens when an asset’s price breaks above a key resistance level, tricking traders into thinking an uptrend is starting, only to reverse and drop back down. Recognizing a bull trap early can help protect your capital. In this article, we’ll cover what a bull trap is, how to spot one, and strategies to avoid or profit from it.
What Is a Bull Trap?
A bull trap is a deceptive market scenario where a price appears to break out upward, creating the illusion of a strong uptrend, only to quickly reverse direction and move downward. Traders often fall for this false signal, buying into what they believe is a legitimate breakout, only to be “trapped” when the price suddenly falls back below the breakout point.
In essence, a bull trap lures traders into making impulsive buys under the assumption that the price will continue to rise. However, it quickly becomes evident that the market was not in an uptrend, but rather setting up a false rally to shake out unsuspecting traders.
How Does a Bull Trap Work?
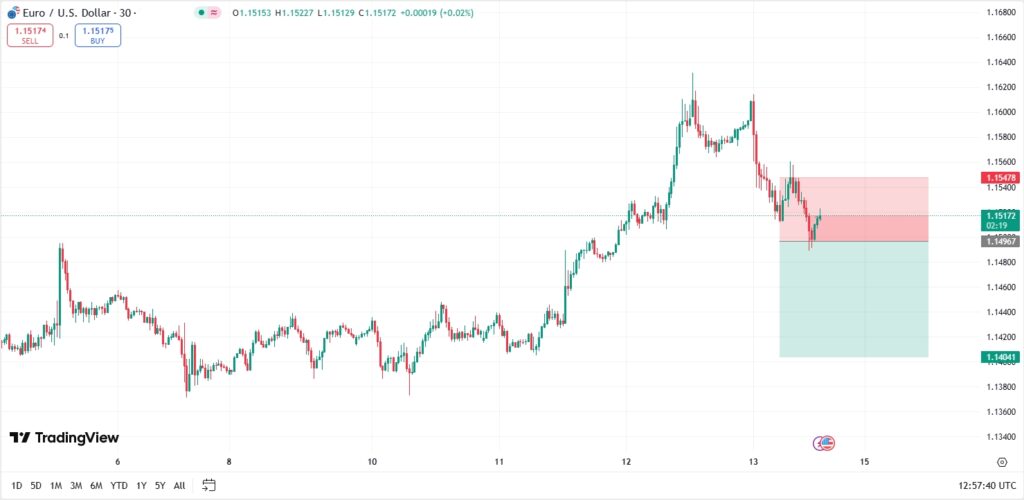
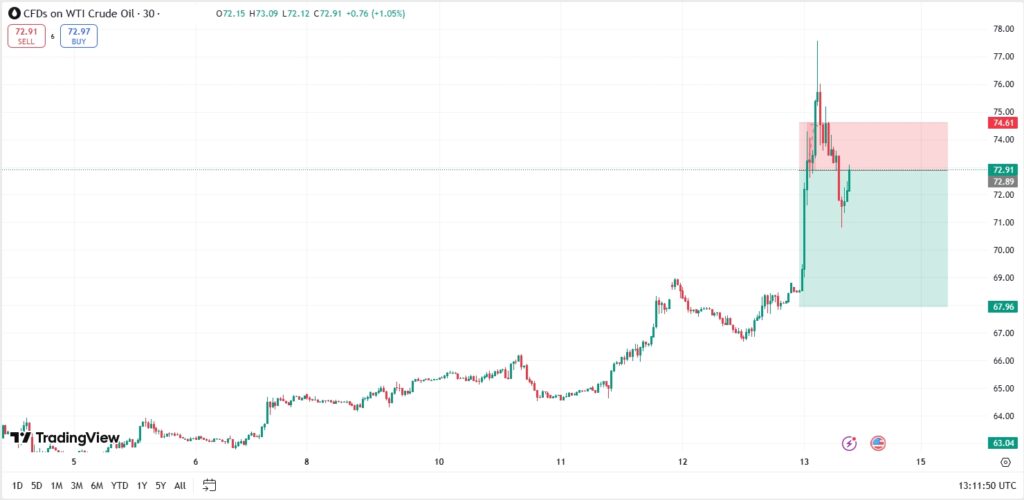
A bull trap typically forms when the price breaks above a well-established resistance level, encouraging traders to buy, thinking that the trend is about to surge higher. However, after the initial surge, the market quickly reverses direction, often driven by a lack of follow-through buying or a change in market sentiment.
For example, imagine a stock that has been trading in a range between $50 and $55. When the stock breaks above $55, traders rush in, expecting the price to continue rising. However, the breakout is short-lived, and the stock falls back below $55. This is a classic bull trap.
How to Identify a Bull Trap
Identifying a bull trap can be tricky, but there are key signs traders should watch out for:
1. Break of Resistance with Low Volume
A breakout above resistance without a corresponding increase in volume can indicate a false move. A real breakout usually has higher trading volume as more participants join in.
2. Failure to Hold Above Resistance
If the price moves above a key resistance level but fails to sustain itself above that level, it could signal a bull trap. This often happens within a few hours or days of the breakout.
3. Divergence in Indicators
Indicators like the Relative Strength Index (RSI) or MACD may show a divergence when the price rises, meaning that momentum is not supporting the move. If the price moves up but the indicators are weakening, this is a potential warning sign.
4. False Candlestick Patterns
Candlestick patterns such as Doji or Engulfing Candles after a breakout can signal a reversal, indicating that the breakout may have been a bull trap.
Example of a Bull Trap
A notable example of a bull trap occurred with Tesla in 2024. Tesla’s stock surged past $300, breaking new highs. Many traders believed the stock would continue to rise, given its strong performance over the preceding months. However, after hitting around $320, the price quickly reversed and dropped back below $270, trapping traders who had bought in during the rally.
This sharp reversal left many traders with substantial losses, demonstrating how quickly a bull trap can take shape, even in high-profile stocks like Tesla.
How to Avoid a Bull Trap
To avoid falling into a bull trap, traders must stay alert and make informed decisions. Here are some effective strategies to minimize the risk of being trapped:
1. Wait for Confirmation
Never buy immediately after a breakout. Wait for the price to hold above the breakout point for at least a few hours or even a day. Confirm that the breakout is genuine before committing capital.
2. Use Volume as an Indicator
Ensure that breakouts occur with substantial volume. A breakout with low volume is a strong warning that the move might be a false one.
3. Set Stop-Loss Orders
Protect yourself from falling into a bull trap by setting stop-loss orders just below the breakout level. This allows you to exit the trade quickly if the price reverses.
4. Look for Divergences
Watch for discrepancies between the price and technical indicators. If the price is rising but momentum indicators like RSI are not confirming the move, it might be a signal to stay cautious.
How to Trade a Bull Trap
Successfully trading a bull trap involves recognizing the pattern early and acting decisively. Follow these steps to trade a bull trap effectively:
Step 1: Understand How a Bull Trap Works
A bull trap occurs when the price breaks above a key resistance level, leading traders to believe an uptrend is beginning. However, the price quickly reverses and moves lower, trapping those who bought into the breakout. Understanding this pattern is crucial for successfully navigating the market.
Step 2: Select a Regulated Broker
Choose a trusted, regulated broker that offers a secure trading environment, fast execution, and advanced charting tools. A reliable broker like VT Markets provides the necessary resources to identify and trade bull traps with ease.
Step 3: Create & Fund Your Account
Register with your chosen broker and complete the verification process. Once your account is set up, deposit funds to begin trading. Ensure that your account is properly funded to take advantage of potential opportunities when the bull trap pattern forms.
Step 4: Identify the Bull Trap
Look for a sudden breakout above a key resistance level, followed by a quick reversal. The price action should show clear signs of moving back below the resistance level. This is when the bull trap is set, and traders who bought into the breakout will be trapped.
Step 5: Confirm the Reversal
Before taking any action, confirm that the trend has genuinely reversed. Use technical analysis like candlestick patterns, momentum indicators, and volume analysis to verify that the price is indeed moving lower and not just experiencing a minor pullback.
Step 6: Open a Position
Once the reversal is confirmed, enter a short position, betting that the price will continue to fall. Timing is crucial here, as entering the position too early or too late can impact your ability to capitalize on the movement.
Step 7: Implement Risk Management Strategies
To protect yourself from unexpected market movements, set stop-loss orders just above the recent high or key resistance level. This will limit potential losses if the market moves against your position, helping you trade with confidence.
Step 8: Monitor & Stay Informed
Keep a close watch on market news, price action, and key technical indicators. Stay informed about any events or announcements that might influence the market. Adjust your position or strategy if new developments suggest the trend may change again.
Bull Trap vs Bear Trap: Key Differences
While both bull traps and bear traps involve market deception, the key difference lies in the direction of the trap, as shown in the table below:
| Feature | Bull Trap | Bear Trap |
| Market Behavior | Price surges above a key resistance level, misleading traders into thinking a bullish trend is forming. | Price drops below a key support level, tricking traders into expecting a bearish trend. |
| Trader Reaction | Traders anticipate an uptrend and enter long positions, buying the asset. | Traders expect further declines and short the asset, betting on lower prices. |
| Price Movement | After the price rises briefly, it reverses direction and falls, leaving traders who bought in trapped. | Following the initial drop, the price quickly rebounds, trapping traders who shorted the asset. |
| Trap Impact on Traders | Traders who bought the asset during the supposed breakout face losses as the price drops. | Traders who shorted the asset are caught with losses as the price moves back up. |
| Resulting Trend | The price typically declines after the reversal, causing losses for those who entered long positions. | The price usually increases after the rebound, leading to losses for those who shorted the asset. |
| Example Scenario | A stock breaks above the $100 resistance, rises to $105, then quickly falls back below $100, trapping buyers who expected further gains. | A stock breaks below $100 support, drops to $95, then rebounds back above $100, catching short sellers off guard. |
In a bull trap, traders believe that an upward breakout above resistance is a genuine trend reversal, and they enter long positions. However, after the price rises briefly, it quickly falls, reversing the breakout. Traders who bought during the rally are then left with losses as the price moves lower again.
On the other hand, a bear trap occurs when the price breaks below a significant support level, misleading traders into thinking that a downtrend is starting. They short the asset, expecting the price to continue falling. However, after the initial decline, the price rebounds, catching short sellers off guard and causing them to cover their positions at a loss.
By distinguishing between a bull trap and a bear trap, traders can better understand the market’s behavior, avoid false signals, and reduce the risk of making costly mistakes. Recognizing these deceptive patterns allows traders to make more informed decisions and act strategically to protect their investments.
Learn what support and resistance are in trading.
In Summary
A bull trap can be a costly mistake if not identified and managed properly. However, by understanding how a bull trap works and following the right strategies, traders can turn these deceptive market moves into profitable opportunities. Key actions include carefully identifying the breakout, confirming the reversal with technical indicators, and implementing risk management measures such as stop-loss orders. With vigilance, patience, and a solid trading strategy, you can avoid falling victim to a bull trap and make smarter trading decisions.
Start Trading Today with VT Markets
Ready to take advantage of market opportunities? VT Markets offers a secure, intuitive platform designed to cater to traders of all experience levels. With competitive spreads, fast execution, and advanced trading tools like MetaTrader 4 (MT4) and MetaTrader 5 (MT5), you can confidently navigate the markets and avoid costly traps like the bull trap.
Open your account with VT Markets today and access the online resources, support, and technology you need to trade smarter and more effectively.
Frequently Asked Questions (FAQs)
1. What is a bull trap in trading?
A bull trap occurs when an asset’s price breaks above a key resistance level, giving the illusion of a bullish trend. However, the price quickly reverses and falls back below the resistance level, trapping traders who bought into the rally.
2. How can I spot a bull trap?
To spot a bull trap, look for a price surge above resistance levels followed by a sudden reversal. Key indicators such as RSI divergence, low volume on the breakout, and candlestick patterns like Doji or Engulfing can help confirm the presence of a trap.
3. How can I avoid falling for a bull trap?
To avoid a bull trap, wait for confirmation after the breakout. Look for increased volume and confirmation from technical indicators before entering a position. Using stop-loss orders below the breakout level can also help limit potential losses.
4. How do I trade a bull trap?
To trade a bull trap, enter a short position once you confirm the reversal. After the price breaks above resistance and starts to fall back, short the asset, expecting further declines. Use technical indicators and price action to ensure the reversal is genuine.
5. Can a bull trap occur in various markets?
Yes, bull traps can occur across all markets, including stocks, forex, and cryptocurrency. While the dynamics might differ, the underlying principle remains the same: misleading price movements that create false breakout signals.
6. How long do bull traps typically last?
The duration of a bull trap can vary, typically lasting from a few minutes to several days, depending on the volatility of the asset and overall market conditions. Quick reversals are common, but some traps can last longer before fully playing out.
7. Can I profit from a bull trap?
Yes, traders can profit from a bull trap by shorting the asset once the breakout is confirmed as false. By timing the reversal correctly and entering a short position, traders can capitalize on the price decline following the bull trap.
 | VT Markets")

 | VT Markets")

 | VT Markets")

 | VT Markets")