| VT Markets")

The final week of June brings a notable pause in economic data but heightened geopolitical and central bank-driven volatility. With US–Iran tensions, major defence summits, and central bank commentary on the docket, markets may see significant shifts—especially in oil, safe havens, and global equities.
KEY INDICATORS
Foreign exchange market
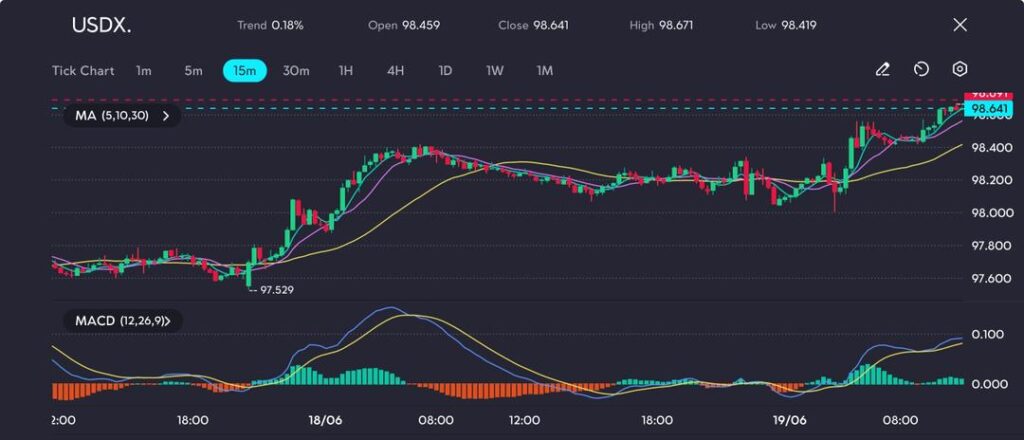
Dollar holds firm amid Middle East tensions.
Safe-haven demand supports the US dollar following strikes on Iranian nuclear sites, although broader market calm limits further USD gains.
Asia FX outlook dull as data slowdown hits.
Thin calendars in Asia see minimal currency movement outside headline-driven reactions to global events.
Commodities and equities
Oil reacts: Brent nears $80 amid conflict risk.
Brent has surged nearly 18% since 10 June, approaching $80, driven by concerns over supply disruptions in the Middle East.
OPEC+ predicts demand strength, mulls supply cuts.
OPEC forecasts a resilient second half of 2025 and anticipates fewer non-OPEC supplies—supporting prices despite tanking US inventories.
Equities on edge with risk sentiment faltering.
Tech earnings buoy markets despite uncertainty.
S&P 500 faces inflation test via PCE data.
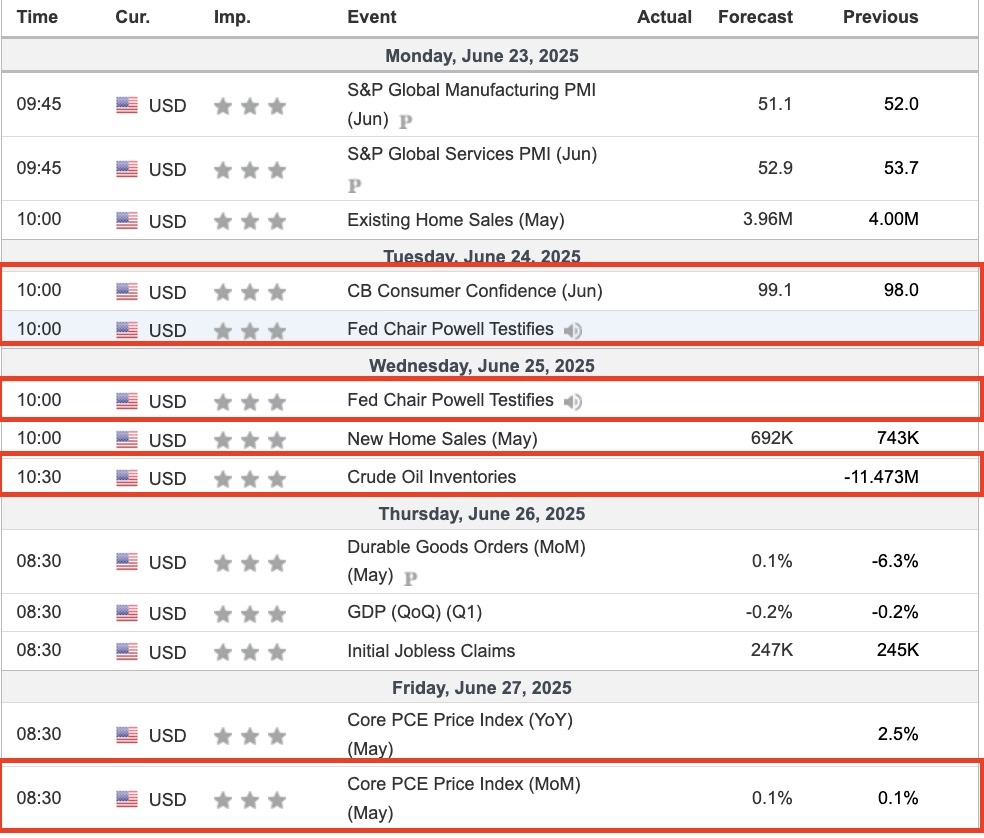
Investors await Friday’s PCE inflation readings for clues on the Fed’s timeline for possible rate cuts.
Asian markets and key events
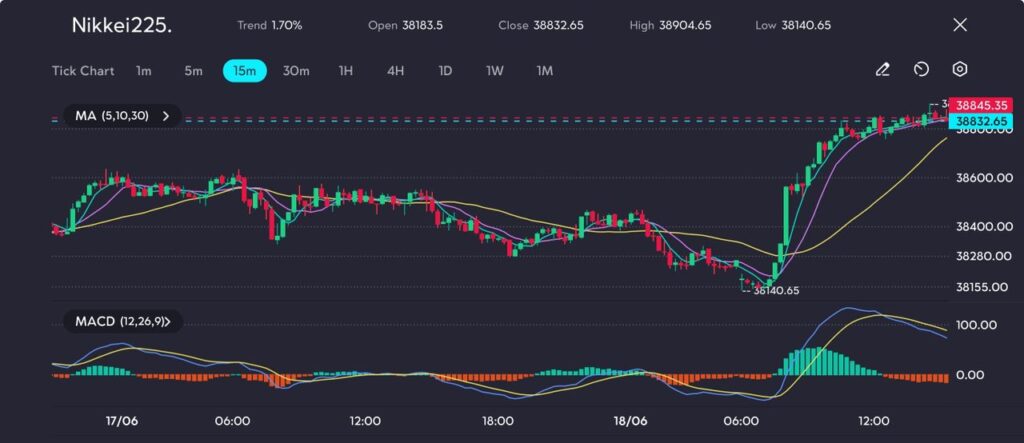
Minimal economic data, max sensitivity to headlines. With Singapore, Thailand, and Japan PMI releases expected Monday, major FX and equity moves will hinge on geopolitical news.
Japan and Thailand central banks expected to follow suit.
23 June (Mon): Singapore, Australia, Thailand PMIs; US flash Services PMI; KB Home earnings.
24 June (Tue): FedEx earnings; US Consumer Confidence.
25 June (Wed): Micron earnings; New Home Sales; Durable Goods Orders.
26 June (Thu): Nike, Walgreens, McCormick earnings; Q1 GDP final estimate.
27 June (Fri): May PCE inflation prints; U. Michigan Sentiment; Middle East talks commentary.
MARKET MOVERS
XAU/USD
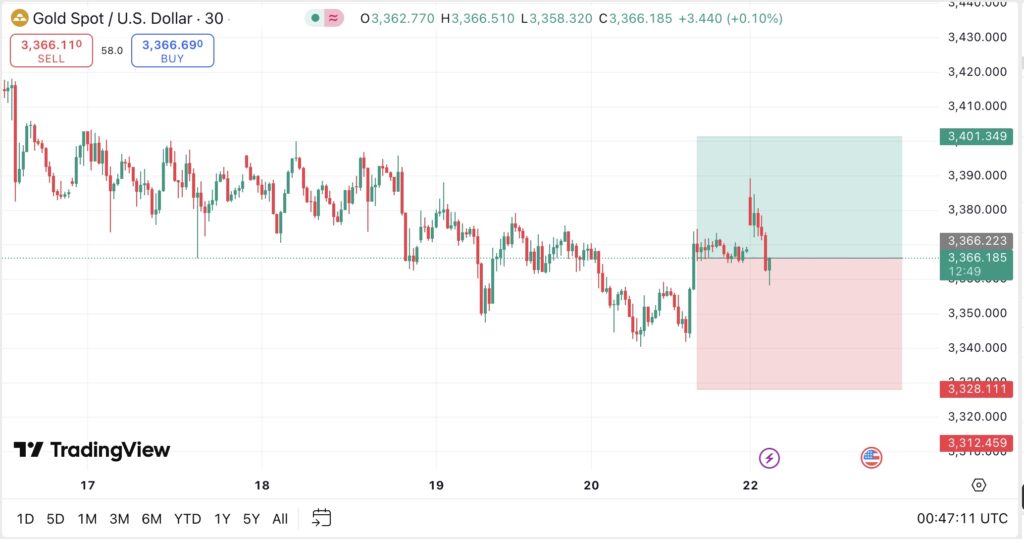
- Technical breakout: Gold recently broke above the $3,378–$3,382 resistance zone—a clear short-term breakout confirmed with volume—suggesting bullish momentum is building.
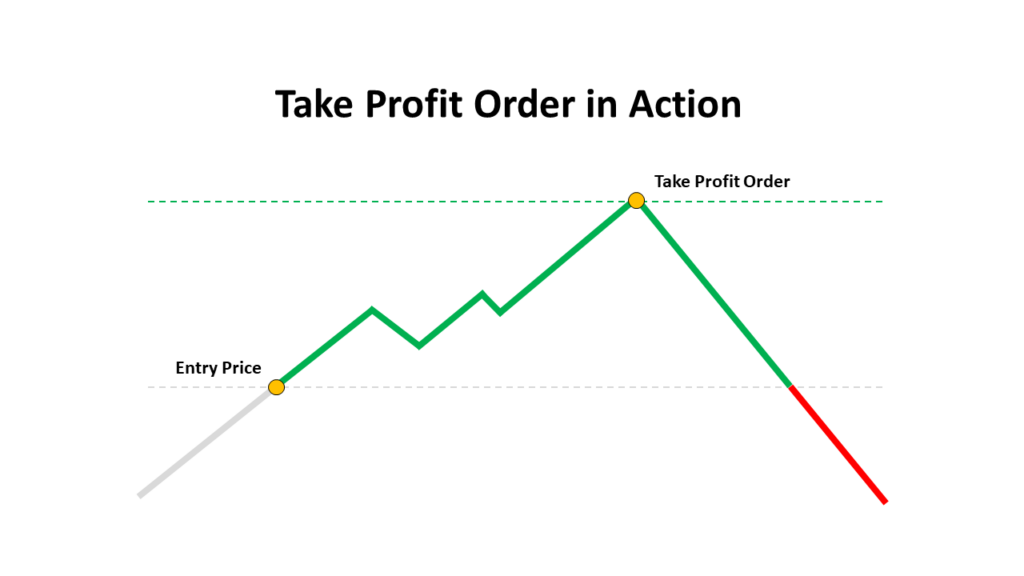
- Target projection (bullish): With the breakout in motion, upside targets are set at $3,395 (near-term) and $3,415–$3,420 in an extended rally.
- Target projection (bearish): If resistance around $3,395–$3,400 stalls upside, a pullback to $3,353–$3,360 is likely before any continuation.
- Opening expectation: Gold is expected to open the week near $3,380–$3,385, maintaining bullish momentum as geopolitical tensions support safe-haven demand.
- Primary support zone: $3,360–$3,368 (recent breakout retest and order-block level).
- Secondary support zone: $3,353–$3,355 (lower demand zone).
- Tertiary support zone: $3,330–$3,335 (bullish structure base).
- Strategy (bearish approach): Short if price rejects resistance in the $3,395–$3,400 zone and breaks below $3,360.
- Bearish targets: Pullback to $3,353, potentially deeper to $3,330.
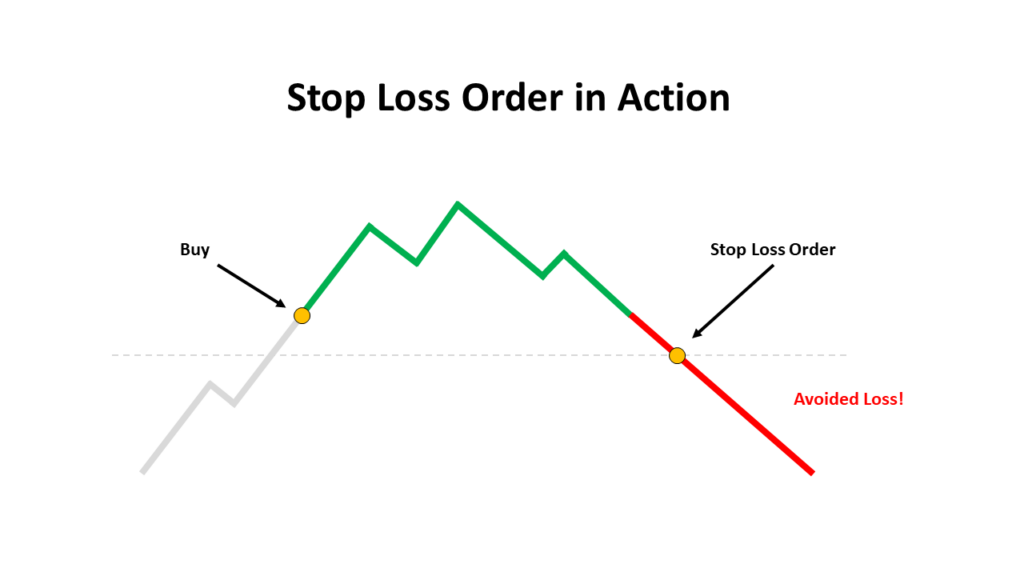
- Stop-loss level: Above $3,405–$3,410.
- Key catalysts this week: Geopolitical developments in the Middle East, US Fed commentary and monetary policy tone, and weekly US inflation data and employment figures.
USD/JPY
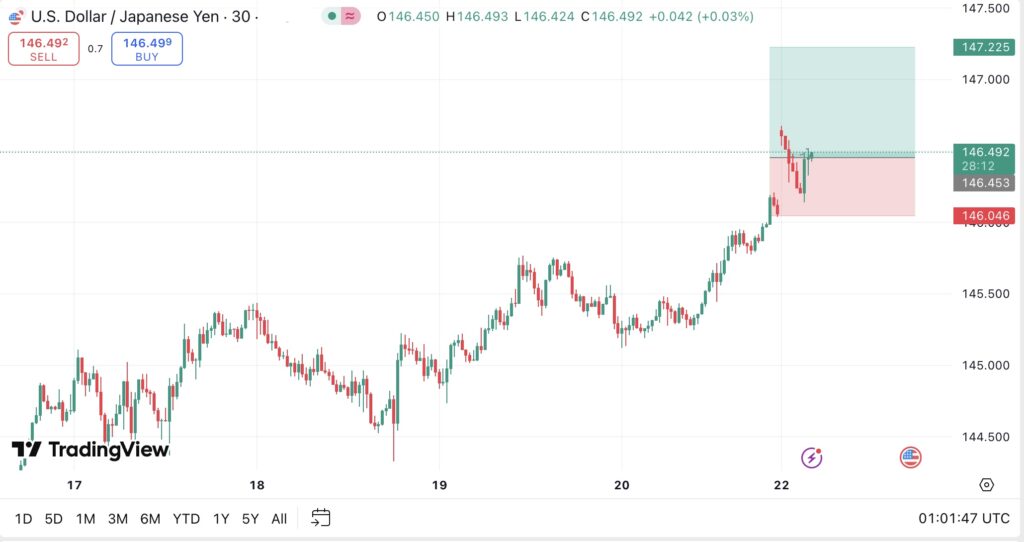
- Technical breakout: USD/JPY is consolidating within a triangle pattern between ~143.90 and 145.40, with buyers now testing the upper boundary around 145.35–145.40. A breakout above 145.35 would confirm bullish momentum towards the next resistance.
- Target projection (bullish): If price breaks above 145.35–145.40, the immediate target is 146.15 (61.8% retracement), followed by 148.05. A decisive move could extend towards 149.05.
- Target projection (bearish): A drop below 143.90 would likely trigger a correction to 142.20, with a potential slide towards 141.45 if momentum accelerates.
- Opening expectation: Expect a cautiously bullish opening around 145.20–145.30, supported by recent Fed dovishness and risk-on flows—though tight consolidations near triangle resistance should be anticipated.
- Primary support zone: 145.00–145.10 (lower triangle boundary and intraday demand).
- Secondary support zone: 143.90–144.00 (triangle base and weekly lows).
- Tertiary support zone: 142.20–142.40 (deeper correction zone).
- Strategy (bullish approach): Long on breakout above 145.40, or on pullbacks to 145.00–145.10 with bullish confirmation.
- Bullish targets: Start at 146.15, then 148.05, with an extended target near 149.05.
- Stop-loss level: Below 144.80 (clears consolidation zone).
Crude Oil WTI
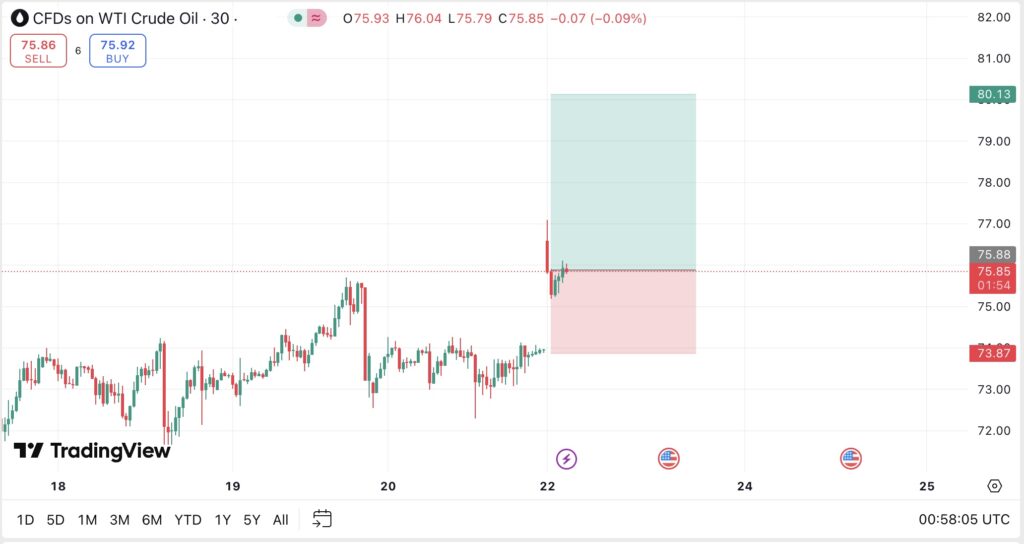
- Technical breakout: WTI has decisively broken out above the $76.67 supply zone and the $75.30 weekly high, confirmed by strong volume and supported by a bounce off the 200-day SMA.
- Target projection (bullish): Near-term target is $80 (psychological level and recent peak), with an extended target at $85–$90 if tensions escalate or a supply threat emerges.
- Target projection (bearish): A failure to close above $80 could lead to a retracement towards $75 and then $71.28, the lower base.
- Opening expectation: Oil is likely to open the week in the $77–$78 range, reflecting risk-off sentiment due to escalating geopolitical tensions around the Strait of Hormuz.
- Primary support zone: $75.30–$75.50 (recent breakout level and 200-day SMA).
- Secondary support zone: $71.28 (prior wedge base).
- Tertiary support zone: $67–$68 (historical long-term base).
- Strategy (bullish approach): Long near $77 on pullbacks into the $76.50–$77 range.
- Bullish targets: First at $80, then extended to $85+.
- Stop-loss level: Below $75.30 to preserve capital.
NEWS HEADLINES
Geopolitical tensions rise
The US and Israel launched airstrikes on Iranian nuclear facilities, escalating regional conflict.
Iran has vowed retaliation and may close the Strait of Hormuz, threatening global trade and oil supply routes.
The UN Security Council held an emergency meeting, with Russia, China, and Pakistan demanding a ceasefire.
The NATO Summit (24–25 June, The Hague) will focus on global defence coordination amid rising tensions.
Markets react to conflict
Brent crude surged to nearly $80 as fears of disrupted oil supply gripped the market.
WTI crude climbed above $75.70, reaching a five-month high on increased geopolitical risk.
Asian stock markets, including Tokyo, Hong Kong, and Sydney, declined as investors moved to safe-haven assets.
US equity futures fell as rising oil prices and global uncertainty weighed on investor sentiment.
Currency and Asia market moves
The US dollar strengthened against the yen and Swiss franc as risk-off sentiment drove safe-haven demand.
Asian currencies such as the Indian rupee and Thai baht weakened due to rising oil prices and investor caution.
Japan’s flash manufacturing PMI returned to growth after 11 months, providing a positive signal for the local economy.
Australia’s ASX fell by around 0.5% as markets priced in higher energy risks and AUD faced pressure.
Click here to open account and start trading.

 | VT Markets")


 | VT Markets")


 | VT Markets")