What Is Trend Trading? A Step-by-Step Guide to Trading With the Trend
In this article, you’ll learn what trend trading is, how it works, and how to trade with the trend practically and structured. From identifying market direction to executing trades with discipline, we’ll guide you through each essential step. Whether you’re looking to follow short-term momentum or long-term price movement, this comprehensive guide will help you build a strong foundation in trend trading.
What Is Trend Trading?
Trend trading is a popular trading strategy where traders aim to profit by analyzing and following the prevailing market direction. Essentially, trend traders seek to identify upward or downward price movements and then align their trades accordingly to capture gains as long as the momentum continues.
While day trading focuses on short-term movements within a single day, trend trading usually spans days, weeks, or even months, providing clarity and consistency in trading decisions.
How Does Trend Trading Work?
Trend trading revolves around one simple principle: “The trend is your friend.” By identifying sustained market movements, traders enter positions in alignment with the direction of the trend and remain invested until signals indicate the trend has reversed.
For instance, if a stock price consistently moves upward, trend traders will typically buy and hold, aiming to maximize profits until indicators suggest a reversal. Conversely, if prices consistently decline, traders may short-sell the asset or apply bearish strategies to benefit from the downward trend.
Example: Imagine a trader who identified the bullish trend in Tesla shares (TSLA) throughout 2024. The stock price surged from approximately $250 in January 2024 to around $430 in December, providing trend traders ample opportunity to ride significant gains over the year.
How to Identify a Trend in Trading?
Recognizing a clear market trend is essential for successful trend trading. Here are three effective ways traders use to spot trends in real time:
1. Price Action Analysis
Price action forms the foundation of trend identification. Traders study how the market moves without relying on indicators, focusing on key structural patterns:
- Uptrend: A sequence of higher highs and higher lows.
- Downtrend: A series of lower highs and lower lows.
- Sideways trend: Price moves between horizontal support and resistance.
Example: If the S&P 500 consistently pushes to new highs with shallow pullbacks, this pattern suggests a strong bullish trend.
2. Trendlines
Trendlines are drawn on the chart to connect swing highs or lows and visually map the trend direction:
- In an uptrend, draw a line along rising swing lows.
- In a downtrend, connect falling swing highs.
- These lines help identify support or resistance and offer guidance on possible breakouts or breakdowns.
Tip: The more times a trendline is tested without breaking, the stronger it is considered by traders.
3. Volume Analysis
Volume provides insight into the strength behind a price move:
- Increasing volume during a trend continuation confirms strong market interest.
- Falling volume during a breakout may suggest a weaker or unsustainable move.
- Sudden volume spikes at key price levels can signal potential trend reversals.
Discover the top 10 trading chart patterns that every trader should learn.
How to Trade With the Trend?
Trend trading works best when approached with structure and discipline. Follow these steps to build a strong foundation:
1. Understand How Trend Trading Works
Before diving in, learn what trend trading is, how it differs from other strategies, and why following market direction can lead to consistent results. Understanding trend continuation, reversal signals, and momentum shifts is essential for making informed decisions.
2. Choose a Reliable Broker
Select a regulated broker that offers low spreads, fast execution, and access to real-time data and charting tools. A strong platform like VT Markets provides the analytical capabilities that trend traders need, including integrated indicators, drawing tools, and trade management features.
3. Identify the Trend
Use price action, trendlines, or indicators like moving averages to determine whether the market is trending up, down, or sideways. Look for confirmation based on swing highs/lows or other supporting signals across multiple timeframes.
4. Wait for Entry Signals
Patience is crucial. Avoid jumping in too early. Instead, wait for pullbacks, consolidations, or breakout confirmations that align with the overall trend direction. These are typically more reliable entry points.
5. Enter the Trade
Once a valid setup forms, open your position in the direction of the trend. Ensure that your entry, stop-loss, and take-profit levels are defined clearly before executing the trade to limit emotional decision-making.
6. Implement Risk Management Strategies
Risk management is critical in trend trading. Use appropriate position sizing, stop-losses, and risk-reward ratios to protect your capital. For example, risking 1–2% per trade helps ensure long-term sustainability even if some trades go against you.
7. Stay Informed and Updated
Trends don’t last forever. Monitor price behavior, market sentiment, and news events that could impact your trade. Be ready to adjust or exit if the trend shows signs of weakening or reversing.
Common Indicators Used in Trend Trading
Technical indicators play a vital role in helping traders confirm trends, time their entries and exits, and manage risk more effectively. Below are some of the most commonly used indicators in trend trading, each serving a unique purpose:
1. Moving Averages (MA)
Moving averages smooth out price data by calculating the average closing price over a specific time. This helps traders filter out short-term fluctuations and focus on the broader trend direction.
- Simple Moving Average (SMA): SMA is the most straightforward type, calculating the average price over a set number of periods.
- Exponential Moving Average (EMA): EMA gives more weight to recent price data, making it more responsive to recent price movements.
A popular trend signal is the moving average crossover, such as when the 50-day EMA crosses above the 200-day EMA, often referred to as a golden cross (bullish), while the opposite is known as a death cross (bearish).
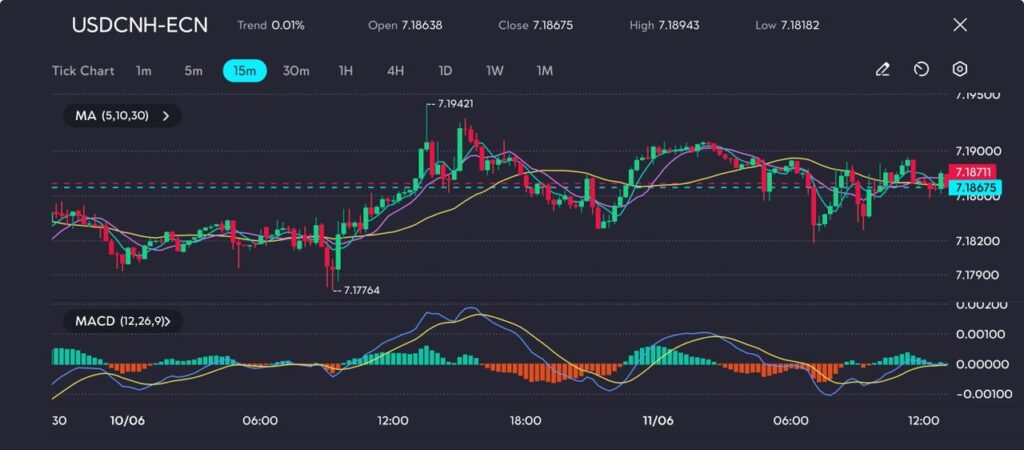
2. Moving Average Convergence Divergence (MACD)
MACD helps traders understand both the momentum and direction of a trend. It is derived by subtracting a longer-term EMA from a shorter-term EMA, typically the 26-day and 12-day. When the MACD line crosses above the signal line, it may indicate the start of a bullish trend; when it crosses below, it may suggest a bearish reversal.
The MACD histogram also reflects trend strength—larger bars typically signal stronger momentum.
3. Relative Strength Index (RSI)
RSI is a momentum oscillator that measures the speed and change of price movements, ranging from 0 to 100. It is typically used to identify overbought or oversold conditions:
- RSI above 70 often indicates the asset is overbought (potential reversal or correction).
- RSI below 30 suggests the asset may be oversold (possible bounce or trend start).
In trend trading, RSI can also be used to confirm the strength of a trend — for example, if RSI stays above 50 during an uptrend, it supports bullish strength.
4. Bollinger Bands
Bollinger Bands consist of a simple moving average with upper and lower bands placed two standard deviations away from the average. These bands expand and contract based on market volatility.
- When the bands tighten, it signals low volatility and potential breakout conditions.
- When price touches the upper band in an uptrend or the lower band in a downtrend, it can confirm trend continuation.
Bollinger Bands are particularly useful in spotting trend consolidation and breakout points.
In Summary
Trend trading is a widely used strategy that focuses on identifying and following market direction. It offers traders a structured approach to decision-making, emphasizing patience, discipline, and clarity. By understanding market behavior and applying consistent techniques, traders can navigate trends with greater confidence and control. Whether you’re just starting or looking to improve your approach, trend trading provides a solid foundation for long-term success.
Start Trend Trading Today With VT Markets
VT Markets provides traders with an advanced, user-friendly platform—MetaTrader 4 and MetaTrader 5—equipped with powerful analytical tools to simplify trend trading. With seamless execution, in-depth market analysis features, and a comprehensive Help Centre to support self-guided learning, VT Markets empowers traders to confidently trade with the trend.
Open an account with VT Markets today and start trading with the trend.
Frequently Asked Questions (FAQs)
1. What is trend trading?
Trend trading is a strategy that involves identifying the direction of market movement—upward, downward, or sideways—and placing trades that align with that direction to capture potential profits over time.
2. How to trade with the trend?
Follow these steps to trade with the trend effectively:
- Understand trend trading: Learn how trends form and why following them can improve consistency.
- Choose a reliable broker: Use platforms like MetaTrader 4 or 5 for real-time data and strong analysis tools.
- Identify the trend: Analyze price action and trendlines to determine market direction.
- Wait for entry signals: Look for pullbacks, consolidations, or breakouts that align with the trend.
- Enter the trade: Set clear entry, stop-loss, and take-profit levels before executing.
- Apply risk management: Use proper position sizing and risk-reward ratios to protect your capital.
- Stay updated: Monitor market news and price movements to manage or exit your trade as needed.
3. Does trend trading work?
Yes, trend trading can be effective when applied with discipline, patience, and the right tools. Many professional traders use trend-following strategies to capture larger price movements and reduce noise from short-term volatility.
4. How to find a trend in trading?
Trends can be identified by analyzing price patterns, using trendlines, or observing market structure, such as higher highs and higher lows. Indicators like moving averages can also help confirm the trend direction.
5. Is trend trading profitable?
Trend trading can be profitable, particularly in markets with strong and sustained movements. However, like any trading strategy, it carries risk. Misreading trends or entering too late can lead to losses. Profitability depends on accurate trend identification, disciplined execution, and consistent risk management.
6. What is the most common mistake in trend trading?
The most common mistake is ignoring signals indicating trend reversals or holding onto losing positions too long in anticipation that the original trend will resume.
7. How long does a market trend usually last?
Market trends can vary greatly, lasting from days to months or even years. It depends largely on broader economic factors, market sentiment, and specific asset characteristics.
8. Can beginners succeed at trend trading?
Yes, beginners can succeed at trend trading by starting with a clear strategy, practicing on a demo account, applying disciplined risk management, and continuously learning about market behavior and trends.
9. How to identify a trend in day trading?
In day trading, trends are identified on shorter timeframes like 5-minute or 15-minute charts. Look for consistent price movement in one direction, supported by volume, price structure, and tools like intraday trendlines or VWAP.


 | VT Markets")


 | VT Markets")