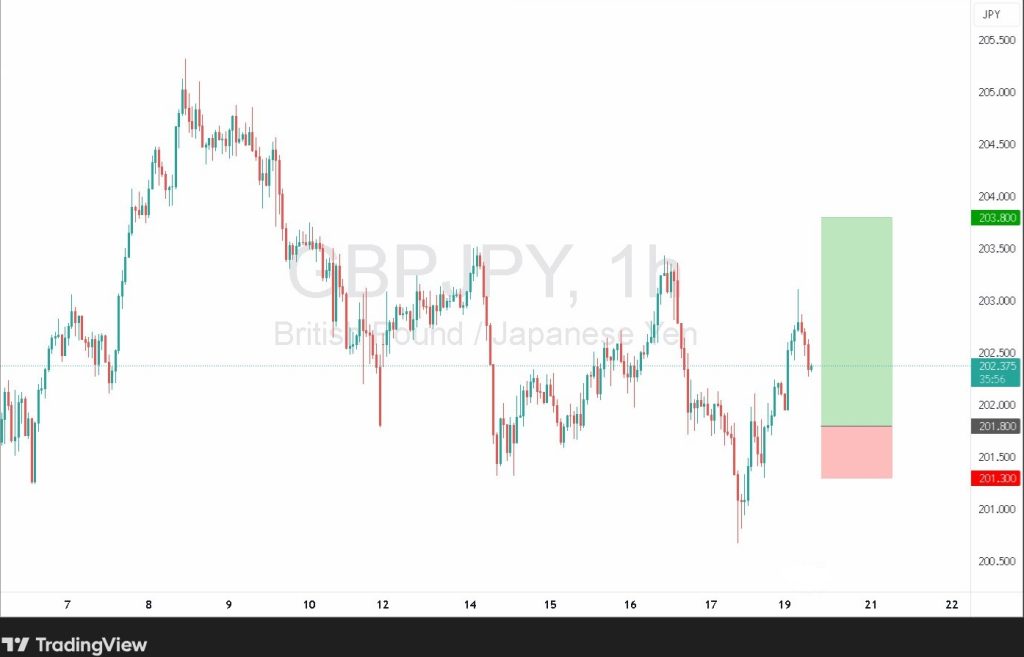
GBP/JPY opened steady near 202.00, with price action showing minor softness that invited dip-buying interest. The short-term RSI eased lower, hinting at a potential rebound from 201.80. Technically, the pair remains bullish, with targets at 203.80 and 204.30 if support holds.
But beneath the surface, fundamentals are stirring.
Sluggish growth and rate cut speculation in the UK
The UK economic data painted a mixed picture. GDP growth for August was confirmed at just 0.1%, following stagnation in July. This modest expansion has raised concerns about the sustainability of the recovery, especially as inflation remains elevated. Analysts now expect the Bank of England to cut rates before year-end, potentially bringing the base rate to 3.75%. These expectations have capped upside for the sterling, even as GBP/JPY trades above its three-month average of 199.5.
Political uncertainty and risk-on sentiment in Japan
Meanwhile, the political landscape of Japan added volatility to the yen. Ongoing uncertainty surrounding leadership transitions and fiscal policy direction has weighed on JPY sentiment. Risk-on flows returned mid-October, lifting GBP/JPY above 202.00 as traders favored higher-yielding assets. The weakness in the yen was further compounded by the modest growth outlook of the country, with GDP expected to expand just 0.6% in 2025.
GBP/JPY technical analysis
GBP/JPY is consolidating within a bullish structure. A rebound from 201.80 could target 203.80 and 204.30. A close above 204.30 confirms bullish continuation. However, a break below 201.80 exposes 201.30 and 200.80, weakening the near-term setup.
Support: 201.80 → 201.30 → 200.80
Resistance: 203.80 → 204.30
Bullish setup: Buy dips toward 201.80 with stops below 201.30. Target 203.80 and 204.30.
Bearish setup: Short only on rejection near 204.30. Target between 202.50 and 201.80.
Range play: Accumulate near support, scale out near resistance. Stay flexible within the 201.80 to 204.30 range.
Fundamentals add depth to the technical story
As UK growth slows and Japan navigates political uncertainty, GBP/JPY finds itself at a crossroads. The technical structure remains bullish, but macro developments could add volatility and nuance to the trend. Traders should stay nimble, monitor central bank commentary, and watch for rejection candles near resistance as the next chapter unfolds.
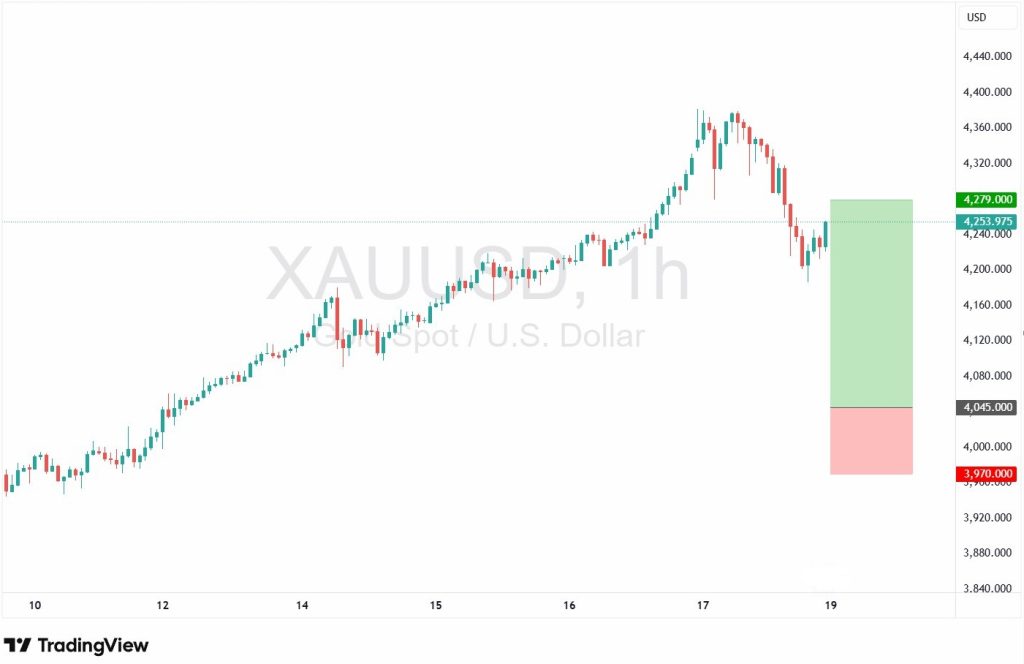
Gold (XAU/USD) continues to trade within a broadly bullish structure, despite recent selling pressure from the $4,379 level that erased early gains. Price action remains well-supported on dips, with buyers defending key zones near $4,045. As global markets digest a wave of economic and geopolitical developments, the role of gold as a safe-haven asset remains front and center.
Trade tensions and policy shifts
After the U.S. reignited trade tensions by announcing a 100% tariff on all Chinese imports, Europe is also faced rising fiscal uncertainty and political fragmentation, with upcoming elections and leadership changes adding to policy unpredictability.
The IMF World Economic Outlook for October 2025 highlighted subdued global growth, noting that temporary factors supporting activity earlier this year, such as front-loading and inventory restocking, are fading. Despite this, global trade remains resilient, expanding by $500 billion in the first half of 2025, led by manufacturing and electronics.
Looking ahead, upcoming key events include the U.S. Core PCE inflation report, the Fourth Plenum of China to finalise its five-year economic plan, and high-level U.S.–Russia talks on Ukraine. These developments could significantly influence risk sentiment and central bank positioning.
Technical analysis: Gold holds strong at support
Gold is currently consolidating after a pullback from $4,379, with support holding near $4,045. Momentum remains constructive, and a move above $4,112 could reignite bullish momentum toward $4,279 and $4,333. A close above $4,333 would confirm a bullish extension. On the downside, a break below $4,045 opens risk toward $4,000, with deeper weakness below $4,025 undermining the bullish setup.
Support: $4,045 → $4,000 → $4,025
Resistance: $4,112 → $4,279 → $4,333
Bullish setup: Buy dips toward $4,045 with stops below $4,025. Target $4,279 and $4,333.
Bearish setup: Short only on rejection near $4,279–$4,333. Target $4,112 or $4,045.
Range play: Accumulate near $4,045 and reduce exposure near $4,279. Trade within the $4,045–$4,333 range until breakout confirms direction.
Gold as a barometer for global risk
With central banks navigating diverging policy paths and geopolitical tensions rising, gold remains a key barometer for investor sentiment. Traders should stay nimble and monitor macro headlines closely, as the next development could redefine rate expectations and risk appetite across global markets.
Energy trading allows investors and traders to profit from price movements in commodities like oil, natural gas, and renewable energy. In this guide, you’ll learn how energy trading works, the factors that influence energy prices, and the main markets and instruments available, including commodities, ETFs, and energy stocks, to help you make informed trading decisions.
What Is Energy Trading?
Energy trading is the process of buying and selling energy commodities such as oil, natural gas, electricity, and renewable energy sources. It involves speculating on the price movements of these commodities or trading them as part of a broader investment strategy. Energy trading is vital to both the global economy and individual traders, as it influences the prices and availability of energy products that power industries, homes, and transportation.
Simply put, what is energy trading? It’s a way for traders and companies to profit from energy market fluctuations, or for businesses to hedge against price volatility. The energy market is diverse, with traders dealing in everything from crude oil to natural gas and even renewable energy sources like solar and wind power.
How Does Energy Trading Work?
Energy trading involves buying and selling energy commodities such as crude oil, natural gas, gasoline, and electricity. These markets are highly liquid and operate almost around the clock, five days a week.
Traders analyze market trends, economic data, and global events using both technical and fundamental analysis to understand what drives supply and demand. Some traders focus on short-term volatility, while others aim to capture long-term market trends. Because energy markets can be unpredictable, strong risk management is essential for success.
Renewable energy sources such as wind and solar are not traded directly on commodity exchanges, but traders can gain exposure by investing in companies and ETFs that focus on clean energy development.
1. Energy Commodities
Energy commodities such as oil, natural gas, coal, and electricity can be traded through spot markets, futures, or options. Traders can access these markets through spread betting or CFD trading accounts.
With CFDs, you speculate on the price movement of energy commodities without owning the underlying asset. Because CFDs use leverage, both profits and losses are calculated on the full position value rather than just the margin deposit. This makes CFD trading a powerful but high-risk tool that requires disciplined risk management.
Energy ETFs offer exposure to a wide range of energy assets, from commodities to shares of major energy companies. These funds track an index, commodity, or group of stocks, helping traders and investors diversify within the energy sector.
Well-known examples include the SPDR S&P Oil & Gas Exploration & Production ETF, which invests in U.S. energy companies, and the Global X Clean Energy ETF, which focuses on renewable energy leaders. These ETFs provide a simple and low-cost way to invest in the energy market without directly buying commodities.
Investors can hold energy ETFs for long-term growth through a share dealing account, or trade them using CFDs or spread betting for short-term opportunities.
3. Energy Stocks
Investing in energy stocks means buying shares of companies involved in the exploration, production, or distribution of energy resources. Major oil and gas producers such as ExxonMobil, Chevron, and Shell remain core players in global energy markets.
Meanwhile, the renewable energy sector continues to grow rapidly. Companies like First Solar, Enphase Energy, and NextEra Energy lead in clean power generation, while Tesla and Albemarle play vital roles in energy storage and electric vehicle innovation. Together, these renewable energy stocks provide diverse opportunities for investors looking to gain exposure to both traditional and clean energy markets.
How to Invest or Trade in Energy?
To trade energy effectively, it’s important to understand the markets and develop a clear strategy. Follow these steps to get started:
Step 1: Understand the Energy Markets
Learn how energy markets work and research different commodities such as oil, natural gas, electricity, and renewable energy. Identify the key factors influencing prices, including geopolitical events, weather patterns, and global supply and demand.
Step 2: Choose a Reliable Broker
Select a trusted broker like VT Markets, which offers access to major energy markets, competitive spreads, real-time data, and advanced trading tools.
Step 3: Deposit and Fund Your Account
Add funds to your trading account using a secure method such as bank transfer, credit card, or e-wallet. Check any minimum deposit requirements and transaction fees before you begin.
Step 4: Choose Your Energy Market
Decide whether to trade energy commodities, ETFs, or stocks. Each market type carries its own risks and potential rewards, so choose the one that aligns with your goals and risk tolerance.
Step 5: Decide to Go Long or Short
When you’ve selected your energy market, determine whether you want to go long (buy) or short (sell). Going long means you expect prices to rise, while going short means you expect them to fall.
Step 6: Make Your First Trade
Execute your trade using instruments such as CFDs, futures, or ETFs. Get familiar with your trading platform and the different order types before entering a position.
Keep track of global market news, energy reports, and policy changes that could affect prices. Stay proactive with your analysis to adjust your strategy as the market evolves.
Energy trading provides multiple advantages, making it a popular choice among traders. Here are the key reasons to trade energy:
1. Profit from Price Fluctuations
Energy markets are volatile, creating frequent opportunities to profit from price movements. Prices for commodities like crude oil, natural gas, and electricity often shift due to supply disruptions, geopolitical events, or seasonal demand. Traders can benefit from both rising and falling markets, making energy trading especially appealing for short-term trading.
2. Diversification
Energy commodities offer portfolio diversification beyond traditional assets like stocks and bonds. Since energy prices often move independently, they help balance risk and act as a hedge against market downturns.
3. Global Market Access
Energy trading provides access to international markets influenced by global supply and demand, OPEC policies, and geopolitical developments. This global exposure allows traders to take advantage of price movements driven by major world events.
4. Hedge Against Inflation
Energy commodities often rise in value during inflationary periods, making them an effective tool for hedging against inflation. Trading or investing in assets like oil and natural gas can help protect your portfolio from currency depreciation while still offering profit potential during times of rising prices.
Key Factors Affecting Energy Prices?
Energy prices are influenced by several key factors that impact supply, demand, and market sentiment:
1. Supply and Demand
The balance between supply and demand is the most important driver of energy prices. When demand outpaces supply, prices rise, and when supply exceeds demand, prices fall.
Example: During the winter of 2018, a cold snap in North America caused natural gas demand to surge for heating, leading to a sharp increase in prices.
2. Geopolitical Events
Political instability or conflict in key producing regions can disrupt supply and cause prices to spike. Sanctions, trade restrictions, or tensions between major exporters often create uncertainty.
Example: In 2008, oil prices soared as conflicts and instability in the Middle East raised fears of supply shortages.
3. Weather and Seasonal Changes
Extreme weather conditions can quickly shift energy consumption patterns. Cold winters increase heating demand, while hot summers drive higher electricity use for cooling.
Example: A particularly cold U.S. winter in 2014 led to a jump in natural gas prices as heating demand spiked.
4. Technological Advancements
Advances in extraction and renewable technologies can shift global supply and reduce production costs, influencing overall energy prices.
Example: The rise of fracking in the U.S. boosted oil and gas output, driving prices lower worldwide.
5. Government Policies and Regulations
Regulations, subsidies, and environmental policies can significantly impact energy markets. Stricter emissions standards can increase production costs for fossil fuels, while renewable incentives can stabilize prices.
Example: The Paris Climate Agreement encouraged investment in renewable energy, shifting capital away from traditional fossil fuel projects.
In Summary
Energy trading allows traders to profit from global market movements and benefit from the liquidity of markets such as oil and natural gas. Success depends on understanding key drivers like supply and demand, geopolitical events, and seasonal trends. Effective analysis, strong risk management, and a clear strategy are essential to navigating volatility and achieving long-term success.
Trade Energy Today with VT Markets
Ready to start trading energy? VT Markets offers a secure and user-friendly platform for both beginners and experienced traders. Enjoy competitive spreads, fast execution, and access to powerful trading platforms like MetaTrader 4 (MT4) and MetaTrader 5 (MT5).
Energy trading involves buying and selling commodities like oil, natural gas, and electricity, as well as energy ETFs and stocks. Traders profit from price changes driven by supply, demand, and global events.
2. How does energy trading work?
Traders buy or sell energy commodities, ETFs, or stocks based on market analysis. Prices move with supply and demand shifts, geopolitical issues, and seasonal trends, creating opportunities to trade.
3. What affects energy prices?
Energy prices depend on global supply and demand, geopolitical tensions, weather, technology, and government policies. Understanding these factors helps traders anticipate price movements.
4. Is energy trading risky?
Yes. Energy markets are volatile, and prices react to political and natural events. Using strong risk management and hedging strategies can help limit potential losses.
5. Is energy trading profitable?
Energy trading can be profitable, but it depends on a trader’s ability to predict price movements accurately. Successful traders use a combination of technical analysis, fundamental analysis, and market research to identify profitable opportunities. As with all types of trading, profits are never guaranteed, and managing risk is essential.
Learn how to trade indices effectively with this complete guide. We’ll cover everything from understanding how indices work to choosing the right index and executing trades confidently. Whether you’re a beginner or looking to refine your strategy, this guide will help you trade popular indices like the FTSE 100, S&P 500, and NASDAQ with confidence.
What Is Indices Trading?
Indices trading involves speculating on the price movements of financial indices that track groups of stocks, bonds, or other assets. Instead of trading individual companies, traders buy or sell an entire index to gain exposure to a broader segment of the market.
For example, the S&P 500 measures the performance of the 500 largest U.S. companies, while the NASDAQ 100 tracks leading technology-focused firms. These indices help traders analyze overall market performance and identify opportunities without selecting individual stocks.
Key types of Indices:
Stock Indices: Represent a group of stocks from the same market or country, offering a broad view of economic performance. Examples include the S&P 500 and Dow Jones Industrial Average.
Sector Indices: Track companies within a specific sector, such as technology, energy, or healthcare. Examples include the NASDAQ 100 for tech and XLE for energy.
Regional Indices: Measure performance across particular regions or countries, such as the Nikkei 225 for Japan or the MSCI Emerging Markets Index for developing economies.
Volatility Indices: Track market uncertainty and price fluctuations. The most popular example is the VIX, often referred to as the “fear index.”
Trading indices gives you exposure to broader market trends without the need to pick individual stocks. They offer diversification, flexibility, and access to multiple sectors or regions in one trade. Here are the main reasons traders choose indices:
1. Diversification
Trading an index gives you exposure to many companies at once, helping reduce risk from individual stock movements. A poor-performing company has less impact when balanced by others in the same index.
2. Simplicity
Indices provide a straightforward way to participate in the market. Instead of researching dozens of individual stocks, you can trade the overall performance of an entire market or sector.
3. Access to Global Markets
By trading indices, you can easily access markets in the U.S., Europe, and Asia with just one position, gaining a global view of market trends.
4. Lower Volatility
Indices are generally less volatile than individual stocks because they represent a group of companies. Gains in stronger companies can offset losses in weaker ones, resulting in smoother performance.
5. Long and Short Opportunities
Indices can be traded in both rising (going long) and falling (going short). Go long if you expect the market to rise, or go short if you anticipate a decline. This flexibility lets traders profit in any market condition.
Trading indices means speculating on the overall movement of a group of stocks. Follow these steps to start trading effectively:
Step 1: Understand How Indices Trading Works
Learn how indices reflect the performance of multiple companies. When you trade an index, you’re speculating on the market’s direction rather than focusing on individual stocks.
Step 2: Choose a Reliable Broker
Select a regulated broker like VT Markets, which provides access to major indices, competitive spreads, and advanced trading platforms.
Step 3: Select Your Indices
Choose which index to trade based on your goals and market analysis. Popular options include the S&P 500, NASDAQ 100, and FTSE 100. Consider factors such as volatility, liquidity, and regional focus.
Place your trade using instruments like CFDs, ETFs, or futures. These allow you to speculate on price movements without owning the underlying assets.
Step 6: Implement Risk Management Strategies
Always use risk management techniques such as setting stop-loss and take-profit orders to protect your capital. Managing leverage is also important to avoid substantial losses, especially in volatile market conditions.
Step 7: Stay Informed and Updated
Monitor financial news, economic reports, and corporate results to stay ahead of market trends and adjust your strategies when needed.
Popular Indices Trading Strategies
To succeed in indices trading, it helps to follow a structured approach. Below are some of the most popular trading strategies used by traders to identify opportunities and manage risk:
1. Trend Following
The trend-following strategy focuses on trading in the same direction as the market. Traders use indicators like moving averages or MACD to confirm an uptrend or a downtrend. For example, if the S&P 500 shows a steady upward trend, traders may look for buy setups.
2. Range Trading
When an index moves sideways between support and resistance levels, traders buy near support and sell near resistance. Tools like RSI or Stochastic Oscillator help identify when prices are overbought or oversold.
3. News-Based Trading
Economic data releases and earnings reports can trigger strong short-term movements. Traders watch for news such as GDP, inflation, or employment data to capture volatility. A strong jobs report, for instance, may lift the S&P 500, while weak results could push it lower.
4. Breakout Strategy
Breakout traders look for price movements beyond key support or resistance levels. Indicators like Bollinger Bands and trading volume can confirm a breakout and signal the start of a new trend.
5. Swing Trading
Swing traders aim to profit from short- to medium-term market “swings.” They use technical analysis to spot reversals and typically hold positions for several days or weeks to capture price momentum.
In Summary
Indices trading provides a straightforward way to access entire markets or sectors through a single trade. It helps traders diversify their portfolios, manage risk more effectively, and benefit from broader market trends without focusing on individual stocks. With a solid strategy and disciplined risk management, both beginners and experienced traders can succeed in trading indices confidently.
Indices trading involves speculating on the price movements of stock market indices such as the S&P 500, FTSE 100, or NASDAQ 100. Traders can access these markets through instruments like CFDs, futures, or ETFs.
2. How do I trade stock indices?
Trading indices involves predicting the overall movement of a group of stocks rather than individual ones. To start trading:
Step 1: Understand how indices trading works.
Step 2: Choose a reliable broker.
Step 3: Select your preferred index.
Step 4: Analyze market trends.
Step 5: Execute your trade.
Step 6: Apply risk management strategies.
Step 7: Stay informed about economic and market news.
3. Can I trade indices with leverage?
Yes. Most brokers, including VT Markets, allow you to trade indices with leverage. Leverage can amplify profits but also increase potential losses, so it should be used carefully.
4. What are the most popular tradable indices?
The most actively traded indices include the S&P 500, NASDAQ 100, FTSE 100, and DAX 30. Each represents the performance of key companies or sectors within its region.
5. Is indices trading profitable?
Indices trading can be profitable, but like any form of trading, it comes with risks. Successful traders use a combination of market analysis, sound strategies, and effective risk management to increase their chances of profitability.
Please note that the dividends of the following products will be adjusted accordingly. Index dividends will be executed separately through a balance statement directly to your trading account, and the comment will be in the following format “Div & Product Name & Net Volume”.
Please refer to the table below for more details:
The above data is for reference only, please refer to the MT4/MT5 software for specific data.
If you’d like more information, please don’t hesitate to contact info@vtmarkets.com.
In financial markets, an index (plural: indices) measures the performance of a specific group of assets, such as stocks, bonds, or commodities, within a market. Indices are essential tools for traders and investors to track market trends, compare performance, and gauge overall economic health.
For example, the S&P 500 Index tracks the performance of 500 of the largest companies in the U.S., and its movements reflect the overall health of the U.S. stock market.
What are Indices in Trading?
In trading, indices represent a group of stocks, bonds, or other financial instruments listed on an exchange. Indices trading involves buying or selling instruments that mirror the performance of a specific index rather than purchasing individual shares.
This approach helps traders gain broader market exposure and reduce risks linked to single stocks. Indices can be traded through products such as CFDs (Contracts for Difference), ETFs (Exchange-Traded Funds), and futures, allowing traders to speculate on price movements without owning the underlying assets.
What Are the Most Traded Indices?
Global indices are widely traded because of their liquidity, size, and influence on the global economy. These benchmarks reflect the performance of key market sectors and serve as indicators of economic strength across regions.
Here are some of the most popular indices traded worldwide:
S&P 500 (U.S.): Tracks 500 of the largest publicly traded companies in the United States.
Dow Jones Industrial Average (DJIA) (U.S.): Represents 30 major U.S. corporations, including leading multinationals.
The calculation of an index depends on its type and weighting method. In general, there are two main ways to determine an index’s value:
Price-Weighted Index: Each stock affects the index based on its share price. Higher-priced stocks have a greater impact. For example, the Dow Jones Industrial Average.
Market Capitalization-Weighted Index: Each stock is weighted according to its total market value. Larger companies with higher market capitalization have more influence. For example, the S&P 500.
In both methods, the index’s value is adjusted for events such as stock splits or dividends using a divisor, which helps standardize the overall index level.
How to Trade Indices?
Follow these steps to start trading indices with confidence and make the most of every market opportunity.
Step 1: Understand How Index Trading Works
Learn how indices reflect the performance of a group of stocks from different sectors. When you trade an index, you are speculating on the overall market movement instead of individual shares.
Step 2: Choose a Way to Trade Indices
There are several ways to trade indices:
CFDs (Contracts for Difference): CFDs allow traders to speculate on price movements without owning the underlying assets. You can trade both rising and falling markets.
ETFs (Exchange-Traded Funds):ETFs track an index’s performance and can be traded like regular stocks. Often used for longer-term investing.
Futures Contracts: Agreements to buy or sell an index at a specific price and date, commonly used by professional traders.
Choose a trusted broker such as VT Markets, which offers a range of global indices, tight spreads, and advanced trading platforms.
Step 4: Deposit and Fund Your Account
Deposit funds using your preferred payment method such as bank transfer, credit card, or e-wallet.
Step 5: Choose the Index You Wish to Trade
Select a market that matches your trading goals, such as the S&P 500, FTSE 100, or DAX 30.
Step 6: Decide Whether to Go Long or Short
Once you’ve selected your index, decide whether you want to go long (buy) or short (sell). Going long means you believe the index will increase in value, while going short means you believe the index will decline.
After deciding whether to go long or short, open your position by placing a trade on your chosen index. Make sure to set your position size and enter at the right price based on your analysis.
Step 8: Implement Risk Management Strategies
Effective risk management is key to success in indices trading. Use stop-loss orders to limit potential losses, and make sure to set a reasonable risk-reward ratio for each trade.
Step 9: Stay Informed and Updated
Keep an eye on global news, earnings reports, and economic data that can influence index movements. This will help you adjust your strategy and make more informed decisions.
Successful indices trading starts with the right strategy. Below are some of the most common trading strategies traders use to capture market opportunities:
Trend Following
Focus on identifying the market’s direction and trade with it. Traders buy when the index shows a steady uptrend and sell when it moves downward. This strategy works best in strong, directional markets.
Range-Bound Trading
In range-bound markets, prices move within a defined range. Traders use support and resistance levels to make buy and sell decisions, aiming to trade within the range.
News-Based Trading
Economic data, earnings reports, and political events can create sudden volatility. Traders use these moments to take short-term positions based on how news impacts market sentiment.
Swing Trading
Swing traders capitalize on short- to medium-term price movements within an index. They enter trades based on technical analysis and hold positions for several days or weeks.
What Moves Index Prices?
Index prices move for many reasons, and understanding these factors can help traders make better decisions. The main drivers include:
Economic Data: Reports such as GDP growth, employment rates, and inflation figures often shape market expectations. Positive data can lift index prices, while weak data may drag them down.
Corporate Earnings: Strong results from major companies within an index can push it higher, while disappointing earnings may cause a decline.
Interest Rates: Central bank decisions on interest rates affect borrowing costs and investor confidence. Lower rates usually support higher index values, while rate hikes can have the opposite effect.
Geopolitical Events: Elections, trade tensions, or global conflicts can create volatility and sudden market reactions.
Market Sentiment: Investor confidence, often driven by news and trends, plays a key role in short-term index movements.
What Are the Benefits of Index Trading?
Index trading offers several advantages that make it attractive to traders of all levels:
1. Diversification
Trading an index gives you exposure to a wide range of companies or sectors, helping you spread risk instead of depending on the performance of a single stock.
2. Lower Volatility
Since indices represent a basket of different stocks, their prices tend to move more steadily, offering smoother and more consistent trading opportunities.
3. Market Access
Indices such as the S&P 500 or FTSE 100 allow traders to access entire markets or sectors with just one trade, without needing to select individual companies.
4. Liquidity
Major indices like the NASDAQ and DAX 30 are highly liquid, meaning traders can open and close positions quickly with minimal price slippage.
5. Flexibility
Indices can be traded through instruments such as CFDs, ETFs, or futures, giving traders the freedom to choose the method that best fits their goals and trading style.
What Are the Risks of Index Trading?
While index trading offers many advantages, it also carries certain risks that traders should understand:
1. Market Risk
Indices can experience sharp declines during periods of economic slowdown or uncertainty. For example, the S&P 500 fell significantly during the 2008 financial crisis and the COVID-19 pandemic.
2. Leverage Risk
Using leverage can increase both potential profits and potential losses. Even a small market move against your position can result in large losses if you are trading with high leverage.
3. Economic Risk
Economic indicators such as GDP growth, inflation, and employment data can strongly influence index movements. Negative reports can quickly reduce the value of indices like the FTSE 100 or DAX 30.
4. Geopolitical Risk
Political events such as elections, wars, or trade disputes can cause volatility across global markets. For example, the CAC 40 may react sharply to political changes within France or the European Union.
5. Liquidity Risk
While major indices are typically liquid, smaller or less-traded ones may face lower trading volume. This can make it harder to enter or exit positions efficiently, especially during volatile periods.
In Summary
Index trading allows traders to speculate on the price movements of market indices that represent groups of stocks. It offers the key advantages of diversification, flexibility, and access to entire markets through instruments such as CFDs, ETFs, and futures. Compared with individual stocks, indices often show lower volatility and higher liquidity, making them a practical choice for many traders. However, like any form of trading, it involves risks including market fluctuations and leverage exposure. With a well-defined strategy and proper risk management, index trading can be an effective way to take advantage of broader market trends.
If you’re new to trading, start with a VT Markets demo account to practice strategies in real market conditions. For guidance and platform support, visit the VT Markets Help Center anytime.
Open your account today with VT Markets and start trading indices with control, confidence, and the tools to help you succeed.
Frequently Asked Questions (FAQs)
1. What are indices in trading?
Indices represent the combined performance of a group of stocks or assets. They allow traders to speculate on broader market movements without focusing on individual stocks.
2. How can I start trading indices?
To begin trading indices:
Step 1: Learn how index trading works.
Step 2: Choose a method such as CFDs, ETFs, or futures.
Step 3: Select a reliable broker like VT Markets.
Step 4: Fund your trading account.
Step 5: Choose the index you want to trade.
Step 6: Decide whether to go long or short.
Step 7: Open your position and manage risk effectively.
Step 8: Stay updated with market news.
3. What are the most traded indices?
The most popular indices include the S&P 500, Dow Jones Industrial Average (DJIA), NASDAQ Composite, FTSE 100, DAX 30, and CAC 40.
4. Is index trading profitable?
Yes, index trading can be profitable when supported by a strong strategy and risk management. However, as with all trading, it involves risks that must be managed carefully.
5. What are the benefits of index trading?
Index trading offers diversification, lower volatility, easy market access, high liquidity, and flexibility through CFDs, ETFs, or futures.
6. What are the risks of trading indices?
The main risks include market volatility, leverage exposure, and reactions to economic or political events. Liquidity issues can also occur in smaller indices.
Markets enter the week on edge as the US dollar index (USDX) consolidates around 98 after a mild rebound from lows last week. The markets are weighing the possibility that resilient US data could delay policy easing into 2026.
Meanwhile, risk assets remain buoyant, supported by optimism around artificial intelligence and improving corporate earnings. In particular, gold and crypto are testing upside thresholds while equities flirt with all-time highs.
Gold edged closer to the record high reached in the previous session, as traders took advantage of a sharp selloff at the end of last week to enter dip-buying https://t.co/4JhWr8esQC
With major inflation prints and GDP data due in coming days, volatility could return swiftly if numbers diverge from expectations.
Upcoming economic events
Date
Currency
Event
Forecast
Previous
Analyst Remarks
24 Oct
USD
CPI y/y
2.90%
—
Key inflation gauge for Fed policy path.
24 Oct
USD
Flash Services PMI
53.5
54.2
Softening momentum may weigh on USD into the weekend.
For full view of upcoming economic events, check out the Economic Calendar of VT Markets.
Key movements of the week
Gold (XAUUSD)
Gold eased from $4,380 to the range between $4,130 to $4,290 alongside dollar strength.
A break above $4,380 could target $4,587, while downside support lies between $4,000 to $4,130.
Traders eye US inflation data for near-term direction.
Bitcoin (BTCUSD)
Bitcoin broke $107,240 and tested $108,600, signalling strong bullish momentum.
Sustained consolidation above $108,000 could open $115,000 next.
Profit-taking risk increases if equities lose steam.
S&P 500 (SP500)
The index rebounded impulsively after failing to close below 6,557, now testing 6,740.
Continued consolidation may precede another push toward 6,900.
Traders monitor GDP and earnings sentiment for cues.
US dollar index (USDX)
USDX rebounded from 97.85 support and now consolidates near 98.45.
Strong GDP or PCE data could lift the dollar further.
Weak prints may renew pressure toward 97.00.
Crude Oil (USOIL)
Prices remain range-bound between $53.00 to $58.80, with limited directional conviction.
OPEC discipline and winter demand could stabilise prices.
Watch US inventory data for breakout signals.
Bottom line
As markets brace for a pivotal week, inflation and GDP releases across major economies could significantly reshape interest rate expectations heading into year-end. With monetary policy paths diverging, gold and Bitcoin continue to serve as critical gauges of investor sentiment, mirroring shifts in risk appetite and macro uncertainty.
Traders should watch the upcoming US Core PCE print and FOMC guidance closely, as both are likely to set the tone for positioning across currencies, commodities and crypto in November.
Please note that the dividends of the following products will be adjusted accordingly. Index dividends will be executed separately through a balance statement directly to your trading account, and the comment will be in the following format “Div & Product Name & Net Volume”.
Please refer to the table below for more details:
The above data is for reference only, please refer to the MT4/MT5 software for specific data.
If you’d like more information, please don’t hesitate to contact info@vtmarkets.com.
A golden cross is one of the most recognised bullish patterns in technical analysis. It occurs when a short-term moving average crosses above a long-term moving average, signalling a potential shift from a downtrend to an uptrend. Traders often see this as confirmation that bullish momentum is building and that it may be an opportunity to enter the market.
This guide explains what the golden cross means, how it works, and how traders can use it effectively, supported by real-life examples, statistics, and insights for modern trading.
What Is a Golden Cross?
A golden cross (or golden crossover) is a bullish chart pattern that happens when a short-term moving average, usually the 50-day, crosses above a long-term moving average like the 200-day. This signal shows that recent prices are rising faster than the long-term trend, suggesting that buying momentum is building and a new uptrend might be forming.
In simple terms, the golden cross tells traders that the market’s short-term direction is turning positive after a period of weakness. It often marks the beginning of renewed confidence among investors and is used as one of the clearest signs of a potential bullish phase.
Three Stages of a Golden Cross
The golden cross usually develops in three main stages, reflecting a gradual shift in market sentiment from bearish to bullish over time:
1. Downtrend Weakens
The short-term moving average begins to flatten or move upward after an extended decline, suggesting that selling pressure is losing strength and the market may be finding a bottom.
2. The Crossover
The short-term moving average crosses above the long-term moving average, forming the golden cross. This stage signals a potential trend reversal and is often viewed as the technical confirmation of bullish momentum.
3. Continuation of the Uptrend
Following the crossover, the market continues to rise as buyers gain confidence and volume increases. This stage confirms the strength of the new upward trend, although traders still monitor for false signals in uncertain or volatile markets.
Example of a Golden Cross
Let’s take the S&P 500 index as an example to understand how a golden cross forms.
Initially, the index had been trading lower for several weeks, causing the 50-day moving average (short-term) to slope downward, while the 200-day moving average (long-term) also trended lower but at a slower pace. As buying interest gradually returned, prices began to stabilise and move higher. The short-term moving average started to flatten out, showing that downward momentum was losing strength.
As the rally continued, the 50-day MA began to rise more sharply. Eventually, it crossed above the 200-day MA, forming the golden cross. This crossover indicated that recent price action had turned bullish enough to shift the broader trend.
Following the crossover, trading volume increased, and price candles generally closed higher than they opened, confirming stronger buying pressure. The upward slope of both moving averages after the crossover further supported the continuation of the bullish trend.
This example highlights how a golden cross does not occur instantly. It develops gradually as short-term momentum builds and overtakes the long-term trend, often marking the beginning of a more sustained uptrend.
Moving Averages in the Golden Cross
Moving averages form the foundation of the golden cross trading approach because they smooth out price fluctuations and reveal the underlying market trend. Instead of reacting to daily volatility, moving averages help traders see the bigger picture and determine whether momentum is strengthening or fading over time.
The short-term moving average, such as the 50-day MA, responds quickly to recent price changes. It reflects near-term sentiment and helps identify when buyers start regaining control. The long-term moving average, often the 200-day MA, moves more slowly and represents the market’s broader direction.
When the short-term MA crosses above the long-term MA, it signals that recent prices are consistently outperforming past levels. This shift shows growing bullish momentum and helps confirm a possible trend reversal. Many traders view this crossover as a transition point from a period of consolidation or decline to a potential long-term uptrend.
Traders often use different combinations of moving averages based on their strategy and may prefer certain pairs over others:
Short-term traders may prefer faster averages such as the 20-day and 50-day crossovers to capture quick market movements.
Position traders and long-term investors tend to rely on the 50-day and 200-day pair to confirm major trend reversals.
Because moving averages are objective and data-based, they serve as one of the most reliable tools for identifying market direction and timing entries or exits in golden cross trading.
Benefits of the Golden Cross
The golden cross offers several key advantages to traders and investors. It is easy to understand, visually clear on charts, and helps traders align with the broader market trend.
Simple and Easy to Identify: The signal is clear when one moving average crosses above another. Traders can instantly see this on the chart without using complex calculations or tools.
Reliable for Long-Term Trends: The golden cross often appears before strong market rallies. Historically, the S&P 500 has often shown strong performance in the months following a golden cross.
Applicable Across Different Markets: The pattern works not only in stocks but also in forex, precious metals, cryptocurrency, and other financial markets. This makes it a flexible strategy for traders with different interests.
Encourages Trend Following: The golden cross helps traders stay aligned with the overall market direction instead of reacting to short-term volatility. It supports disciplined trading based on momentum rather than emotion.
Widely Recognised by Market Participants: Because many traders and institutions track this signal, it can influence market sentiment and reinforce the trend once it appears.
Limitations and Risks of the Golden Cross
While the golden cross is a widely recognised and trusted signal, it is not perfect. Traders should understand its limitations and use it with other tools for better accuracy.
Lagging Indicator: The golden cross is based on historical data, so it often appears after a new trend has already begun. Because it uses past price information, the signal often confirms a move that has already started rather than predicting it.
False Signals in Sideways Markets: In sideways markets, multiple crossovers can occur, creating false signals known as ‘whipsaws.’ These false signals can result in small but frequent losses.
Overreliance Without Confirmation: The golden cross works best when supported by other indicators such as the Relative Strength Index (RSI), MACD, or trading volume. Using it in isolation can lead to poor trade timing or misinterpretation of the trend.
Market Conditions Matter: The effectiveness of the golden cross varies depending on volatility, liquidity, and broader economic sentiment. It performs best in trending markets and less effectively during periods of uncertainty or low momentum.
Golden Cross vs Death Cross
The golden cross signals bullish momentum, while the death cross represents bearish momentum when the short-term moving average crosses below the long-term moving average.
Feature
Golden Cross
Death Cross
Direction
Bullish
Bearish
Market Sentiment
Positive
Negative
Signal
Short-term MA crosses above long-term MA
Short-term MA crosses below long-term MA
Historical Impact
Often precedes long rallies; has occurred before major bull runs
Often precedes short-term declines; has occurred before significant market downturns
The main difference between the golden cross and the death cross lies in the direction of the moving averages and the sentiment they convey. A golden cross forms when the short-term moving average crosses above the long-term moving average, signalling a shift toward bullish momentum and potential upward movement.
In contrast, a death cross appears when the short-term moving average crosses below the long-term moving average, indicating bearish momentum and possible downward pressure. Many traders observe both patterns to track market cycles and identify potential trend reversals.
Understanding both helps traders interpret what these signals mean for market conditions and adjust their strategies accordingly.
In Summary
The golden cross remains a timeless concept in technical analysis, valued for its simplicity and effectiveness in identifying potential bullish trends. While it should not be used on its own, combining it with other tools and sound risk management allows traders to approach the market with more confidence. Ultimately, the golden cross reminds traders that patience, discipline, and awareness of market trends can make a real difference in achieving long-term success.
Start Trading the Golden Cross Today with VT Markets
If you are ready to apply what you have learned, VT Markets provides all the tools you need to identify and trade golden cross setups effectively. With advanced charting features on MetaTrader 4 (MT4) and MetaTrader 5 (MT5), you can analyse moving averages, test strategies, and act on trading opportunities in real time.
Start trading with VT Markets to explore how patterns like the golden cross can help you trade with greater clarity and confidence.
Frequently Asked Questions (FAQs)
1. What is the meaning of the golden cross?
The golden cross is a bullish technical chart pattern that occurs when a short-term moving average crosses above a long-term moving average. It signals a potential shift from a downtrend to an uptrend, showing that buying momentum is starting to outweigh selling pressure.
2. Is the golden cross a reliable trading signal?
It is generally considered reliable for identifying long-term bullish trends, though it works best when confirmed by other indicators and volume analysis.
3. What timeframes are best for identifying a golden cross?
The 50-day and 200-day combination is most common for long-term trading, while shorter timeframes (20-day and 50-day) suit intraday or swing traders.
4. Can I use the golden cross in forex or crypto markets?
Yes. The golden cross works across all liquid markets and asset classes, including forex, stocks, and cryptocurrencies like Bitcoin and Ethereum.
5. What is the difference between a golden cross and a death cross?
A golden cross signals a bullish trend, which means the short-term moving average has crossed above the long-term moving average, suggesting a potential upward trend change. In contrast, death cross signals occur when the short-term moving average crosses below the long-term moving average, which means a possible long-term bear market and a downward trend change.
6. How often do golden crosses occur?
They vary depending on market volatility. For major indices like the S&P 500, a golden cross has occurred over the course of many years, typically appearing once every 1–2 years.
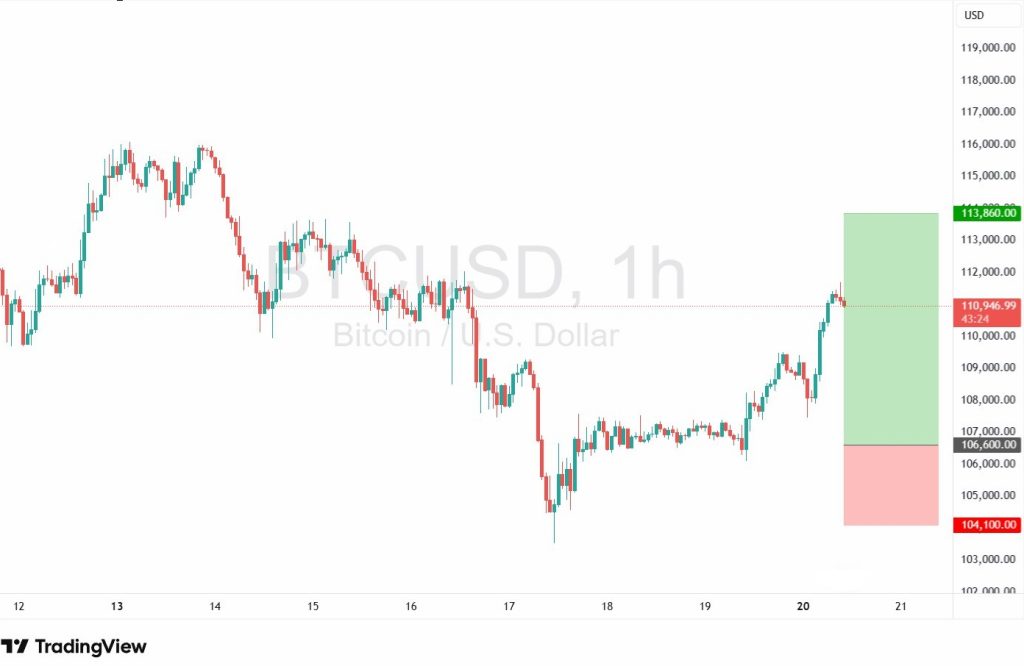
Bitcoin (BTC/USD) continues its recovery after completing a 5-wave bearish sequence that bottomed near $103,510. The October 2025 flash crash, which was triggered by geopolitical tensions and a surprise 100% U.S. tariff on Chinese imports, has wiped out over $500 billion in crypto market cap, marking one of the most severe single-day liquidations in crypto history. Since then, Bitcoin has rebounded sharply, with Asian session buying reinforcing bullish sentiment and price action now approaching a prior swing high at $111,700.
Crypto market context: Crash, reset and rebound
The October crash acted as a structural reset for Bitcoin, normalising key metrics like the MVRV ratio and reducing profit-holding addresses from 91% to 83%. Stablecoins also faced pressure, with USDe depegging by 38% in the face of liquidity stress.
However, institutional inflows have since returned, with over $14.2 billion entering Bitcoin ETFs, and long-term holders now account for 45% of total supply, which is a sign of growing confidence.
Bitcoin dominance and the altcoin rotation
As Bitcoin stabilised and pushed near $112K, its dominance peaked, prompting capital rotation into altcoins. Analysts now anticipate a year-end altcoin surge, with some tokens already posting 30% to 50% rebounds from October lows. Ethereum, Solana, and other Layer 1s have begun to outperform, suggesting the early stages of an “altcoin season” as traders diversify beyond Bitcoin.
Technical analysis: Bitcoin eyes key resistance
BTC/USD is currently approaching resistance at $113,860, with bullish momentum intact. A break above this level could open the path toward $114,900 and potentially higher. On the downside, rejection at resistance may trigger a pullback toward the zone between $110,000 to $108,000, with bespoke support at $106,600 offering a key re-entry zone.
Resistance: $113,860 and $114,900
Support: $106,600, $108,000 and $110,000
Bullish setup: Buy dips toward $106,600 with stops below $105,800. Target $113,860 and $114,900.
Bearish setup: Short on rejection near $114,900, targeting between $110,000 and $108,000.
Range play: Trade within $106,600 and $114,900 until breakout confirms direction.
Momentum builds but volatility remains
With Bitcoin reclaiming key levels and altcoins gaining traction, sentiment has shifted from panic to cautious optimism. Traders should monitor ETF flows, macro headlines, and volume confirmation around resistance zones. While the bullish structure remains intact, volatility is likely to persist as markets digest the fallout from the October crash and prepare for year-end positioning.