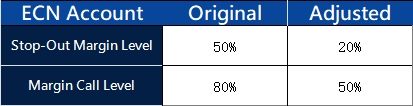
To provide our valued clients with an enhanced trading environment, VT Markets will adjust certain trading conditions for ECN account on August 2, 2025:
Friendly reminder:
1.All account settings stay the same except for the above adjustments.
2.All account types now have the same Stop-Out and Margin Call Level.
If you’d like more information, please don’t hesitate to contact info@vtmarkets.com.
Trade tensions and political uncertainty have weighed on the euro this week, while the US dollar gained strength on safe-haven demand and renewed global engagement. With central bank guidance and policy risks in focus, EUR/USD remains under pressure.
Euro under renewed pressure
The euro struggled to recover this week following Monday’s sharp 1.3% decline – its steepest one-day drop in over two months.
EUR/USD was last seen trading at $1.1594, rising only 0.07% as markets absorbed the broader implications of the newly ratified US-EU trade agreement.
The EU dodged an imminent trade war with the US this week, but markets and a growing chorus of critics have dispelled early hopes that the deal will bring a sense of stability back to transatlantic relations https://t.co/xDfQfplSqJ
The deal triggered political backlash across Europe. French officials condemned it as a “dark day” for the continent, while German Chancellor Friedrich Merz warned that the 15% base tariff on EU exports could cause significant harm to Germany’s export-driven economy.
Falling European bond yields added to the euro’s weakness, helping the US dollar strengthen further. The Dollar Index (USDX) gained 1% overnight to reach 98.67.
This strength also dragged the British pound to a two-month low of $1.3349 and pushed USD/JPY higher to 148.49.
Outside Europe, dollar strength was reinforced by growing signs of renewed US diplomatic engagement.
Macquarie strategist Thierry Wizman suggested the dollar’s rise reflects more than trade – it signals a wider re-engagement strategy.
President Trump also warned that countries without standalone deals may face tariffs of 15–20%, intensifying global trade uncertainty.
Meanwhile, US-China talks resumed in Stockholm, extending their trade truce by another three months.
Traders now await interest rate decisions from both the Federal Reserve and the Bank of Japan. While no changes are expected, forward guidance could shape market direction into the next quarter.
Technical analysis
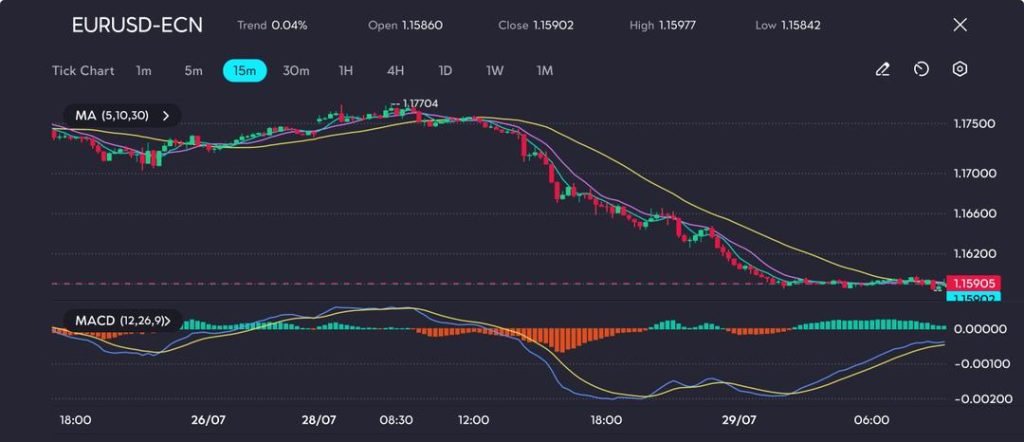
EUR/USD remains in a clear downtrend after peaking near 1.1770, forming a series of lower highs and lower lows over recent sessions.
Both the 5- and 10-period moving averages are sloping downward, confirming continued bearish momentum.
Price is currently trading just beneath these short-term averages, highlighting sustained selling pressure.
Picture: EUR/USD breaks below key support after a relentless downtrend from 1.1770, as seen on the VT Markets app.
Although the MACD remains in negative territory, the histogram bars are beginning to contract slightly – indicating a possible, albeit limited, slowdown in downward momentum.
A decisive move below 1.1580 could open the door to further losses toward the 1.1530 support area.
On the upside, a break above 1.1620 would be needed to challenge the current descending trendline and potentially shift sentiment.
Bearish outlook unless key resistance breaks
Unless EUR/USD can decisively reclaim the 1.1620 level, the pair remains vulnerable to further downside pressure, with 1.1550 seen as the next key support.
A brief consolidation may occur near this level, but any sustained recovery would likely require a clear shift in market sentiment or fresh macroeconomic catalysts.
Traders remain cautious as geopolitical tensions and trade uncertainties weigh on confidence. The euro continues to struggle amid concerns over export tariffs and the broader impact of the US-EU trade deal, which many analysts believe could undermine European competitiveness in the months ahead.
Looking ahead, forward guidance from the Federal Reserve and the European Central Bank will be closely watched.
Any signals regarding inflation outlook, interest rate timelines, or monetary policy adjustments could influence near-term price action.
As Q3 progresses, these policy cues will be crucial in determining whether EUR/USD can stabilise – or slip further into bearish territory.
In the world of trading, having the right tools to assess market trends and price movements is essential. One such powerful tool is VWAP (Volume Weighted Average Price), an indicator that provides a real-time average price of an asset, factoring in both its price and the volume of trades. Whether you’re a day trader looking to identify entry and exit points or seeking to understand market sentiment, VWAP offers valuable insights. In this article, we’ll explore what VWAP is, how it works, how to calculate it, and how traders use it to make more informed decisions in dynamic markets.
What is VWAP?
VWAP, or Volume Weighted Average Price, is a key technical indicator widely used by traders to evaluate the average price of an asset over a specific period, factoring in both its price and volume. It provides an insightful gauge of the market’s average price, considering the importance of trading volume at different price levels. In simpler terms, VWAP helps traders understand whether the price of an asset is overvalued or undervalued, making it essential for day trading and intraday analysis.
What makes VWAP unique is its inclusion of volume, which reflects the true market activity at each price level. Higher volumes at certain price points have more influence on the VWAP than lower-volume trades, making it a more accurate representation of the market’s consensus price at any given time. VWAP is a stock weighted indicator, meaning prices are weighted by trading volume to provide a more accurate market consensus. For traders, VWAP is an essential tool to determine whether an asset is overvalued or undervalued, especially in the context of day trading and intraday analysis. It is especially useful for identifying trends, entry points, and exit points in a fast-moving market.
How VWAP Works
VWAP operates by calculating the average price of an asset throughout the trading day, weighted by the volume of each trade. It is updated in real-time during the trading session and reflects the true value of a stock, incorporating both price and trading volume. Calculating VWAP involves determining the value for each data point—typically each intraday candle or bar—so that VWAP is calculated continuously as new data points are added throughout the session.
The key to understanding how VWAP works is recognizing its reliance on volume. A larger trading volume at a specific price point results in a greater influence on the VWAP, making it more relevant in evaluating the price action of an asset. VWAP is calculated using the price and volume of each data point within a defined period, and the calculation maintains a running total of price-volume values throughout the session. For example, if a stock experiences a high volume of trades at $100, that price point will have a more significant impact on the VWAP than trades at $95 with lower volume. VWAP is calculated by aggregating these values over the selected period.
Formula for VWAP
VWAP is updated continuously during the trading day, providing a running average that reflects both the price and volume of an asset. The formula for VWAP is as follows:
VWAP = Sum of (Typical Price × Volume) / Total Volume Traded
Where:
Typical price is calculated as the average of the high, low, and closing price for each interval.
Closing price is one of the components used to determine the typical price.
Volume is the number of shares or contracts traded at that price point.
Total volume traded refers to the sum of all shares or contracts traded during the period.
VWAP is calculated using the typical price for each interval, multiplied by the volume, summed across all intervals, and then divided by the total volume traded during the period. This process results in a running average, updated throughout the trading session.
How to Calculate VWAP
To calculate VWAP accurately throughout the trading day, follow these steps:
Calculate the average price, also known as the typical price, for each trading period (e.g., 5-minute window) by adding the high, low, and closing price for that period and dividing the sum by three: (high + low + closing price) / 3. This gives the typical price for that specific period.
Multiply the typical price by the volume traded during that period. This is called Price × Volume (PV).
Each period represents a data point in the calculation. Record the PV value for each data point, then add the PV values from all data points throughout the day.
Divide the running total of PV by the cumulative, or total volume traded up to that point. This provides you with the updated VWAP for the day.
How Traders Use VWAP
Traders use VWAP in various ways to enhance their trading strategies, particularly for intraday trading. Here’s how VWAP can be applied:
1. Trend Identification
VWAP helps traders identify the overall market trend. When the current price is above the VWAP, it generally indicates a bullish market, as it shows that buyers are in control. Conversely, when the price is below the VWAP, it suggests a bearish trend, indicating that sellers are dominant. A downward trend is characterized by prices consistently trading below the VWAP, signaling ongoing selling pressure.
Example:
For major currency pairs like EUR/USD, if the price is trading at 1.2100 while the VWAP is at 1.2050, it indicates that the price is above the VWAP, suggesting a bullish trend. Traders may interpret this as a sign that buying pressure is stronger than selling pressure. However, if the price begins to decline and drops to 1.2000, falling below the VWAP, it could signal a potential reversal to a bearish trend, indicating that sellers are gaining control of the market.
2. Entry and Exit Points
VWAP can serve as a support or resistance level for price movements during the day. Traders use these levels to decide the best time to enter or exit positions. When the price approaches the VWAP from below, it may act as a support level. When the price moves toward VWAP from above, it may serve as a resistance level.
Example:
For commodities like gold (XAU/USD), suppose the price has been rising steadily and reaches $1,825, while the VWAP is at $1,810. If the price starts to pull back and approaches the VWAP at $1,810, traders may view this as a support level. If the price holds above this level and starts to rise again, it could be an ideal entry point for a long position, with the expectation that the uptrend will continue. However, if the price fails to hold above the VWAP and moves lower, this could signal the end of the uptrend, and traders might exit or short the position.
3. Volume Confirmation
VWAP helps traders confirm the strength of a trend by considering the volume of trades at each price level. High trading volume at specific price levels typically indicates stronger market participation, which makes the trend more reliable. Conversely, low volume during price movements can signal a weak trend that may not be sustainable.
Example:
In Tesla (TSLA), suppose the stock breaks above the VWAP at $650 with significantly higher volume than its average. This suggests that the breakout is supported by strong buying interest, confirming the strength of the trend. Traders might interpret this as a good signal to enter long positions. However, if the price of Tesla moves above the VWAP at $650, but the volume is relatively low, it may indicate that the price move lacks conviction. In this case, traders may hesitate to enter or may even decide to wait for a clearer signal before making a move.
Advantages and Disadvantages of VWAP
While VWAP is a valuable tool for traders, there are both advantages and disadvantages to using it:
Advantages:
Volume-Weighted Insight: VWAP takes into account both price and trading volume, providing a more accurate representation of an asset’s value. This helps traders understand the market’s true sentiment and make better-informed decisions.
Trend Confirmation: VWAP is an excellent tool for confirming the prevailing trend. When prices are above VWAP, it signals a bullish market, while prices below VWAP indicate bearish sentiment, helping traders spot potential entry and exit points.
Support and Resistance: VWAP acts as a dynamic support and resistance level, providing traders with a reliable benchmark to identify key levels where the price might reverse or continue its movement.
Disadvantages:
Intraday Limitation: VWAP is most useful for intraday trading and resets at the start of each trading day. It is not effective for long-term trend analysis, which makes it less suitable for swing traders or position traders.
Not a Predictive Indicator: VWAP tracks past price and volume data, which means it doesn’t predict future price movements. It’s helpful for understanding market trends, but should be used with other tools for more comprehensive analysis.
Less Effective in Volatile Markets: During periods of high volatility, VWAP might give conflicting signals as prices can rapidly move away from the VWAP, leading to false interpretations. In such markets, traders may need to adjust their strategies accordingly.
Weighs periods with higher trading volumes more heavily.
Treats all prices equally without considering volume.
Time Sensitivity
Resets daily, suitable for intraday trading.
Calculated for a set period, suitable for both short- and long-term analysis.
Usage
Best for intraday trading and short-term analysis.
Applicable for both short-term and long-term trading strategies.
Volume Sensitivity: VWAP differs from moving averages in that it gives more weight to periods with higher trading volumes. This makes VWAP a more accurate reflection of price action, especially for assets that experience varying liquidity levels. Moving averages, on the other hand, treat every price point equally, which can make them less reliable in markets with fluctuating volumes.
Time Sensitivity: Unlike moving averages, which are calculated over a fixed period (e.g., a 20-day SMA), VWAP resets at the start of each new trading day. This makes VWAP particularly useful for intraday trading, as it provides a real-time measure of an asset’s price action throughout the day. Moving averages, however, are typically used to track trends over longer periods, such as days, weeks, or months, making them suitable for both short-term and long-term trading strategies.
Usage: VWAP is primarily used by day traders and intraday traders because it resets every day and provides a real-time weighted average. This makes it ideal for assessing short-term trends. Moving averages are more versatile and can be applied to both short-term and long-term strategies, helping traders track broader trends over a set period.
Common Mistakes When Using VWAP
While VWAP is a powerful tool, there are some common mistakes traders should avoid:
Overreliance on VWAP: Traders sometimes rely solely on VWAP without considering other indicators or market conditions. This can lead to poor decision-making. It’s essential to use VWAP in combination with other tools like RSI or MACD for a more complete analysis.
Ignoring Volume: Since VWAP is volume-weighted, neglecting the volume aspect can lead to false signals. For instance, a price move without strong volume backing it may not be as significant as it appears. Always consider both price and volume for more accurate insights.
Misinterpreting in Trending Markets: In strong uptrends or downtrends, VWAP may act as dynamic support or resistance. Relying on it without considering the strength of the trend can result in missed opportunities or wrong decisions. Traders should adjust their strategy accordingly.
Using VWAP in Isolation: While VWAP is useful for intraday trading, using it in isolation without a broader market context can lead to confusion. Traders should factor in overall market conditions and other technical indicators to ensure they’re making informed decisions.
In Summary
VWAP is a valuable indicator for traders looking to analyze intraday price action by considering both price and volume. It offers insights into market sentiment, supports decision-making for entry and exit points, and can help traders identify potential trends. However, like any indicator, it should be used in conjunction with other analysis tools for the best results.
Start Trading Today with VT Markets
Are you ready to integrate VWAP into your trading strategy? VT Markets provides access to advanced charting tools, competitive spreads, and a wide range of assets to trade. Whether you prefer MetaTrader 4 (MT4) or MetaTrader 5 (MT5), our platforms offer real-time market data and powerful tools to enhance your trading decisions. If you’re new to trading, you can explore our VT Markets demo account to practice with virtual funds before going live. Our Help Centre is also available to guide you through the process, ensuring you have all the support you need to succeed.
VWAP stands for Volume Weighted Average Price. It is a technical indicator that calculates the average price of an asset throughout the day, weighted by trading volume. It is used to assess the true value of an asset, as it takes both price and volume into account, providing a more accurate reflection of market activity compared to other price-based indicators.
2. What is the difference between VWAP and moving averages?
VWAP is a volume-weighted average price, whereas moving averages (SMA/EMA) give equal weight to all prices, regardless of volume. VWAP is more suited for intraday trading.
3. Can VWAP be used in long-term trading?
No, VWAP is mainly used for intraday analysis and resets every day, making it less suitable for long-term trading.
4. How often should traders update their VWAP calculations?
VWAP is updated in real-time throughout the trading day, so traders should monitor it continuously during market hours.
5. How can VWAP help identify market trends?
VWAP helps identify whether a market is in an uptrend or downtrend. When the price is above the VWAP, it typically indicates a bullish market, while prices below the VWAP suggest a bearish trend. A downward trend is indicated when prices remain below the VWAP for an extended period.
6. Can VWAP be used for all types of assets?
Yes, VWAP can be applied to a wide range of assets, including stocks, forex, precious metals, and cryptocurrencies. However, it is particularly popular in intraday trading due to its real-time updates.
7. How do traders use VWAP for entry and exit points?
Traders use VWAP as a support or resistance level. If the price approaches VWAP from below, it may act as a support level to buy, and if it approaches from above, it may act as a resistance level to sell.
8. What is the best way to combine VWAP with other indicators?
VWAP works well in conjunction with momentum indicators like RSI or MACD to confirm the strength of a price move, or with trend indicators like moving averages to assess the overall trend direction.
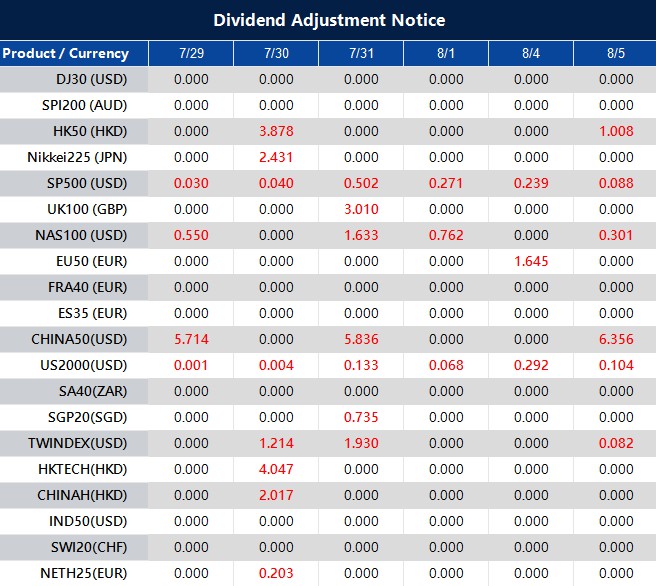
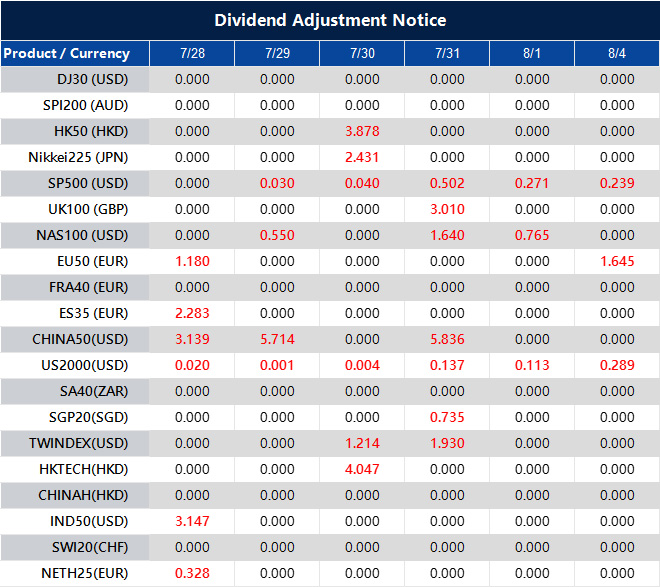
Please note that the dividends of the following products will be adjusted accordingly. Index dividends will be executed separately through a balance statement directly to your trading account, and the comment will be in the following format “Div & Product Name & Net Volume”.
Please refer to the table below for more details:
The above data is for reference only, please refer to the MT4/MT5 software for specific data.
If you’d like more information, please don’t hesitate to contact info@vtmarkets.com.
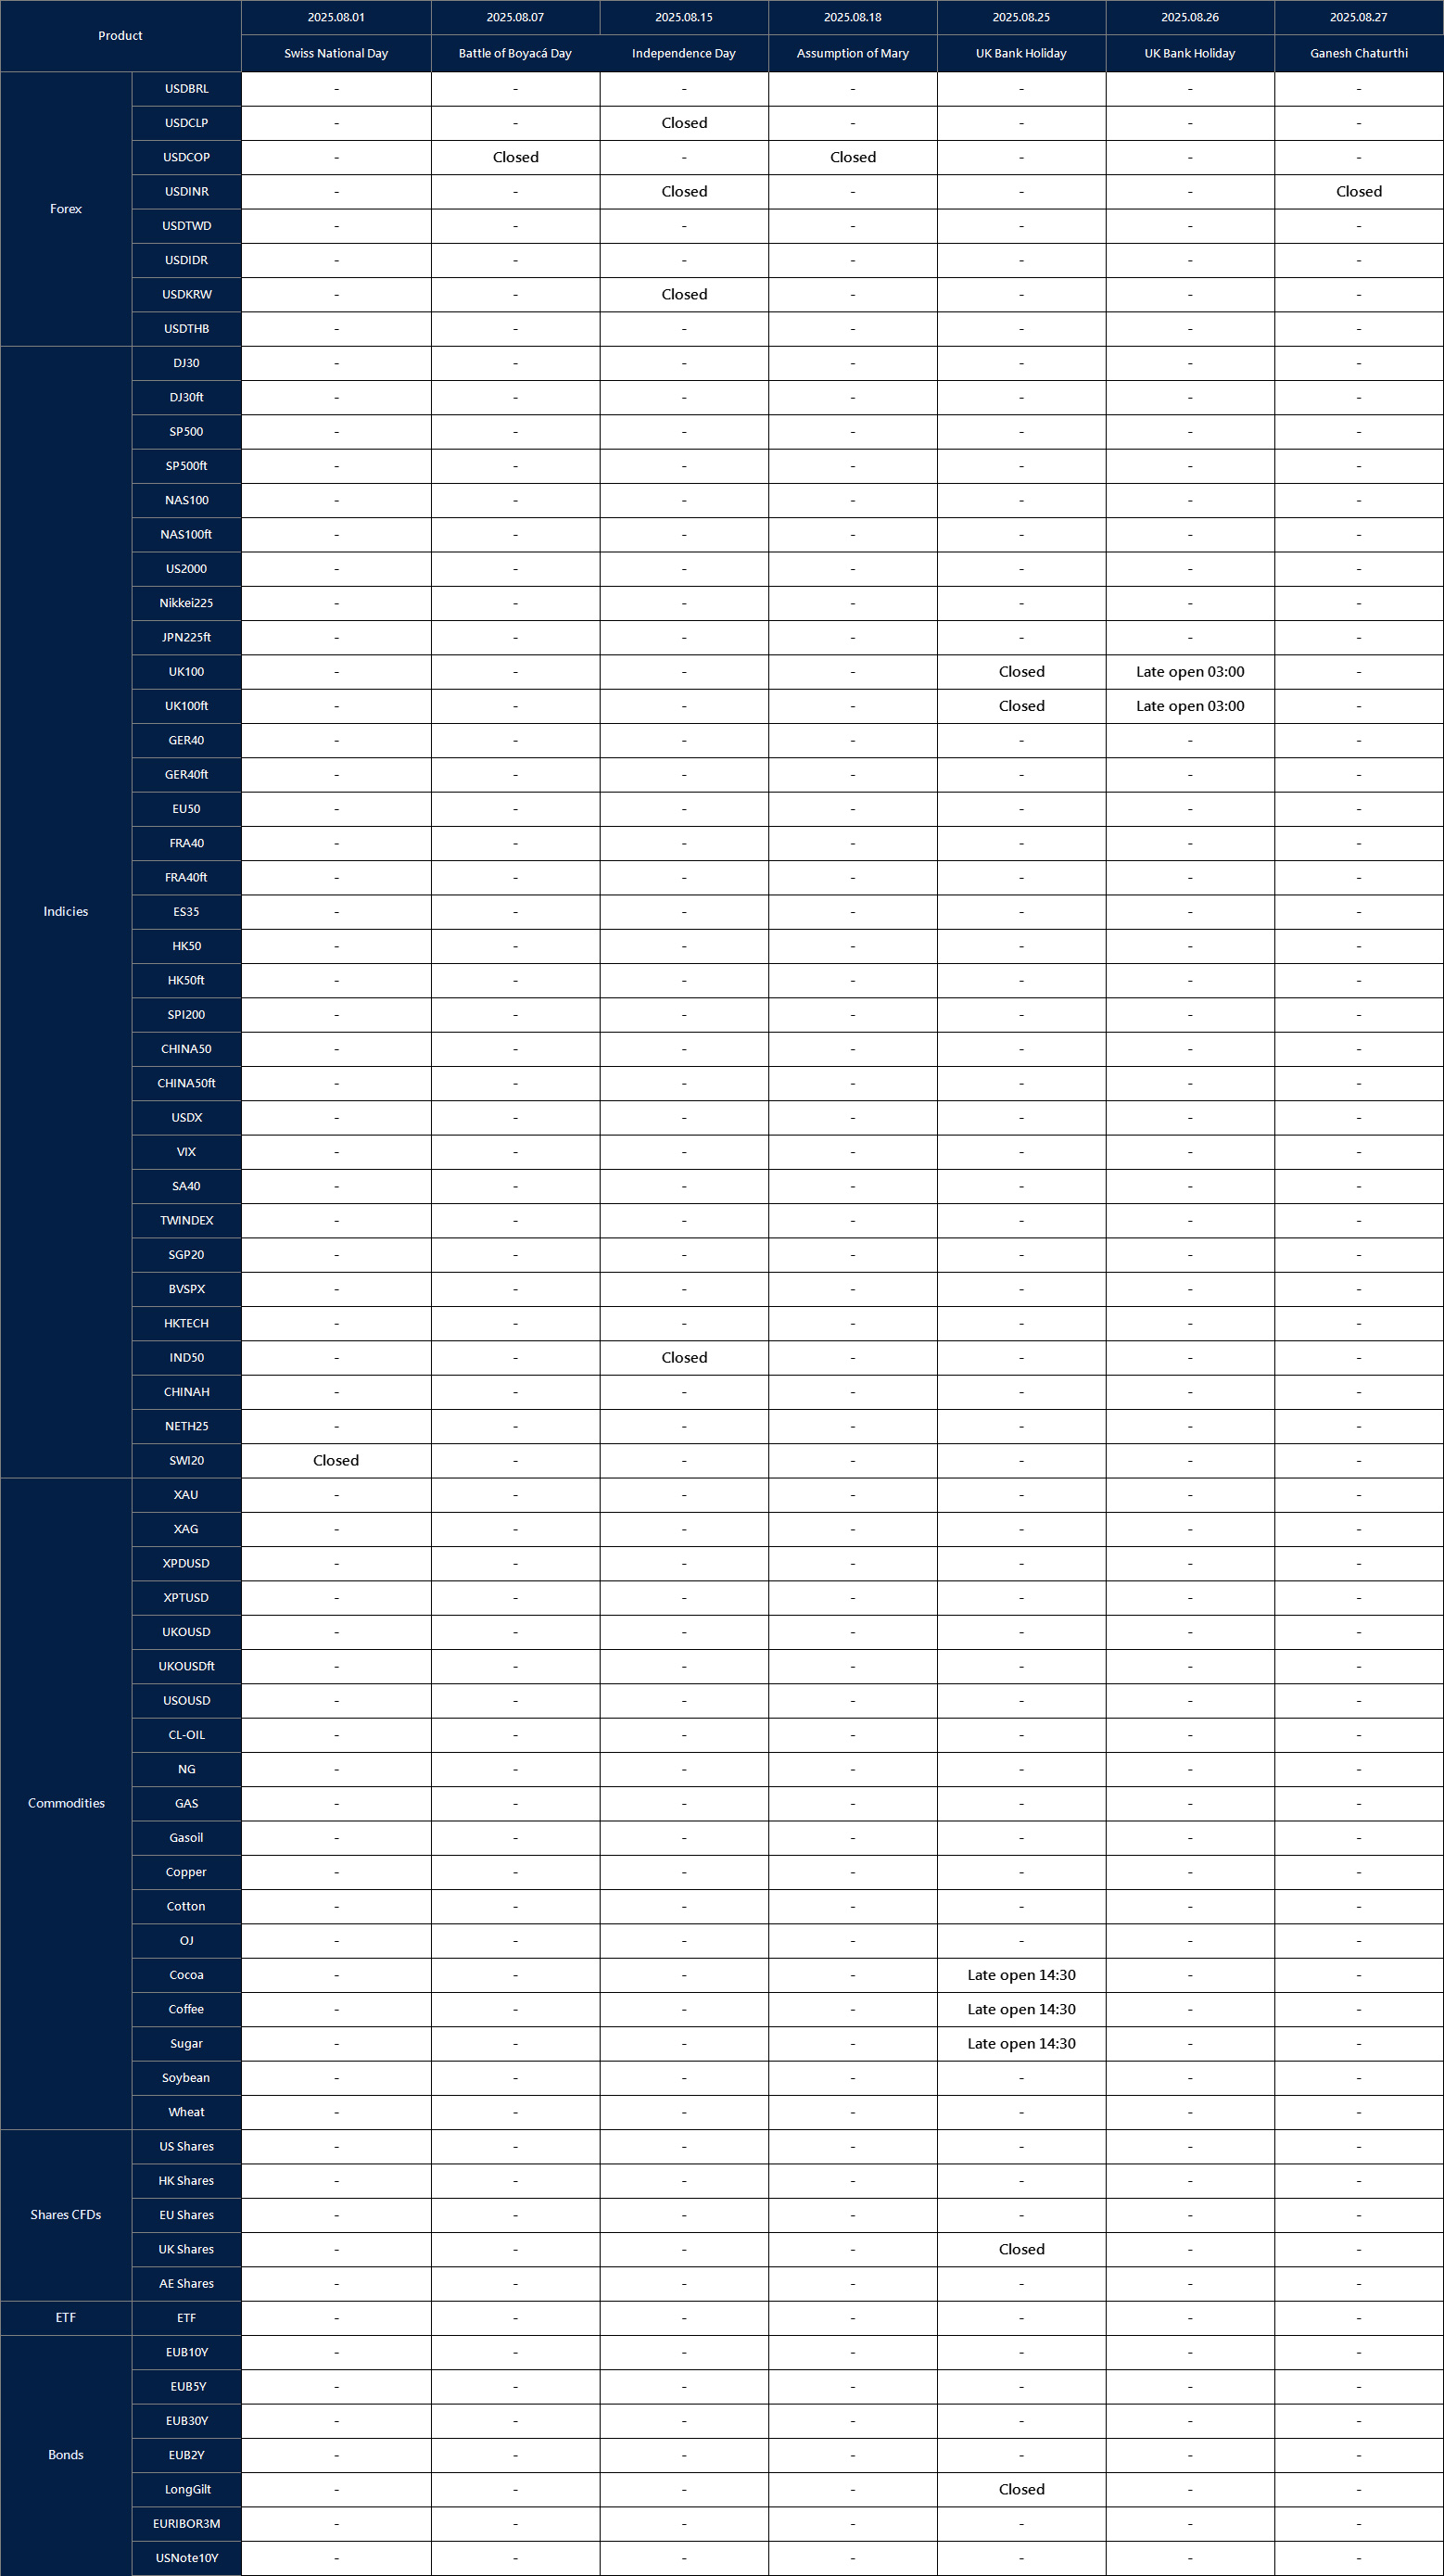
Affected by international holidays, the trading hours of some VT Markets products will be adjusted. Please check the following link for the affected products:
Crypto markets started the week on a positive note, driven by easing trade tensions and fresh progress on US regulation. As lawmakers work to clarify the legal status of digital assets, investor confidence is improving, setting the stage for potential short-term gains.
Bitcoin up on hopes of easing regulation
Bitcoin kicked off the week on a positive note, climbing 0.8% to $119,026, according to CoinDesk.
The rally comes as global trade tensions show signs of easing, and the US makes strides in establishing clearer cryptocurrency regulations.
Meanwhile, Ether rose 3.3% to $3,890, XRP advanced 2.6% to $3.27, and Solana gained 2.7% to reach $192.21.
In broader markets, equity futures edged higher – S&P 500 futures were up 0.3%, and Nasdaq futures rose 0.5%.
Much of Bitcoin’s recent support has been linked to improving global sentiment following President Donald Trump’s announcement of a 15% base tariff on EU imports.
While the new measure maintains certain trade limitations, it has largely been perceived by investors as a stabilising move – particularly for risk assets like cryptocurrencies.
European capitals are putting a brave face on the trade deal they struck with President Donald Trump, which will see the European Union accept a 15% tariff on most of its exports to the US while reducing levies on some American products to zero https://t.co/8Xxn0ncTWF
Additionally, progress on US crypto regulation has further boosted market confidence. The Genius Act – now enacted into law – provides formal recognition of stablecoins as legitimate financial instruments pegged to traditional fiat currencies.
"Ethereum is the largest beneficiary of the Genius Act, which is the stablecoin bill, because ethereum hosts is home to the majority of stablecoins," The Ether Machine co-founder @AK_EtherMachine says. pic.twitter.com/DAiT62iTX9
More critically, the House passed the Clarity Act, a long-awaited bill aimed at defining whether cryptocurrencies are to be treated as commodities or securities.
This legal clarity is expected to attract increased interest from institutional investors who have remained on the sidelines due to regulatory uncertainty.
Technical analysis
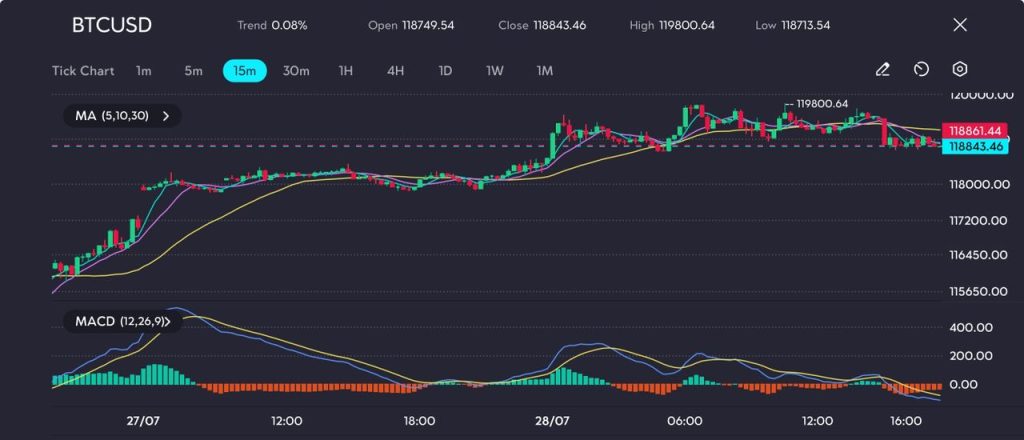
Bitcoin has entered a consolidation phase after reaching a recent intraday high of $119,800.64.
Despite initial bullish momentum, the price has since lost steam and is now hovering just below the 10- and 30-period moving averages on the 15-minute chart.
Picture: BTC/USD retraces after testing $119,800 resistance, as seen on the VT Markets app.
A bearish crossover between the 5- and 10-period moving averages beneath the 30-MA signals a decline in upward strength.
The MACD has also turned negative – its main line has dipped below the signal line, and the histogram is growing increasingly bearish. These signals suggest growing downward pressure.
BTC continues to test a key support zone around $118,700, which has so far held firm. However, a decisive break below this level could trigger a further drop towards $118,200.
For bulls to regain control, the price would need to reclaim $119,800 with strong volume, ideally confirmed by a bullish MACD crossover.
Short-term forecast: Cautious optimism
Bitcoin’s ability to hold above the $118,700 support level remains a key factor in the near-term outlook.
Should this level continue to provide a solid floor, the price may attempt another push toward the psychologically significant $120,000 mark.
However, the path upward appears less certain, as short-term technical indicators are showing signs of fatigue.
The MACD is trending lower, and moving averages on the intraday chart are beginning to flatten – both signals suggesting that bullish momentum is weakening.
While a breakout above $120,000 is still within reach, any move higher is likely to be slow and methodical rather than explosive.
Traders and investors may remain cautious until there is greater clarity on the regulatory front. Much will depend on how the Senate responds to the Clarity Act when it reconvenes.
A supportive stance could reignite market enthusiasm, especially among institutional players who have long awaited a definitive legal framework.
Until then, BTC may continue to trade within a tight range, with sentiment fluctuating based on macroeconomic news and policy signals from Washington.
As July ends, markets face a crucial transition: fading trade optimism, rising inflation risks, and major central bank meetings – including the Fed and the BOJ – will test momentum. With low summer liquidity, macro shocks could trigger outsized swings.
KEY INDICATORS
Currency moves
The US dollar rose as trade optimism faded.
Markets suggest the “TACO trade” (Trump Always Chickens Out) narrative is losing momentum.
The yen remained volatile ahead of Japan’s upper house election.
Commodities and equities
Oil prices climbed after drone strikes in Iraqi Kurdistan raised supply concerns.
Gold edged lower as bond yields rose, and the dollar strengthened.
The S&P 500 and Nasdaq hit record highs on strong AI-related earnings.
Tesla and other major tech stocks fell despite solid results, reflecting “sell-the-news” reactions.
Global markets paused after trade-driven gains as inflation data and central bank updates approached.
Asia and the week ahead
Asian markets were mixed, with gains in Hong Kong and Shanghai and losses in Tokyo.
This week’s earnings reports include Alphabet, Tesla, and Microsoft.
Wednesday will bring US CPI and PPI data, ECB minutes, and BOJ remarks.
Friday will deliver Japan’s election results, OPEC+ developments, and tariff decisions.
Political risk from Japan and AI-related investigations led by BRICS may shift sentiment midweek.
MARKET MOVERS
Nasdaq 100
Technical breakout: Nasdaq continues to rally and is approaching the 23,300–23,350 resistance zone. A confirmed close above this range would signal a breakout continuation, while failure to hold may trigger short-term profit-taking.
Target projection (bullish): A breakout above 23,350 opens the path to 23,600–23,700, with potential to extend to 24,000–24,200 by August, supported by bullish analyst forecasts pointing to 25,000+ by year-end.
Target projection (bearish): A break below 23,000 may lead to further downside towards 22,800–22,700, reflecting fading momentum and speculative unwind.
Opening expectation: Nasdaq futures indicate a bullish open near 23,250–23,320, driven by strong Q2 earnings (notably from Alphabet/AI), dovish Fed signals, and renewed trade optimism.
Primary support zone: 23,100–23,150 (20-day moving average and pivot cluster).
Secondary support zone: 23,000 (psychological support).
Tertiary support zone: 22,800–22,700 (retracement zone if sentiment deteriorates).
Strategy (bullish approach): Buy on a confirmed breakout above 23,350 with targets at 23,600 and 24,200.
Strategy (bearish approach): Short below 23,000 with targets at 22,800 and 22,700.
Stop-loss level: Below 23,100 for bullish positions; above 23,400 for bearish positions.
Key catalysts this week: US CPI and PPI data, ECB minutes, BOJ remarks, tariff decisions, and earnings updates from Apple, Microsoft, Alphabet, and Tesla.
Market context: Nasdaq is at a critical technical juncture. Momentum remains strong, with over 60 consecutive sessions above the 20-day MA – the longest since 1999. However, signs of overbought conditions and speculative excess suggest traders should use tight stops and remain alert to whipsaw risks.
Nikkei 225
Technical breakout: Nikkei is breaking out of a bullish flag pattern, with momentum building above 40,300. A confirmed close above 40,620 would signal breakout continuation, while failure to hold above trend support may trigger a deeper retracement.
Target projection (bullish): A sustained move above 40,620 opens the path to 42,500–42,900, supported by strong earnings, softening JGB yields, and improving economic surprise indices.
Target projection (bearish): A breakdown below 39,000 could extend losses to 38,000–37,700, aligned with Fibonacci retracement levels from the May–July rally.
Opening expectation: Nikkei is set to open around 40,300–40,400, reflecting positive sentiment following the July election and upbeat Japanese earnings.
Primary support zone: 39,000–39,100 (main trendline and May low).
Secondary support zone: 38,500–38,600 (retracement area).
Tertiary support zone: 38,000–37,700 (deeper correction zone if sentiment weakens).
Strategy (bullish approach): Buy on a confirmed breakout above 40,620 with targets at 42,500 and 42,900.
Strategy (bearish approach): Short below 39,000 with targets at 38,500 and 37,700.
Stop-loss level: Below 39,000 for bullish positions; above 40,300 for bearish positions.
Key catalysts this week: Japan’s upper-house election outcome, long-term JGB yield volatility (30-year above 3.2%), and continued strength in Citigroup’s Economic Surprise Index and earnings revision momentum.
Market context: The Nikkei is in a medium-term uptrend, supported by strong fundamentals and a bullish technical structure. However, rising yields and political uncertainty post-election may introduce volatility. Traders should manage positions with disciplined stops and watch for confirmation above key resistance.
DAX 40
Technical breakout: DAX is trading above the key pivot at 24,483.70, suggesting continued upside towards the 24,852.67 resistance level. Holding above 23,945.50–24,000 keeps the uptrend intact, while a drop below 23,945.50 – especially towards 23,701.36 – may signal weakening momentum and a deeper retracement risk.
Target projection (bullish): A breakout above 24,852–24,900 opens the path to 25,000–25,500, supported by Germany’s fiscal stimulus and strength in the defence and tech sectors.
Target projection (bearish): A drop below 23,701.36 may extend losses to 23,300–23,000 if price action breaks beneath the key pivot zone.
Opening expectation: DAX is expected to open around 24,300–24,400, driven by broad global equity strength and positive sentiment from Germany’s fiscal support measures.
Primary support zone: 24,483.70 pivot and the 127.2% Fibonacci cluster near 23,945–24,000.
Secondary support zone: 23,701.36, a major swing low and technical overlap level.
Tertiary support zone: Around 23,300, representing the deeper retracement zone and failure point for the bullish structure.
Strategy (bullish approach): Buy above 24,483.70 with targets at 24,900 and 25,500. Use a stop-loss below 23,940 to protect against pivot failure.
Strategy (bearish approach): Short below 23,700 with targets at 23,300 and 23,000. Use a stop-loss above 24,850 to avoid upside reversal.
Range strategy: Fade within 23,945–24,850 until a breakout confirms. Buy near the lower bound, sell near the upper bound, with tight stop-losses.
Key catalysts this week: Germany’s €500 billion stimulus plan boosting sentiment in domestic demand, defence, energy, and tech sectors. ECB policy commentary and global trade headlines ahead of August rate guidance. Earnings from SAP and other German corporates may drive index momentum.
Market context: Germany’s fiscal stimulus is driving bullish sentiment across sectors like defence, technology, and banking. Stocks such as Rheinmetall, Siemens Energy, and Commerzbank have outperformed in 2025. Despite global headwinds, sustained capital inflows into DAX-listed exporters continue to position the index as a top global performer this year.
NEWS HEADLINES
Global policy and political shifts
Japan’s upper house vote this Friday could reshape fiscal policy, yen sentiment, and the Bank of Japan’s communication.
The ECB kept rates unchanged and warned of growing global trade risks, reinforcing a cautious stance.
The BRICS summit ended with a joint call for global AI regulation and stronger South–South economic cooperation.
The US–Japan tariff deal may offer relief, but Trump’s 1 August tariff deadline still poses risks for broader markets.
Prime Minister Starmer is lobbying Trump to lift US tariffs on UK exports, including steel and Scotch whisky.
Currency movements and central bank focus
The US dollar held steady following the ECB rate decision, with attention now turning to upcoming Fed and BOJ meetings.
The Japanese yen remains volatile ahead of election results and policy signals from the BOJ.
Valeo cut its sales forecast, citing a €750 million forex hit tied to trade tensions and dollar strength.
Market trends and sector developments
Oil prices rose after drone strikes in Iraqi Kurdistan reignited global supply concerns.
Copper futures hit record highs as traders anticipated US tariffs starting on 1 August.
Gold declined as rising bond yields, and a stronger dollar reduced safe-haven demand.
HSBC outlined five risks to the US equity rally, including rising yields, AI fatigue, and doubts about Fed credibility.
US equities showed post-earnings fatigue, with stocks like Netflix and Tesla leading late-session declines.
Asian stocks retreated slightly as investors reduced risk exposure ahead of tariffs and central bank meetings.
Tokyo’s Nikkei cooled after recent gains, while broader regional sentiment held firm.
Tokyo’s core CPI reached 2.9% in July, increasing pressure on the BOJ to revise its inflation outlook.
Please note that the dividends of the following products will be adjusted accordingly. Index dividends will be executed separately through a balance statement directly to your trading account, and the comment will be in the following format “Div & Product Name & Net Volume”.
Please refer to the table below for more details:
The above data is for reference only, please refer to the MT4/MT5 software for specific data.
If you’d like more information, please don’t hesitate to contact info@vtmarkets.com.
The average directional index (ADX) is a widely used technical indicator that helps traders assess the strength of a trend. It doesn’t indicate whether the market is moving up or down—instead, it shows how strongly it’s moving in either direction. By providing a clear numerical value to gauge momentum, the ADX indicator allows traders to identify trending conditions, avoid range-bound markets, and make more informed decisions across various asset classes. In this article, we’ll explain what ADX is, how it works, how to use it effectively, and how to avoid common pitfalls.
What Is Average Directional Index (ADX)?
In trading, knowing the direction of a market is only half the battle. The real challenge is understanding how strong that trend is—whether it has the momentum to continue or is likely to fade. That’s where the average directional index (ADX) comes into play. Developed by J. Welles Wilder, the average directional index indicator is a technical analysis tool used by traders to measure the strength of a price trend, regardless of whether it’s moving upward or downward.
Technical analysis is a broad suite of tools and strategies that traders use to evaluate market trends and make informed trading decisions. The ADX indicator fits within this suite as a key technical analysis tool, often used alongside other indicators to improve accuracy and develop effective trading strategies. The ADX indicator assigns a numerical value that quantifies trend strength, ranging from 0 to 100. This helps traders determine if the market is trending strongly enough to justify entering a position or if it’s better to stay out during flat or choppy conditions. By focusing on strength rather than direction, ADX acts as a powerful filter, helping traders reduce noise and avoid weak or false trading signals.
How Does the ADX Indicator Work?
The ADX indicator is part of the Directional Movement System, which also includes the Positive Directional Indicator (+DI) and Negative Directional Indicator (−DI). While +DI and −DI measure the direction of movement, ADX focuses solely on the strength of the trend.
The ADX itself is plotted as a single line ranging from 0 to 100. ADX readings below 20 suggest a weak trend, while readings above 25 typically signal a trending market with increasing strength. Traders use these ADX readings to interpret whether the market is consolidating or trending, and to gauge the strength of the current move. The higher the value, the stronger the trend—whether it’s bullish or bearish.
For example, during the 2022 U.S. interest rate hike cycle, the EUR/USD showed an ADX value rising above 40. This confirmed a strong downtrend as the dollar strengthened rapidly. When the ADX peaks and starts to decline, it often signals that trend momentum is weakening. This change in ADX readings can indicate a potential trend reversal or a period of consolidation, alerting traders to possible changes in market direction.
Average Directional Index Calculation
The formula for the average directional index (ADX) is derived from the difference between the Positive Directional Indicator (+DI) and the Negative Directional Indicator (−DI) over a specific period—typically 14 periods. While most trading platforms like VT Markets’ MetaTrader 4 (MT4) and MetaTrader 5 (MT5) calculate the ADX automatically, understanding how it’s computed can help traders verify its signals and use it more effectively.
Here’s a clearer breakdown of the ADX calculation:
1. Calculate True Range (TR)
This measures market volatility and is the foundation for the average true range (ATR). The ATR is used to normalize directional movement and smooth the data, making it a key part of the ADX calculation.
+DM = Current High − Previous High (only if it’s positive and greater than −DM, otherwise 0)
−DM = Previous Low − Current Low (only if it’s positive and greater than +DM, otherwise 0)
Here, −DM represents negative directional movement, which helps identify downtrends. The calculation of +DM and −DM also involves comparing high and low prices to determine the direction and magnitude of price changes.
The period used for these calculations is typically 14, but traders can adjust the period or use different periods to tailor the indicator’s responsiveness to price movements. Price range expansion is a key factor in the ADX’s ability to measure trend strength, as the indicator evaluates changes in the price range over the selected period.
Example: Calculating ADX on EUR/USD
Let’s say a trader is monitoring EUR/USD and the 14-day smoothed values are as follows, demonstrating typical ADX calculations in practice:
This ADX value of 18.14 would suggest that the trend is still relatively weak. If the ADX crosses above 25 in the next few sessions, it may confirm the emergence of a stronger directional trend.
How to Use the Average Directional Index
Understanding how to use average directional index values is key to making confident, well-timed trading decisions. The average directional index helps traders determine whether the market is trending and how strong that trend is. Importantly, it does not indicate trend direction—only strength. The table below shows a quick guide on interpreting ADX readings:
ADX Value
Trend Strength
Interpretation
Below 20
No trend / weak trend
The market is likely range-bound or lacking momentum. Avoid trend-based strategies.
20 – 25
Emerging trend
A trend may be forming. Watch closely for confirmation before entering trades.
Above 25
Strong trend
A clear trend is in place. Consider trend-following strategies.
Above 50
Very strong trend
Trend is highly established. Often occurs during breakouts or major news events.
Let’s say a trader is monitoring the Nasdaq 100. If the ADX line crosses above 25 while the +DI is above the −DI, this could generate a buy signal and indicate a strong bullish trend. Conversely, if −DI is above +DI, a sell signal may be present, suggesting a strong bearish trend. Either way, ADX readings above 25 confirm that the trend has sufficient strength for potential trading opportunities and help traders determine entry and exit points.
Many traders also watch for ADX turning points—for example, when the ADX line peaks and starts to decline (a falling ADX line), it may signal trend weakness or a weakening trend, even if price movement continues in the same direction. Recognizing trend weakness is important for managing exit points and avoiding false breakouts.
To enhance accuracy, traders often pair ADX with other technical indicators and technical analysis tools such as the momentum indicator RSI, moving average convergence divergence (MACD), or Bollinger Bands to confirm entries or exits. For example, combining an ADX reading above 25 with an RSI above 50 may strengthen the case for a bullish entry on a trending asset like GBP/USD. Using multiple technical indicators helps filter out more false signals and provides a more comprehensive view of price movements and trend momentum.
Why Traders Use the ADX Indicator
The average directional index indicator offers traders an objective measure of trend strength, making it an essential tool for both novice and experienced traders. Here’s why it is commonly used across different trading strategies:
1. Trend Confirmation
ADX helps confirm whether a market is trending or range-bound. An ADX above 25 suggests a tradable trend, while values below 20 indicate weak or sideways conditions.
2. Entry Timing
Instead of entering too early, traders use ADX to wait for confirmation. For example, after a breakout, they may wait until ADX rises above 25 before committing to a position.
3. Exit Strategy
A falling ADX can signal that an existing trend is losing momentum. This helps traders decide when to scale out, adjust stop-losses, or lock in profits.
4. Strategy Filter
ADX is often paired with indicators like RSI or Moving Averages. If RSI signals bullish momentum and ADX is above 25, traders gain added confidence in the trade setup.
Risks and Limitations of the ADX Indicator
While the ADX indicator is useful, it’s important to understand its limitations:
1. Lagging Signals
Since ADX uses historical price data, it reacts slowly. By the time it confirms a trend, part of the move may have already happened.
2. No Directional Clarity
ADX measures strength, not direction. Traders must rely on +DI and −DI lines—or other tools—to identify whether the trend is bullish or bearish.
3. Limited Use in Sideways Markets
In flat or low-volume markets, ADX may give weak or misleading signals. It performs best in clearly trending conditions.
4. False Signals During High Volatility Events
During major news releases or sudden spikes in volatility, ADX can produce misleading readings, temporarily inflating trend strength even if no sustained trend follows.
Common Mistakes to Avoid When Using the ADX Indicator
While the ADX indicator is a reliable tool, it can be misused if applied without context or supporting signals. Here are common pitfalls to avoid:
Ignoring Directional Lines (+DI and −DI): ADX shows trend strength, not direction. Relying on ADX alone without checking whether +DI or −DI is dominant can lead to poor entry decisions.
Solely Relying on ADX Without Confirmation: Traders who use ADX in isolation often miss important price context. ADX should be part of a broader strategy that includes price action, support/resistance, or additional indicators.
Using the Same ADX Setting for All Timeframes: Many traders apply the default 14-period setting across every chart. However, shorter timeframes may require faster settings to reflect quicker price action.
Overlooking ADX Slope and Momentum: A high ADX value above 25 may seem strong, but if the line is sloping downward, it may signal weakening momentum. Watching the slope helps confirm strength and durability.
Entering Too Late Based on ADX Alone: Waiting for ADX to reach high levels (like 40 or 50) can delay entries. Often, the most profitable part of the trend may have already passed.
Misreading Spikes During High Volatility Events: During news releases or large candles, ADX can temporarily spike, giving a false sense of trend strength even if the price soon reverses.
In Summary
The average directional index (ADX) is a valuable tool for measuring trend strength and improving trading decisions. By identifying whether a market is trending or consolidating, ADX helps traders apply the right strategy at the right time. When paired with directional indicators (+DI and −DI) and supported by other tools like RSI or moving averages, the ADX indicator becomes even more reliable. However, it’s important not to rely on ADX alone. Understanding its signals, limitations, and how it fits within a broader strategy can lead to more consistent and informed trades.
Whether you’re back-testing with the VT Markets demo account or trading live with competitive spreads, VT Markets provides the flexibility and performance traders need. If you’re new to the ADX indicator or want to refine your approach, our Help Centre is available 24/7 with clear guides, tutorials, and platform support.
The average directional index (ADX) is a technical indicator used to measure the strength of a price trend. It ranges from 0 to 100, where higher values indicate stronger trends. ADX does not show trend direction, only its strength.
2. What is the average directional index used for?
It’s used to measure the strength of a trend, helping traders identify whether the market is trending strongly or lacking momentum.
3. How to use the average directional index (ADX)?
Traders use ADX to confirm if the market is trending. A value above 25 generally signals a strong trend, while values below 20 suggest sideways movement. ADX is best used with other tools like +DI/−DI lines or RSI for confirmation.
4. How to calculate the average directional index (ADX)?
ADX is calculated by smoothing the difference between +DI and −DI over a chosen period (typically 14). It involves steps like computing True Range (TR), +DM/−DM, and Directional Index (DX), followed by smoothing DX values. Most platforms calculate it automatically.
5. Can I use the ADX on any asset class?
Yes, it works on forex, stocks, indices, precious metals, and even cryptocurrencies. ADX is a flexible indicator that adapts well across different markets.
6. What is a good ADX value for trend confirmation?
Generally, a reading above 25 suggests a strong trend. Values below 20 indicate weak or sideways conditions.
7. Does the ADX predict trend direction?
No. ADX only measures the strength of a trend. To determine direction, use the accompanying +DI and −DI lines or other trend indicators.
8. Should I use ADX alone or with other indicators?
ADX is most effective when used with other tools. For example, combining ADX with RSI can confirm both trend strength and momentum, improving trade accuracy.
July 28, 2025 , Sydney, Australia –VT Markets is using the ‘power of football’ to make a positive impact in communities across Asia, supported by a partnership with Premier League club Newcastle United.
Celebrating its 10th anniversary, VT Markets committed to donating 1,000 Newcastle United branded footballs to schools across Southeast Asia. The initiative aims to deepen the brand’s presence in Asia while creating opportunities for future generations to enjoy the sport.
Additionally, VT Markets proudly donated £20,000 to the Newcastle United Foundation, commemorating the club’s Carabao Cup victory and return to the UEFA Champions League. This contribution celebrates the club’s incredible achievement while supporting its official charity partner’s mission to harness the unifying power of football to connect, motivate, and inspire people through community, education, health, and sports programmes.
VT Markets’ Corporate Social Responsibility initiatives have been designed to champion growth through strategic partnerships and investments, with the aim of expanding the brand’s footprint in Asia, while helping to nurture economic development in the region. By driving growth through impactful collaborations, VT Markets is not only deepening its regional presence but also helping to build a stronger, more resilient future for these communities. With plans already underway to bring similar initiatives to Latin America, the brand is looking to replicate this positive impact across even more global markets.
As Newcastle United’s Official Financial Trading Partner, first-team players including Sandro Tonali, Jacob Murphy, Dan Burn, and William Osula, kicked off the initiatives during an exclusive Meet and Greet session hosted by VT Markets. Also in attendance was club legend Shola Ameobi, who brought his trademark charisma to connect with fans at the event. The Magpies were based in Singapore ahead of their first fixture in the nation since 1996, taking on fellow Premier League side Arsenal as part of the Singapore Festival of Football.
Speaking as the CSR initiatives were launched at an exclusive client engagement event in Singapore, hosted by VT Markets, Newcastle United player and Newcastle United Foundation ambassador Dan Burn shared: “Our fans are the soul of this club, wherever we go in the world. The support we’ve felt from everyone in Singapore has been unbelievable and that’s a big reason why projects like this mean so much.
“As players, football has helped to transform our lives so it’s really special to see VT Markets use their position to support young people and give back to these amazing communities – both in Newcastle and across Asia. We see the fantastic work that Newcastle United Foundation do back home and this donation will make a great contribution to changing their lives of many people in our community.”
VT Markets recently marked a thrilling debut year as Official Financial Trading Partner of Newcastle United by visiting St. James’ Park for the final match of the 2024/25 Premier League season. A history-making campaign saw Eddie Howe’s side win the club’s first domestic trophy in 70 years, which was quickly followed up with qualification for the UEFA Champions League.
This year also coincides with a significant milestone for VT Markets, celebrating a decade of innovation in the global financial markets. Over the past 10 years, the company has driven growth through collaborations, expanding its presence and making a lasting impact within the industry by helping to build a stronger, more resilient future.
“At VT Markets, we believe that true growth goes beyond numbers. Through our CSR initiatives, we aim to inspire, empower, and contribute meaningfully to the region’s development, laying the foundation for long-term opportunity and success. Our partnership with Newcastle United is about driving positive change both on and off the field, and we look forward to deepening our impact as we continue this exciting journey in Asia together,” Dandelyn Koh, Global Brand and PR Lead at VT Markets shared.
As Newcastle United prepare for a return to the UEFA Champions League, VT Markets remains a steadfast partner, supporting ambitions on the pitch while helping to drive positive social change off the pitch. The event in Singapore served as an opportunity to highlight shared values and the vision of both organisations, centred around growth, community, and giving back.
For media enquiries and sponsorship opportunities, please email media@vtmarkets.com, or contact:


 | VT Markets")

 | VT Markets")

 | VT Markets")


