As August begins, markets face key events that could shift risk sentiment — from new US tariffs and central bank moves to trade shifts and supply concerns. With slowing momentum and diverging inflation trends, this week may prove pivotal for FX, equity, and energy markets.
KEY INDICATORS
Market moves: FX, equities, and commodities
Sterling fell to a 10-week low (~$1.3316) after a US–EU trade deal lifted the dollar.
Oil prices rose in early August on tightening OPEC+ supply and strong demand forecasts.
Copper hit a record high as new US tariffs (10–41%) on imports took effect on 1 August.
Gold fell as rising bond yields, and a strong dollar reduced safe-haven demand.
Global equity momentum slowed, with the MSCI ACWI stalling after four weekly declines.
HSBC warned of risks to the US equity rally, citing high yields, inflation, and valuation fatigue.
Asian equity markets closed mixed as investors awaited US trade and central bank signals.
Central banks: diverging paths and cautious shifts
Markets expect the Bank of England to cut rates by 25 bps on 7 August as inflation hits 3.6%.
The ECB likely ended its easing cycle, while the Fed held rates with internal dissent.
The Reserve Bank of Australia delayed further cuts but faces pressure to act in August.
South Africa’s central bank held rates, reflecting mixed signals on inflation and growth.
The Bank of Japan signalled possible tightening later in 2025 amid wage and price growth.
Global policy and trade tensions
The US imposed new tariffs on copper and other imports from 69 countries starting 1 August.
Global trade tensions intensified as reciprocal tariff measures were announced.
Australian policymakers face renewed pressure as markets forecast a 3.60% cash rate by mid-2026.
Political uncertainty and tariff risks remain key drivers of volatility across regions.
MARKET MOVERS
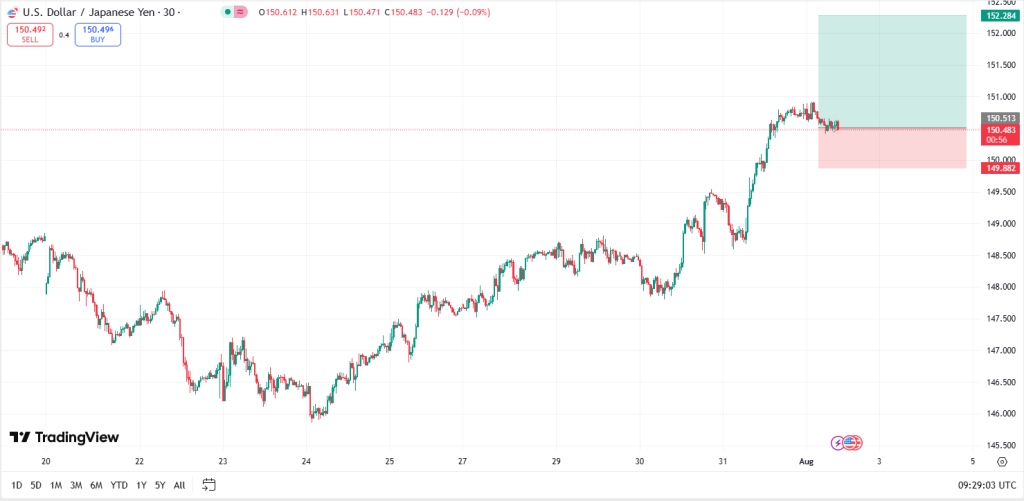
USD/JPY
Technical breakout: USD/JPY has cleared the 149.17–149.20 resistance zone and moved above the 55-day EMA (~145.90), reinforcing the bullish trend. A confirmed close above 151.22 (61.8% Fibonacci) would signal further upside momentum, while failure to hold above 147.50 may prompt consolidation.
Target projection (bullish): A breakout above 151.22 opens the path to 156.50–156.80, with long-term projections suggesting potential extension beyond 157.00.
Target projection (bearish): A break below 147.50 may lead to a pullback towards 145.35, with broader downside risk if key supports fail.
Opening expectation: USD/JPY is expected to open near 150.50–150.60, supported by BoJ policy tone and strong US macro data reinforcing Fed rate resilience.
Primary support zone: 149.75–149.50 (short-term pivot and channel base).
Secondary support zone: 147.50–147.80 (key corrective area and 55-day EMA).
Tertiary support zone: 145.35 (major trigger level that would invalidate the broader bullish structure).
Strategy (bullish approach): Buy on confirmed breakout above 151.22 with targets at 156.50 and 156.80+.
Strategy (bearish approach): Short on break below 147.50 with targets at 145.35 and 144.00.
Stop-loss level: Below 149.40 for bullish positions; above 151.50 for bearish setups.
Key catalysts this week: US jobs report (NFP), Fed commentary, BoJ policy remarks, and developments around global tariffs.
Market context: USD/JPY remains in a strong uptrend, but August seasonality often favours yen strength. Traders should manage risk carefully, as upcoming macro events may trigger volatility and short-term reversals.
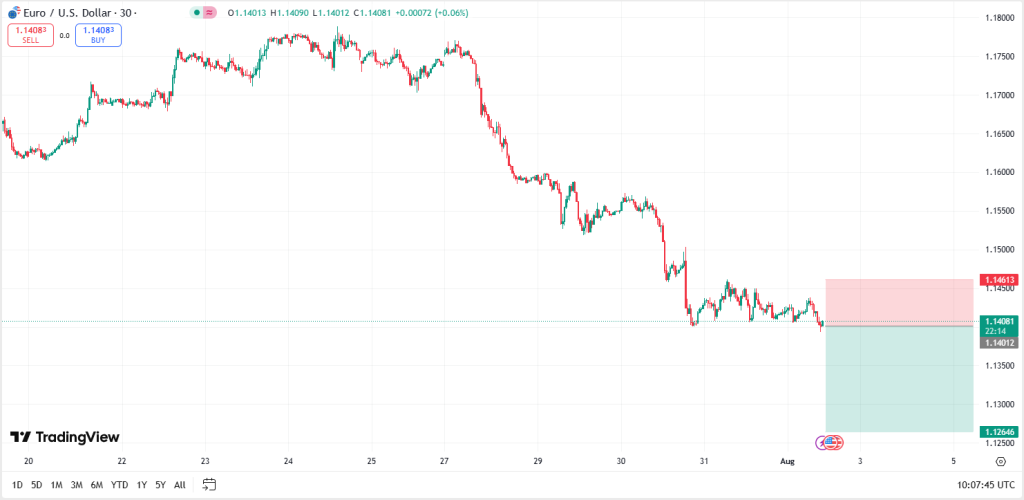
EUR/USD
Technical breakout: EUR/USD has broken below the 1.1500 level and remains under the 50-day EMA (~1.155), confirming bearish momentum. Reclaiming the 1.1550–1.1598 zone is needed to neutralise the bias, while a sustained drop below 1.1380 would confirm further downside.
Target projection (bearish): A move towards 1.1380–1.1400 is expected near term. A break below this opens the path to 1.1266 and potentially 1.1180, aligned with the 38.2% Fibonacci retracement of the rally from 1.0176 to 1.1829.
Target projection (bullish): A recovery above 1.1550 could lead to gains towards 1.1600–1.1650, with potential extension to 1.1788–1.1829 if sentiment shifts strongly.
Opening expectation: EUR/USD is likely to open around 1.1420–1.1440, continuing the bearish pressure seen in late July.
Primary support zone: 1.1380–1.1400 (key pivot level).
Secondary support zone: 1.1266 (Fibonacci retracement).
Tertiary support zone: 1.1180 (long-term structural support).
Strategy (bearish approach): Short below 1.1520 targeting 1.1380, 1.1266, and possibly 1.1180.
Range play: Trade between 1.1380 and 1.1550 by buying near support and selling near resistance, using tight stops.
Stop-loss levels: Above 1.1520 for bearish positions; below 1.1490 for bullish setups.
Key catalysts this week: US non-farm payrolls and unemployment data, Eurozone PMIs and inflation figures, trade deal developments, and ongoing macroeconomic trends impacting USD and EUR sentiment.
Market context: EUR/USD remains pressured amid broad USD strength driven by trade deals and macro data. Euro bulls face headwinds from position unwinding, but key technical levels may offer short-term trading opportunities.
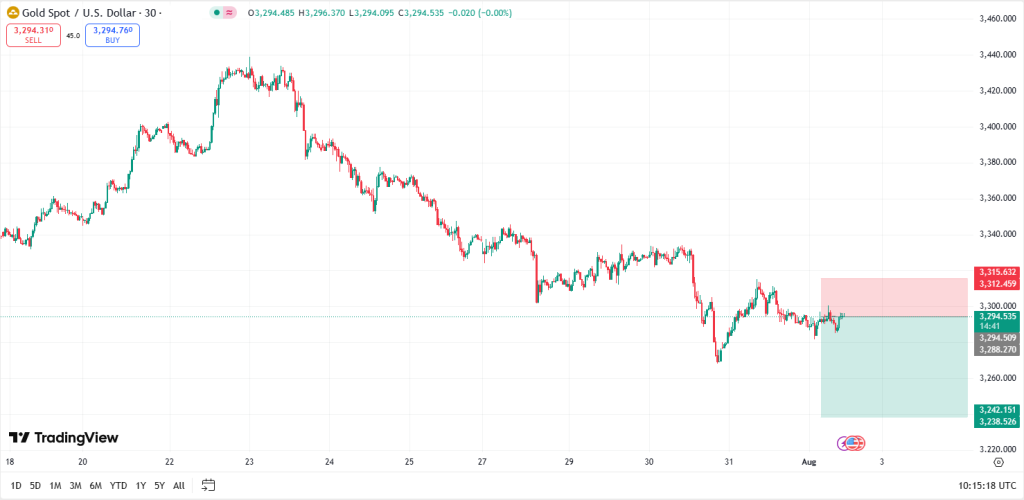
XAU/USD
Technical breakout: Gold remains under pressure below the key $2,380 resistance level, failing to reclaim its short-term trendline. The technical bias stays bearish unless the price closes decisively above $2,400. A breakdown below $2,320 would confirm bearish continuation.
Target projection (bearish): A move below $2,320 exposes support at $2,300, followed by $2,275. If selling accelerates, a deeper target near $2,240 becomes likely.
Target projection (bullish): A rebound above $2,380 could retest $2,400. A breakout beyond $2,410 may pave the way towards $2,435–$2,450, requiring strong macro support such as falling yields or geopolitical tensions.
Opening expectation: Gold is expected to open around $2,340–$2,345, continuing recent range-bound behaviour under pressure from a firm dollar and rising US bond yields.
Primary support zone: $2,320 (short-term pivot).
Secondary support zone: $2,300 (prior swing low).
Tertiary support zone: $2,275–$2,240 (deeper support based on trendline extensions).
Strategy (bearish approach): Sell on a break below $2,320 with targets at $2,300, $2,275, and $2,240; stop-loss above $2,385–$2,390.
Strategy (bullish approach): Buy on a rebound above $2,380 targeting $2,400 and $2,435; stop-loss below $2,310 to manage risk.
Range play: Trade within $2,320–$2,380 by buying dips near support and selling rallies near resistance with tight stops.
Key catalysts this week: US non-farm payrolls and bond market direction will heavily influence gold via real yields. Continued dollar strength and expectations of the Fed staying on hold are bearish. Geopolitical shocks or dovish surprises from central banks could reverse sentiment quickly.
Market context: Gold remains pressured by a strong dollar and rising yields, but geopolitical risks and central bank policies may create volatility. Traders should apply disciplined risk management.
NEWS HEADLINES
Geopolitics and trade risks
IMF warns that global trade tensions and inflation remain major threats despite a slight upward revision in growth forecasts.
The US imposes new tariffs of 10% to 41% on imports from Canada, India, Switzerland, and Taiwan, effective 1 August.
US Senator Roger Wicker plans a visit to Taiwan, increasing tensions between Washington and Beijing.
Iran threatens to close the Strait of Hormuz, raising fears of global oil supply disruptions.
Currency and macroeconomic shifts
The US dollar strengthens after new trade deals with the EU and Japan reduce tariff-related uncertainty.
India faces pressure as new US tariffs highlight both its vulnerability and strategic role in global supply chains.
Emerging market currencies weaken as risk-on flows favour the stronger dollar.
The Bank of Japan signals a tightening bias as inflation nears 2.9%, prompting policy shift speculation.
Commodities and global markets
Oil prices remain range-bound as geopolitical risks are offset by OPEC+ supply increases.
Gold declines under pressure from rising US bond yields and a firmer dollar.
Global equities retreat as investors react to new US tariffs and overvalued market conditions.
HSBC warns that high yields, slowing tech momentum, and Fed credibility issues could stall the US stock rally.
Asian stocks fall across Japan, China, and Taiwan as tariff fears hit sentiment before earnings season.
The euro is steadying as markets assess recent trade developments and shifting sentiment. With momentum uncertain, traders are watching technical signals and central bank cues. This analysis explores what’s next for EUR/USD.
Euro steadies after recent pressure
The euro edged higher on Thursday, rising 0.1% to reach $1.1429. However, the common currency continues to trade below the psychologically significant $1.15 barrier.
This modest recovery in EUR/USD comes after recent downward pressure, driven by growing concerns that the current US-EU trade agreement may be skewed in favour of Washington, potentially disadvantaging the eurozone.
As US President Donald Trump's new tariff regime clicks into gear, producers around Europe are feeling the impact, some holding back shipments, others hiking sticker prices or taking a hit to margins. Some fear they won't survive at all https://t.co/R5sCj0XEQf
According to our market analysts, the recent softness in the euro may be part of a natural correction after an extended period of bullish positioning.
This implies that although short-term pressure could persist, the downside may be limited as traders revisit the broader economic fundamentals.
Technical analysis
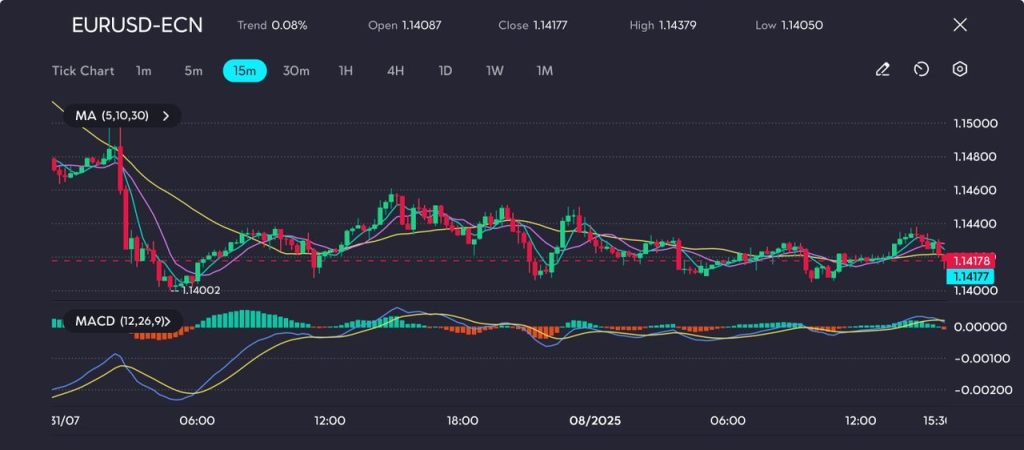
EUR/USD opened around 1.14087 and dipped to a session low of 1.14002 in early trading on 31 July, before staging a minor recovery to touch 1.1437.
Since then, the currency pair has been moving within a narrow range between 1.1400 and 1.1440, showing no strong directional bias.
Picture: EURUSD holds above 1.1400 after bounce, but momentum lacks strength, as seen on the VT Markets app.
The moving averages (5, 10, 30) paint a mixed technical picture. While the price remains marginally above the shorter-term MAs, the flattening slopes indicate fading momentum.
The 30-period moving average has acted as dynamic resistance later in the session, effectively capping any attempts to push higher.
The MACD indicator also signals indecision, hovering near the zero line with minimal divergence.
Although the histogram has turned slightly positive, both the MACD and signal lines are flat and tightly aligned, suggesting a lack of conviction among traders and low volatility.
Support is established around the 1.1400 level, a key psychological and technical floor. Resistance lies near 1.1440 and 1.1460. A clear break above this zone could pave the way for a test of the $1.1500 level, although this would likely depend on fresh macroeconomic catalysts or shifts in US dollar sentiment.
Cautious forecast
In the short term, EUR/USD is likely to remain range-bound between 1.1400 and 1.1450, unless driven by unexpected economic data or policy surprises.
Low volatility and uncertain momentum suggest that traders are staying cautious and awaiting clearer signals.
A break below 1.1400 could open the door to 1.1350, particularly if US data beats expectations or risk sentiment weakens.
On the upside, resistance around 1.1440–1.1460 remains intact. A sustained move higher would need to overcome this zone to target the key 1.1500 level – though this would likely require softer USD data, dovish Fed signals, or stronger eurozone figures.
Looking ahead, the medium-term outlook depends on how markets interpret the US-EU trade deal and future guidance from the ECB.
As policymakers weigh inflation against weak growth, sudden shifts in expectations could trigger volatility.
For now, traders may remain on the sidelines, watching macro trends and central bank commentary for direction.
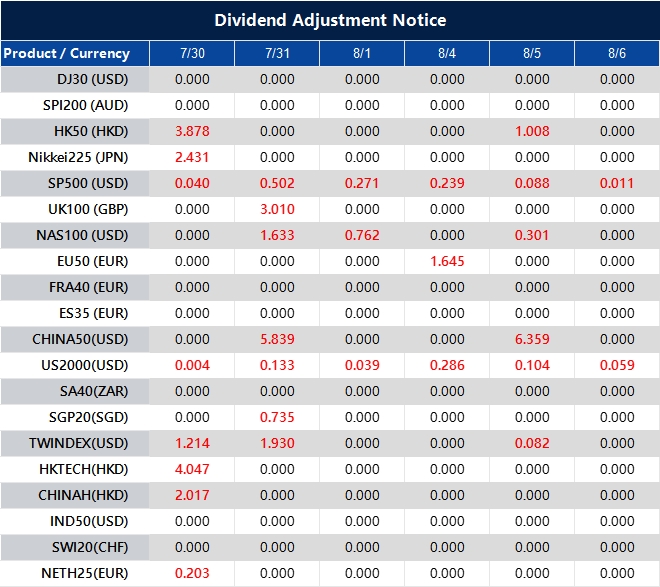
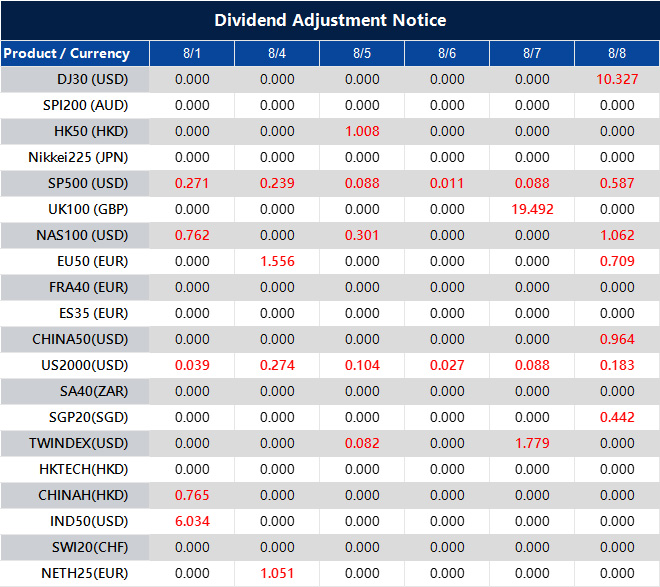
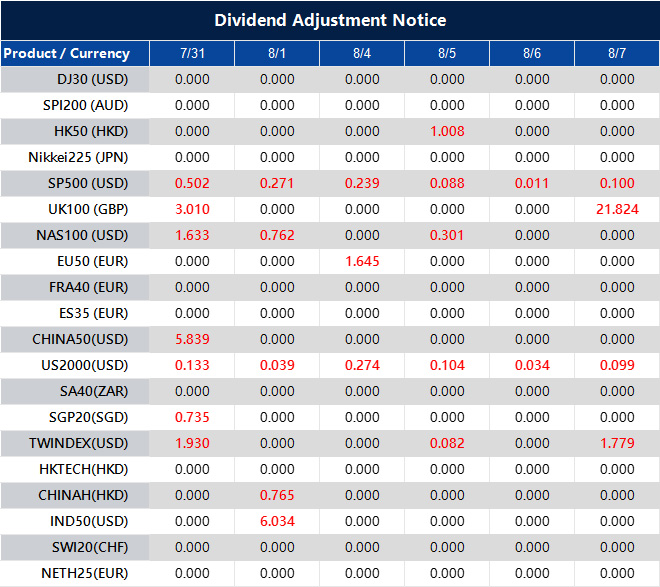
Please note that the dividends of the following products will be adjusted accordingly. Index dividends will be executed separately through a balance statement directly to your trading account, and the comment will be in the following format “Div & Product Name & Net Volume”.
Please refer to the table below for more details:
The above data is for reference only, please refer to the MT4/MT5 software for specific data.
If you’d like more information, please don’t hesitate to contact info@vtmarkets.com.
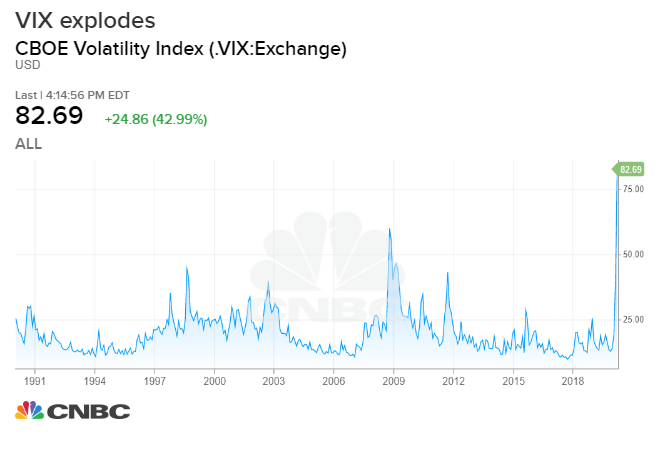
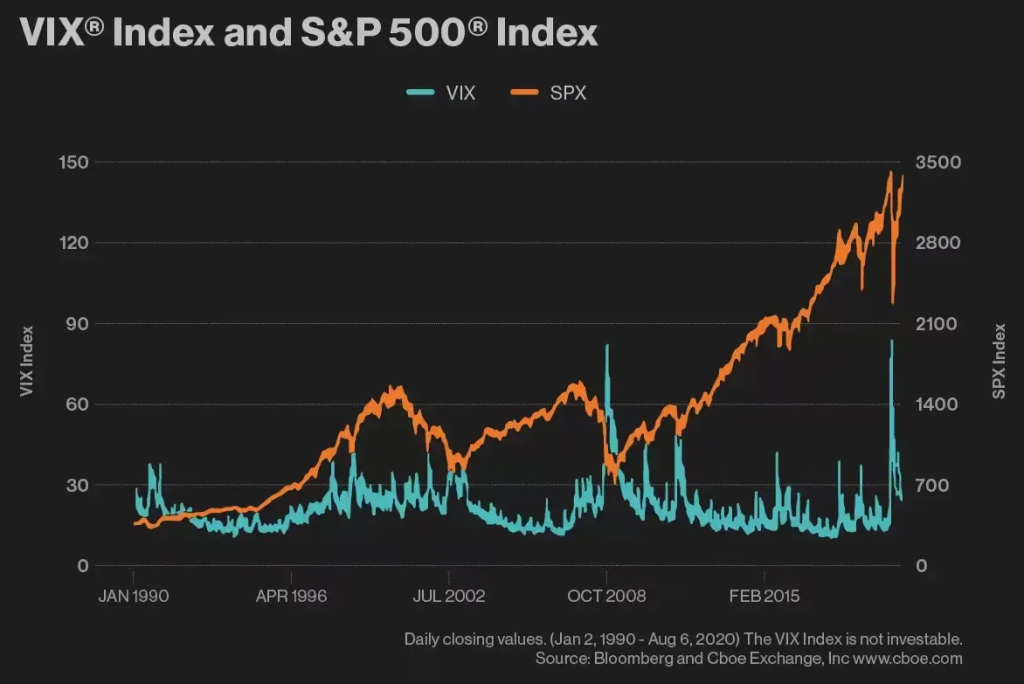
When markets appear calm on the surface, tension often builds underneath, and the VIX is usually the first to signal it. This week, the so-called “Fear Index” jumped 6% from near its yearly lows, even as the headlines remained quiet.
For traders who know how to read it, the VIX can act as an early warning – a chance to prepare before the storm hits.
The Cboe Volatility Index (VIX) doesn’t predict market direction, it measures expected volatility. Often called the “Fear Index,” it reflects how nervous or confident traders are about the next 30 days.
Whether you trade stocks, forex, or indices, understanding what the VIX is signalling can help you anticipate shifts, manage risk, and stay one step ahead.
How the VIX works
The VIX, created by the Chicago Board Options Exchange (Cboe) in 1993, measures implied volatility – that is, how much market participants expect the S&P 500 to move over the next 30 days.
It is calculated from the prices of near-term S&P 500 options. When traders anticipate turbulence, they pay more for options, which drives up implied volatility and, in turn, the VIX.
Unlike actual price movements, the VIX reflects expectations, not reality. Think of it as a sentiment gauge: high VIX readings mean investors expect bigger price swings, while low readings suggest confidence and calm.
For example, a VIX level of 20 implies that traders expect the S&P 500 to move roughly 5.77% over the next month (since volatility is annualised, you divide by the square root of 12).
What a rising or falling VIX means
The VIX rises when uncertainty, fear, or negative sentiment dominate the market. It often spikes during financial crises, geopolitical shocks, or unexpected data releases.
Historically, levels above 30 have been associated with panic; levels below 15 usually point to complacency.
In March 2020, at the height of the COVID-19 panic, the VIX shot above 80 – a historic high.
More recently, the VIX jumped 6% in a single day amid quiet news flow, hinting at anxiety ahead of earnings and key economic data. Such moves can foreshadow volatility before it becomes visible in price action.
Conversely, when the VIX falls, it often indicates stabilising conditions and investor confidence. But a very low VIX may also suggest traders are underestimating risk.
How to use the VIX in trading
The VIX is not just a background number – it can be a powerful addition to your strategy. Here are some practical ways to use it:
Gauge market sentiment: Rising VIX = rising fear. This can signal caution is warranted, especially around major events (e.g. Fed meetings, inflation data).
Timing entries and exits: A falling VIX during a market rally may confirm bullish momentum. A sudden spike could suggest a pullback is near.
Manage risk: Use the VIX as a barometer to adjust your position sizes. In high-VIX environments, markets can move quickly – tighter stops and smaller trades can protect capital.
Cross-asset awareness: Though based on S&P 500 options, the VIX influences global markets. Forex, commodities, and indices often respond to shifts in US volatility.
While there are products that track VIX movements (such as VIX futures and ETFs like VXX or UVXY), these are highly complex and time-sensitive. They are not suitable for beginners. Instead, most traders will benefit from treating the VIX as a signal, not a trading instrument.
VIX and market correlation: Why it moves opposite to equities
The VIX tends to rise when equities fall. Why? Because traders rush to buy protective options when prices drop, which inflates implied volatility.
Think of the VIX as a financial seismograph. When the market gets shaky, the VIX starts registering those tremors before the cracks appear.
It’s a mirror of investor behaviour: panic and protection-seeking push it up; calm and confidence pull it down.
That inverse relationship makes the VIX a useful contrarian indicator. Sharp VIX spikes during sell-offs may suggest fear is peaking, often before a reversal.
Practical tips for traders using VIX
The VIX can be a reliable compass – but only if you know how to use it wisely. Here are some habits and tactics to help you get the most out of it:
Don’t trade based on VIX alone. It works best as a supporting tool. Combine it with chart patterns, technical indicators, and macroeconomic context. For instance, if the VIX is rising alongside a key resistance level on a major index, it might signal a weakening uptrend.
Watch it during key events. The VIX often moves before major data drops, earnings seasons, or central bank decisions. An unexplained rise in the VIX before a known event could mean traders expect surprises.
Stay disciplined. High-VIX environments tempt overreaction. Traders may abandon strategy out of fear or greed. Instead, focus on your plan, reduce position size if needed, and avoid revenge trading.
Use it in daily prep. Just like checking the economic calendar or overnight news, add the VIX to your daily dashboard. Changes in the VIX can colour your risk approach for the day ahead.
Understanding the VIX gives you a window into the psychology of the market – and that edge is priceless.
Conclusion
VIX offers insight into how the market “feels” before the headlines catch up. It doesn’t replace your strategy, but it enhances it. For traders who want to navigate volatility with confidence, learning to read the Fear Index is a must.
If you are ready to put your trading knowledge into action, open a live account with VT Markets today and gain access to advanced tools, real-time insights, and tight spreads – everything you need to stay ahead in volatile conditions.
The US dollar saw a change in direction this week as focus shifted from interest rate expectations to growing global risks. Strong economic data supported early gains, but renewed trade tensions and geopolitical uncertainty prompted a more cautious market outlook.
Dollar slips as risk sentiment overtakes policy focus
The US dollar saw a modest retreat on Thursday, following a midweek rally that had driven the Dollar Index (USDX) to a two-month peak of 99.983.
By the end of the session, the index had slipped 0.2%, closing at 99.606 as market attention shifted from monetary policy cues to escalating global risk factors.
The greenback’s earlier gains were fuelled by stronger-than-anticipated US economic indicators, including upbeat private payroll figures and a GDP reading that exceeded forecasts.
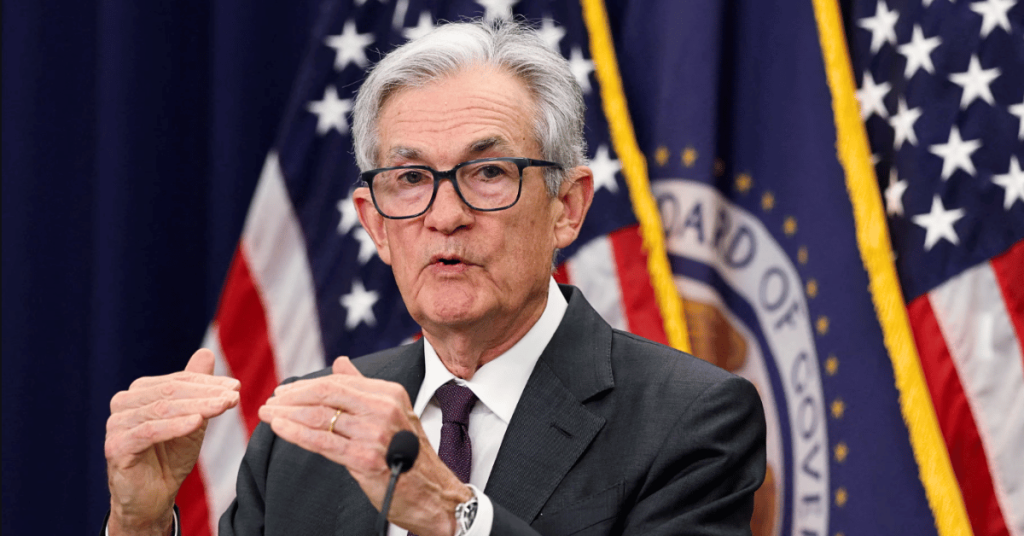
This positive data underpinned the dollar during the week, with additional support coming from Federal Reserve Chair Jerome Powell’s measured tone at the latest policy meeting.
While interest rates remained unchanged, Powell refrained from signalling any clear direction for potential rate cuts, leaving investors uncertain about the outlook for September.
Additionally, Trump criticised Canada’s recognition of a Palestinian state, suggesting it could complicate ongoing trade discussions – introducing fresh uncertainty for North American economic relations.
Technical analysis
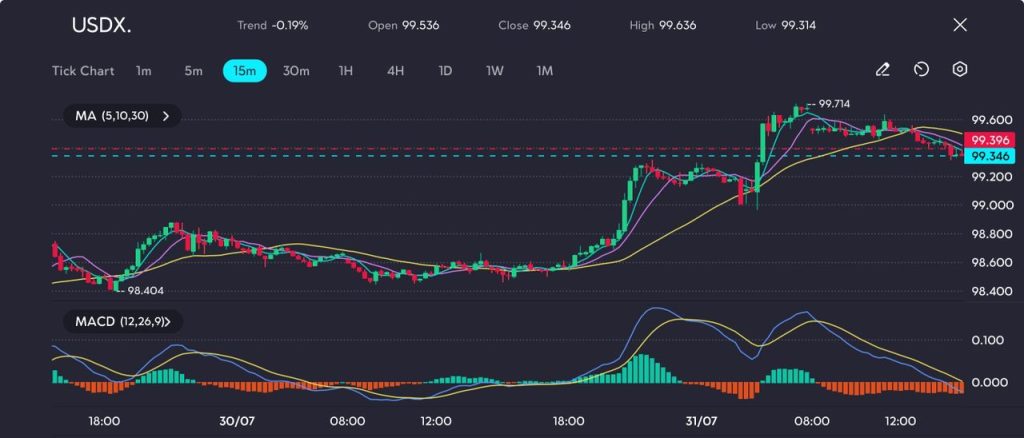
After rebounding from the 98.40 support area on 30 July, the USDX embarked on a steady upward trajectory, establishing a bullish pattern marked by a series of higher lows.
In the early hours of 31 July, the index broke decisively above 99.20, sparking a rapid move that topped out at 99.714.
However, the rally lost steam just above that resistance level, prompting a minor retracement toward the 99.35 zone.
Picture: USDX rally stalls below 99.75 as momentum eases, as seen on the VT Markets app.
Following the peak, short-term moving averages (5, 10, and 30) began to converge and slope downward, with both the 5- and 10-period MAs crossing below the 30-period – an early indication of potential trend reversal. Currently, the price is consolidating near this moving average cluster, attempting to establish fresh support.
The MACD histogram highlights a clear decline in bullish momentum. Green bars are tapering off, while the MACD line approaches a bearish crossover beneath the signal line. Should this crossover confirm, it may reinforce the likelihood of near-term downside movement.
At present, 99.20 represents the first key level of support, with 98.90 serving as a secondary target should selling pressure increase.
Conversely, a decisive close above 99.60 would negate the pullback scenario and open the door for a potential retest of 99.71 or even a push toward the psychological barrier at 100.00.
Cautious forecast
A sustained break below 99.30 would likely bring the 99.00 region into focus as the next key area of support, potentially opening the door for a deeper correction if bearish momentum accelerates.
Below this level, further downside could see price action test 98.90 or even revisit the 98.40 zone that previously acted as a strong base.
Conversely, a decisive rebound above 99.60 would suggest that bullish sentiment remains intact, possibly paving the way for a retest of 99.71 and a push toward the psychologically significant 100.00 mark.
A break above this threshold could attract renewed buying interest and signal a continuation of the broader uptrend.
Ultimately, the near-term direction of the US dollar hinges on the outcome of Friday’s trade negotiations, which may reshape market sentiment significantly.
Any unexpected policy announcements or geopolitical tensions – particularly from the White House – could inject volatility into currency markets and influence dollar flows in the sessions ahead.
Understanding drawdown is crucial for every trader, as it provides insight into the potential risks and losses associated with a trading strategy. Drawdown refers to the decline in an account’s balance from its peak to the lowest point during a specific period. Whether you’re a beginner or an experienced trader, knowing how to manage drawdown is key to maintaining long-term profitability and minimizing risks. In this article, we’ll explore what drawdown is, why it happens, how to calculate it, and the best strategies to manage and minimize its impact on your trading success.
What Is a Drawdown?
A drawdown refers to the decline in the value of an asset or portfolio (including investment assets) from its peak to its lowest point during a specific period. In trading, it’s often used to measure the risk of a trading strategy or an individual trade, representing the drop from its peak value to its lowest point. A drawdown is a critical indicator of the potential loss a trader might experience if a trade or a series of trades goes against them.
What Is Drawdown in Trading?
In the context of trading, a drawdown is a key metric used to measure the decline in a trader’s account balance, specifically the difference between the highest value and the lowest point reached after a series of trades. Drawdown is typically calculated as the difference between the account’s peak and its lowest point over a given period, providing a quantitative measure of loss. This decline often occurs after a period of consecutive losing trades or during times of high market volatility. Understanding what is drawdown in trading is essential for evaluating the risk exposure associated with a particular trading strategy. A drawdown indicates how much a trader could lose if the market moves against them and provides insight into how resilient their strategy is under adverse conditions.
For traders, understanding drawdown is not just about calculating potential losses—it’s also about managing risk. A large drawdown, especially when it exceeds a trader’s risk tolerance, can lead to serious consequences. These consequences include emotional stress, loss of confidence, and the risk of depleting a trading account, making it difficult to recover and continue trading. A significant drawdown can severely impact the trader’s account and overall account’s performance, potentially triggering risk management actions if a predefined loss threshold is approached. Consequently, traders must not only focus on maximizing returns but also ensure they are prepared for the drawdown that inevitably comes with trading, particularly in volatile markets. By managing drawdown effectively, traders can maintain a balanced approach to risk, allowing them to stay in the game for the long haul.
Why Drawdown Happens in Trading?
There are several reasons why drawdown happens in trading. Drawdowns occur in various financial markets, including forex and cryptocurrencies, often as a result of sustained losses or changing market conditions. The most common causes include:
Market Volatility: Market volatility leads to rapid price changes, which can cause significant losses. Traders unprepared for such fluctuations are at risk of large drawdowns, especially during unexpected events like economic releases or geopolitical crises.
Overleveraging: Using high leverage magnifies both gains and losses. When market conditions move against a highly leveraged position, it can result in a swift and significant drawdown, depleting the trader’s account quickly.
Poor Risk Management: Without proper risk management strategies, like using stop losses or controlling position sizes, traders expose themselves to larger drawdowns. Risking too much on one trade increases the chance of substantial losses.
Emotional Trading: Traders driven by emotions such as fear, greed, or hope often make impulsive decisions, leading to poor entries, exits, or holding on to losing positions, which increases drawdown risks.
Incorrect Strategy: An unsuitable trading strategy for current market conditions can cause prolonged drawdowns. As market conditions change, strategies must adapt to avoid further drawdowns. Using a strategy that doesn’t align with market trends or cycles can lead to consistent losses and increase drawdowns.
Examples of Drawdowns in Trading
Let’s take two real-life examples to understand how drawdown works over a given period:
Stock Market Crash: During the 2008 financial crisis, many traders saw significant drawdowns in their portfolios due to the sharp decline in global markets. For example, the S&P 500 index dropped by over 50%, which resulted in a significant drawdown for investors relying on the stock market. Such drawdowns can be triggered by unexpected events like economic releases, geopolitical crises, or major news events that impact market sentiment.
Forex Trading: A trader using high leverage in the forex market may experience a rapid drawdown when a major currency pair moves against their position within a given period. For instance, if a trader has 100:1 leverage on a EUR/USD trade and the currency moves 1% in the opposite direction, they may experience a 100% drawdown, wiping out their entire position. Active monitoring of news events is essential in forex trading, as these can cause sudden market volatility and impact drawdown.
These examples illustrate how quickly losses can accumulate and why it’s crucial to manage drawdown effectively.
What Are the Different Types of Drawdown?
There are several types of drawdowns in trading, each serving a different purpose for risk evaluation:
1. Maximum Drawdown
Maximum drawdown represents the largest loss from the peak to the lowest point or low point of an account balance during a specific time frame. This metric helps traders understand the potential worst-case scenario for their strategy, offering insight into the largest risk they could face. A high maximum drawdown can indicate a need to reevaluate the strategy, especially if it’s too aggressive or prone to large swings. Traders may also compare the drawdown to their starting balance to assess overall risk.
2. Relative Drawdown
Relative drawdown is the percentage loss from the peak balance to the trough, measured against the highest point achieved. Absolute drawdown, on the other hand, is the maximum loss measured from the starting balance to the lowest point reached. Understanding absolute drawdown is important for managing trading risk, as it shows the largest loss a trader has experienced from their initial deposit and helps in assessing risk and adjusting trading strategies. This type of drawdown helps traders assess how severe a loss is compared to the most recent high. It’s a useful measure for evaluating the overall volatility of an account and helps to highlight how much of the trader’s profits or gains have been wiped out relative to the peak.
3. Drawdown Duration
Drawdown duration refers to how long the account stays in a drawdown state. A prolonged drawdown period may signal deeper issues with the trading strategy, such as misalignment with current market conditions or a lack of adaptability. Shorter drawdowns may be recoverable, but extended ones often require adjustments in strategy or risk management to avoid further losses.
Each of these drawdowns can help traders assess risk and adjust their strategies to minimize losses.
This formula helps determine the percentage decline from the highest point (peak) to the lowest point (trough) of your account balance, giving you an accurate measure of the loss during a particular period.
For example, if your account balance reaches a peak of $10,000 and then drops to $7,000, your drawdown would be:
Drawdown = (10,000 − 7,000) / 10,000 x100 = 30%
This means you’ve experienced a 30% drawdown.
How to Manage and Minimize Drawdown
Managing and minimizing drawdown is essential for long-term success. Effective strategies help ensure drawdown is limited, even during periods of market volatility. Here are some key strategies to consider:
1. Risk Management
Always use stop losses to limit potential losses; setting a stop loss level for each trade is essential for effective risk management. The risk per trade should be predetermined, typically no more than 2% of your account balance. This helps ensure that no single trade wipes out a significant portion of your capital.
2. Position Sizing
Adjust the size of each trade based on your risk tolerance and account balance. By trading smaller positions, you reduce the risk of a large drawdown, especially in volatile markets where price fluctuations can be more extreme.
3. Diversification
Spread your risk across different assets or markets. This helps mitigate the impact of a drawdown from a single trade or asset, providing a more balanced risk profile for your portfolio.
4. Maintain Discipline
Stick to your trading plan and avoid impulsive decisions driven by emotions like fear or greed. Emotional trading often leads to larger drawdowns due to impulsive entries, exits, or holding onto losing positions too long.
5. Adapting to Market Conditions
Not all strategies work in every market. Be flexible and adjust your approach depending on whether the market is trending, ranging, or volatile. This adaptability can help reduce drawdowns caused by using ineffective strategies in the wrong market environment.
6. Managing Maximum Drawdown
Set a maximum drawdown limit that aligns with your risk tolerance. For example, if your account balance falls by 20%, you may decide to stop trading for a while to reassess your strategy. This helps protect your capital from larger losses and provides an opportunity to reset emotionally and strategically.
Psychological and Behavioral Approaches to Drawdown
Drawdowns can test a trader’s mental resilience, often triggering emotional trading and impulsive trades that lead to further losses. The psychological impact of seeing your trading account decline can be significant, especially during periods of heightened market volatility or market downturns.
To navigate these challenging periods, it’s vital to maintain discipline and stick to your trading plan. Avoiding revenge trading—where you try to quickly recover losses by taking on more risk—can help prevent significant losses and preserve capital. Instead, focus on making rational, well-thought-out decisions, even when emotions are running high.
Developing a strong risk management routine, including appropriate position sizing, can help limit your exposure during volatile periods. By understanding the behavioral tendencies that drawdowns can trigger, traders can take proactive steps to manage their emotions, avoid impulsive trades, and stay committed to their long-term strategy. This disciplined approach not only helps limit drawdowns but also supports more consistent trading results over time.
In Summary
Drawdown is an inherent part of trading, but understanding its causes, types, and calculation methods is crucial for effective risk management. By implementing strong risk management strategies, such as using stop losses, adjusting position sizes, and maintaining discipline, traders can minimize drawdowns. Additionally, adapting strategies to changing market conditions and setting clear limits for maximum drawdown will help protect your capital. With these practices in place, traders can better manage risk and work towards more consistent trading performance.
Start Trading Today with VT Markets
Ready to manage your risk and trade with confidence? At VT Markets, we provide the tools and resources you need to succeed. Our platform offers powerful tools like MetaTrader 4 (MT4) and MetaTrader 5 (MT5), ideal for managing drawdowns and maximizing your trading potential. You can also practice your strategies risk-free with our VT Markets demo account. For additional support, our Help Centre is always available to assist you.
Drawdown in trading refers to the decline in a trader’s account balance from its highest point (peak) to the lowest point (trough) during a specific period. It helps traders assess the risk associated with a particular trading strategy and understand how much they could potentially lose during adverse market conditions.
2. What is a good drawdown in trading?
There is no definitive answer, but many traders consider a drawdown of 20% or less to be acceptable, depending on their risk tolerance.
3. How do I avoid large drawdowns in trading?
Focus on proper risk management, including using stop losses, limiting the risk per trade, and diversifying your trades.
4. Can drawdown be prevented completely?
No, drawdown is a natural part of trading, but it can be minimized with disciplined trading practices and proper risk management.
5. What is the difference between maximum drawdown and relative drawdown?
Maximum drawdown is the largest loss in your account from peak to trough, while relative drawdown is the percentage loss relative to the highest account value.
6. How does drawdown affect trading psychology?
Drawdown can have a significant psychological impact, causing stress and emotional decisions. It’s essential to stay disciplined, stick to your trading plan, and avoid emotional trading during drawdowns.
7. Does drawdown affect the overall profitability of a trading strategy?
Yes, significant drawdowns can erode capital, which may reduce the potential for long-term profitability. It’s important to find a balance between risk and reward to avoid excessive drawdowns.
8. Can I recover from a large drawdown?
Yes, recovering from a large drawdown is possible with consistent and disciplined trading. However, the recovery depends on having enough capital and a well-thought-out risk management strategy in place.
Please note that the dividends of the following products will be adjusted accordingly. Index dividends will be executed separately through a balance statement directly to your trading account, and the comment will be in the following format “Div & Product Name & Net Volume”.
Please refer to the table below for more details:
The above data is for reference only, please refer to the MT4/MT5 software for specific data.
If you’d like more information, please don’t hesitate to contact info@vtmarkets.com.
Investor caution is building in Japan as markets await the Bank of Japan’s policy decision amid ongoing global trade tensions. With inflation expectations in focus and export risks still in play, traders are holding back, keeping the market in a narrow, uncertain range.
Markets mixed as Bank of Japan decision nears
Japanese equities closed Wednesday’s session on a mixed note, with investors taking a cautious stance ahead of the Bank of Japan’s (BOJ) upcoming monetary policy announcement.
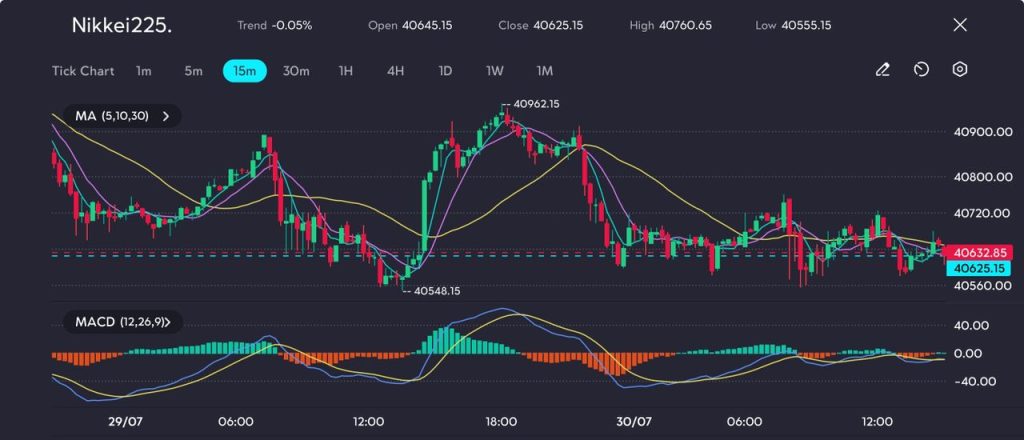
The Nikkei 225 edged down by 0.05%, settling at 40,625.15, while the broader Topix Index rose 0.4% to 2,920, supported by gains in the banking and energy sectors.
The Bank of Japan is expected to keep its benchmark interest rate steady and boost its inflation outlook, as investors look for hints of another rate hike this year after a US-Japan trade deal reduced some uncertainty https://t.co/Q3KRaJEOU6
Market uncertainty centred around Thursday’s BOJ policy meeting. Although most analysts anticipate no change in interest rates, traders are closely monitoring for any upward revisions in the central bank’s inflation forecasts.
Persistent inflationary pressures, particularly in food and services, could push the BOJ closer to tightening policy later in the year. However, policymakers remain wary of potential global trade disruptions.
Adding to the cautious sentiment, U.S. Commerce Secretary Howard Lutnick confirmed that the 1 August tariff deadline will remain in effect for nations lacking formal trade agreements.
While an extension of the trade truce between the United States and China appears likely, no official deal has been announced. As a major export-driven economy, Japan remains vulnerable to volatility in global manufacturing and supply chains.
Technical analysis: Nikkei 225 struggles for direction
The Nikkei 225 index showed little directional commitment, retracing an intraday surge that briefly touched 40,962.15.
The index now fluctuates around its 5-, 10-, and 30-period moving averages, all of which are starting to flatten – a classic sign of market indecision or the onset of a consolidation phase.
Momentum indicators also reflect the current uncertainty. The MACD histogram continues to alternate weakly between positive and negative territory, with the signal line hovering near the zero level, offering no clear trend signal.
Picture: Nikkei 225 holds range as bulls and bears tug for direction, as seen on the VT Markets app.
With Japan’s corporate earnings season ongoing and the BOJ likely to maintain its accommodative monetary policy stance, equity investors are hesitant to take strong positions.
In the near term, the Nikkei 225 may remain range-bound between 40,550 and 40,950. A decisive breakout above the 41,000 mark could signal bullish continuation, while a drop below 40,540 may prompt a shift in sentiment towards the downside.
Market outlook: Cautious sentiment prevails
Investor sentiment remains tentative as markets await clarity from the Bank of Japan. Should the BOJ adopt a more hawkish tone or sharply upgrade its inflation projections, Japanese equities – particularly the Nikkei 225 – could face renewed selling pressure.
A strengthening yen in response to tighter policy expectations would likely add to that downward momentum, especially in export-heavy sectors.
Technically, the index is hovering near key support levels. A confirmed drop below the 40,560 zone could trigger a deeper correction, potentially targeting the 40,400 area in the short term.
This would reflect a loss of near-term confidence and might invite further selling from momentum-driven traders.
On the upside, sustained bullish sentiment would need a clear break above 40,800, ideally accompanied by strong earnings reports, improved global risk appetite, or dovish cues from the BOJ.
Until such catalysts emerge, sideways movement within the current range remains the most likely scenario.
Gamma squeezes are one of the most exciting and volatile phenomena in the stock market. When triggered, they can lead to dramatic price movements, creating significant opportunities for traders to capitalize on. But what exactly is a gamma squeeze? How does it happen, and what can traders do to navigate these intense market conditions? In this article, we’ll break down the concept of a gamma squeeze, how it works, notable examples, and key strategies to trade effectively during these explosive price surges.
What is a Gamma Squeeze?
A gamma squeeze is a market phenomenon that occurs when the price of a stock increases rapidly due to the actions of market makers involved in options trading. This happens when there is a large influx of call options being purchased on a particular stock, which leads to an increase in the stock’s price. A call option gives the buyer the right, but not the obligation, to purchase a stock at a specific price (the strike price) within a set period. When many traders buy call options, it creates a demand for the underlying stock, causing its price to rise.
Market makers—financial entities that provide liquidity by buying and selling options—are obligated to sell these call options to traders. However, because they are exposed to the risk of the stock’s price rising (since the options give the buyer the right to purchase the stock at the strike price), they need to hedge their positions. To do this, market makers buy the underlying stock, which helps to neutralize their risk. This process of buying shares to hedge against the increasing likelihood that the options will be exercised leads to a further increase in the stock’s price.
As the stock price continues to rise, the delta of the call options increases. Delta refers to the rate at which an option’s price changes relative to changes in the price of the underlying stock. For example, if the stock price rises, the delta increases, meaning that for every unit of stock price movement, the market maker must buy even more shares to maintain their neutral position. This creates a feedback loop, where the increasing price forces the market makers to buy more, which drives the price even higher, causing more options to be exercised, and so on.
This loop of rising prices continues until the gamma squeeze runs its course. The resulting price movement can be dramatic and volatile, often leading to significant swings in the stock price within a short period. The squeeze typically subsides once the options expiration date arrives, or once the demand for call options decreases. While gamma squeezes can result in massive short-term profits for those who capitalize on the price movement, they also carry high risk due to the volatility involved.
What Causes a Gamma Squeeze?
A gamma squeeze is typically caused by a combination of three factors: high options volume, rising open interest in call options, and the need for market makers to hedge their positions. Here’s a breakdown of the primary factors that contribute to this phenomenon:
1. Options Volume and Open Interest
When a large number of call options are bought at a particular strike price, the increased trading volume can influence the option price and attract more traders’ attention. Market makers (who often sell these options) must hedge their positions by purchasing the underlying asset. The more call options traded, especially at key strike prices, the greater the buying pressure on the underlying stock.
2. Delta and Gamma
The key options “Greeks” involved are delta (the rate of change in an option’s price relative to the underlying asset) and gamma, which measures the rate of change of delta as the underlying stock price moves. The relationship between the stock price and the option’s strike price, especially the call option’s strike price, is crucial in determining how much hedging is required. As the stock price rises and approaches or surpasses the option’s strike price, delta increases, forcing market makers to buy even more stock to maintain their hedges. This gamma effect, as gamma measures the sensitivity of delta to price changes, can drive the stock price further up.
3. Market Sentiment
Often, a gamma squeeze is driven by speculative buying, especially in volatile markets, as traders act on expectations of future price movements in the underlying stock. Retail traders or large institutional players may push the stock price higher, contributing to a self-perpetuating cycle of buying.
The Key Players Involved in a Gamma Squeeze
Understanding the key participants in a gamma squeeze is crucial to identifying the forces driving the market:
Market Makers: These are the financial entities responsible for providing liquidity in the options market. They sell options contracts to traders and hedge their risk by buying or selling the underlying stock. When a gamma squeeze occurs, market makers are forced to buy more shares of the underlying stock to balance their positions, which drives the stock price higher.
Retail Traders: Retail traders often contribute to a gamma squeeze by buying call options in large quantities. As their activity increases, they create the buying pressure that leads to a significant rise in the stock price.
Institutional Investors: While gamma squeezes are often triggered by retail traders, institutional investors can play a role in amplifying the event. Large institutional players may contribute to the rally by buying additional options or shares, further driving the squeeze.
Gamma Squeeze vs. Short Squeeze: What Are the Key Differences?
While both gamma squeezes and short squeezes can result in dramatic price movements, they occur through different mechanisms and involve different market dynamics. The table below shows the key differences between a gamma squeeze and a short squeeze, helping to clarify how each one operates and the forces behind them.
Aspect
Gamma Squeeze
Short Squeeze
Trigger Mechanism
Driven by the buying of call options and the hedging actions of market makers.
Caused by short sellers being forced to buy back shares to cover their positions.
Price Movement
Rising stock price forces market makers to buy more shares to hedge their options positions, driving the price even higher.
A high level of short interest and an unexpected price rise.
Market Players
Short sellers, retail investors, and hedge funds who are betting against the stock.
Rising stock prices forces short sellers to buy back stock, causing a further price increase.
Driving Factor
Surge in call options buying and hedging needs of market makers.
It can last as long as short sellers struggle to cover their positions, often triggered by news or events.
Timeframe
Typically short-term but can be quick and volatile, lasting until options expiration or price correction.
Can last as long as short sellers struggle to cover their positions, often triggered by news or events.
Outcome
A feedback loop of rising prices due to continuous hedging; in some cases, the stock rose dramatically due to a gamma squeeze.
A rapid price increase caused by short sellers being squeezed out of their positions.
Gamma Squeeze: A gamma squeeze is triggered when there is significant buying activity in call options. Market makers, who sell these options, are required to hedge their positions by purchasing the underlying stock. As the stock price rises, market makers need to buy even more shares to adjust their hedge, creating a feedback loop of increasing prices.
Short Squeeze: A short squeeze, on the other hand, happens when short sellers—who have bet against a stock—are forced to buy back shares to cover their positions as the price unexpectedly rises. This buying pressure from short sellers further drives the price higher, triggering even more buying.
While both squeezes are driven by a surge in buying pressure, the key difference is in the cause: a gamma squeeze is driven by options traders and the need for market makers to hedge, while a short squeeze is caused by short sellers scrambling to cover their positions.
A gamma squeeze can lead to dramatic price movements, as shown in these notable examples, where the buying of call options triggered significant surges in stock prices due to the hedging activities of market makers.
1. GameStop (GME) – January 2021
The GameStop gamma squeeze is perhaps the most famous example of a gamma squeeze that also triggered a short squeeze. Retail traders, primarily from the Reddit group WallStreetBets, began buying massive quantities of out-of-the-money GameStop call options, which led to a surge in options volume. Market makers, who sold these options, were forced to buy GameStop stock to hedge their positions. This created a feedback loop where the rising stock price forced market makers to buy even more shares, causing the price to skyrocket from under $20 to over $400 in a matter of days. The gamma squeeze was further intensified by high short interest in GameStop, leading to a combination of both a gamma squeeze and a short squeeze.
2. AMC Entertainment (AMC) – May 2021
Similar to GameStop, the AMC gamma squeeze occurred in May 2021. AMC gamma squeeze explained: This event was driven by retail traders, particularly from online communities like Wall Street Bets, who bought up a large number of call options for AMC stock. This activity played a crucial role in preventing AMC’s bankruptcy during the COVID-19 crisis. As the price rose, market makers had to buy more shares to hedge, fueling the price increase even further. AMC’s stock, which had been trading around $5 to $10, soared to over $60 within a matter of weeks. The high demand for call options and the associated buying pressure created a classic gamma squeeze scenario.
3. Volkswagen (VW) – October 2008
One of the most remarkable examples of a gamma squeeze took place with Volkswagen (VW) stock in October 2008. During this time, Porsche revealed that it had acquired a majority of the outstanding shares of Volkswagen, putting pressure on short sellers. In response, many traders bought call options to capitalize on the potential rise in Volkswagen’s stock price. Market makers, who sold the options, were forced to hedge by buying more shares, driving the price of Volkswagen stock up from around €200 to over €1,000 within just a few days. This squeeze became one of the most extreme price movements in stock market history.
4. SoftBank (SFTBY) – 2020
Another significant gamma squeeze occurred in 2020 when SoftBank, a Japanese conglomerate, became a large player in the options market. The company made massive purchases of call options on various tech stocks, which sparked a rise in their prices. As the prices of stocks like Amazon, Apple, and Tesla began to surge, market makers were forced to buy more shares to hedge their positions, further escalating the price increases. This created a gamma squeeze that affected several high-profile stocks in a short period of time, showcasing the power of options in driving stock prices.
How to Spot a Gamma Squeeze
A gamma squeeze can be tricky to identify, but there are several indicators that can signal its onset.
1. Unusual Options Volume
One of the first signs of a potential gamma squeeze is a surge in call options volume. If you notice a significant increase in the number of out-of-the-money (OTM) call options being traded, particularly at the same strike price, it’s likely that market makers will need to hedge their positions. This can lead to increased buying pressure on the underlying stock.
2. Rising Open Interest
Look for a rapid increase in open interest for call options. When traders buy calls, especially in large quantities, it forces market makers to purchase more stock to hedge against potential price moves. This can amplify the gamma squeeze effect.
3. Increase in Implied Volatility
A sharp rise in implied volatility (IV) can signal that the market expects significant price movement. As IV rises, market makers may buy more of the underlying stock to hedge their positions, adding to upward price pressure and potentially triggering a gamma squeeze.
4. Rapid Price Movements
Watch for fast price increases without corresponding news or earnings reports. If the price rises quickly alongside increased options activity, it’s a strong indication that a gamma squeeze might be at play, as market makers scramble to hedge their options exposure.
How to Trade During a Gamma Squeeze
Trading during a gamma squeeze can be profitable but requires understanding the market dynamics. Here are the key steps to trade effectively during a gamma squeeze:
Step 1: Monitor Options Activity
Watch for high call options volume and rising open interest, which signal a potential gamma squeeze.
Step 2: Buy Call Options
If a gamma squeeze is forming, buying call options can offer high returns as the stock price rises. Opt for at-the-money options and be mindful of expiration.
Step 3: Enter the Stock Market
If you prefer buying the stock, enter when the price begins rising sharply. Timing is crucial—avoid entering too early or too late.
Step 4: Use Stop-Loss Orders
Protect your position with a stop-loss or trailing stop as the price rises to lock in gains while allowing for further movement.
Step 5: Take Profits
Exit the position when the price hits resistance or volume drops. Gamma squeezes are short-lived, so capitalize on the surge before it fades.
Step 6: Stay Alert for Reversals
Watch for quick price reversals after the squeeze peaks. Exit or hedge if the price starts to fall rapidly to protect your gains.
Key Considerations When Trading a Gamma Squeeze
Trading a Gamma Squeeze can be profitable, but it requires careful strategy. Here are the key considerations for trading a gamma squeeze effectively:
Volatility: Gamma squeezes are often short-lived, with prices potentially experiencing sharp reversals. Traders should be aware of the risks and ready to exit positions quickly.
Emotions: FOMO (Fear of Missing Out) can drive irrational trading behavior during gamma squeezes. Traders should stick to their strategies and avoid chasing the rally.
Liquidity: Ensure there is enough liquidity in the stock or options you’re trading to avoid large slippage when entering or exiting positions.
Timing: Timing is crucial. Gamma squeezes often happen quickly, and traders must be able to enter and exit the market efficiently to lock in profits.
A gamma squeeze occurs when a surge in call options buying forces market makers to hedge by buying the underlying stock, creating a feedback loop that drives prices higher. While trading during a gamma squeeze can be profitable, it’s essential to carefully monitor options activity, open interest, and stock price movements to manage risk effectively. Understanding the dynamics of the squeeze and timing your entry and exit points is crucial for maximizing profits.
A gamma squeeze occurs when a surge in call options buying forces market makers to buy more of the underlying stock to hedge their positions, driving the price higher.
2. What causes a gamma squeeze?
A gamma squeeze is caused by the rapid buying of call options, which forces market makers to buy the underlying asset to hedge their positions, driving the price higher.
3. How is gamma squeeze different from a short squeeze?
A gamma squeeze is driven by options buying and hedging, while a short squeeze occurs when short sellers are forced to buy back stock to cover their positions.
4. Can a gamma squeeze happen in any market?
Yes, a gamma squeeze can occur in any market where options are traded, but it’s more common in stocks with high volatility or speculative interest.
5. How does a gamma squeeze affect stock prices?
As market makers buy more stock to hedge their options, the increasing demand causes the stock price to rise, creating a feedback loop that drives prices even higher.
6. How to spot a gamma squeeze?
To spot a gamma squeeze, traders should monitor the following indicators:
Unusual options volume
Rising open interest
Increase in implied volatility
Rapid price movements
7. How to trade during a gamma squeeze?
Here are the key steps to trade effectively during a gamma squeeze:
Step 1: Monitor options activity
Step 2: Buy call options
Step 3: Enter the stock market
Step 4: Use stop-loss orders
Step 5: Take profits
Step 6: Stay alert for reversals
8. How long does a gamma squeeze typically last?
A gamma squeeze can last anywhere from a few hours to several days, depending on the level of options activity and market dynamics. It often ends when the options expiration date arrives or when the buying pressure diminishes.
9. Can a gamma squeeze happen with any stock?
While it’s possible for a gamma squeeze to occur with any stock, it’s more common in stocks with high volatility and significant options trading activity.
10. Can retail traders cause a gamma squeeze?
Yes, retail traders can drive a gamma squeeze by buying large volumes of call options, which increases demand for the underlying stock and triggers the hedging actions of market makers.
11. What are the risks of trading during a gamma squeeze?
The main risk is that gamma squeezes are often short-lived, and prices can reverse quickly. If you’re caught in the wrong position, you could face significant losses.
12. How can I protect myself when trading a gamma squeeze?
To protect yourself, use stop-loss orders, stay alert to price movements, and consider using hedging strategies like buying puts or selling call options to manage risk.
Please note that the dividends of the following products will be adjusted accordingly. Index dividends will be executed separately through a balance statement directly to your trading account, and the comment will be in the following format “Div & Product Name & Net Volume”.
Please refer to the table below for more details:
The above data is for reference only, please refer to the MT4/MT5 software for specific data.
If you’d like more information, please don’t hesitate to contact info@vtmarkets.com.


 | VT Markets")
 | VT Markets")
 | VT Markets")
 | VT Markets")

 | VT Markets")