European markets are moving cautiously this week. Investors are reacting to disappointing economic data from the region while waiting for an important inflation report from the United States. With no strong local news to drive the market, confidence is low, and both share prices and currencies are trading in narrow ranges.
Economic data weighs on sentiment
Recent numbers from Europe and the UK suggest that the region’s economy is under pressure. Retail sales in the eurozone rose by just 0.3% in June, slightly below forecasts.
More importantly, Germany’s industrial orders – a key indicator of manufacturing health – fell by 1.0%, even though analysts expected a rise.
In the UK, the construction sector is also slowing down. The latest survey (PMI) showed a drop to 44.3, well below the level that indicates growth.
Although Germany’s construction PMI improved slightly to 46.3, it still suggests ongoing weakness.
These figures raise concerns that the economic slowdown in Europe may last longer than expected. As a result, investors are becoming more cautious with European stocks and currencies.
Stock markets struggle to hold gains
Share markets in Europe tried to push higher at the start of the week, but gains didn’t last. Germany’s DAX index and France’s CAC 40 both ended the session with only small increases.
This shows that traders are unwilling to take strong positions without clearer signals from the economy or central banks.
Germany’s weak data is particularly worrying. In past years, when Germany’s factories slowed down, it often led to poor performance in the wider European market.
Many now fear that history could repeat itself if conditions don’t improve soon.
What this means for the euro and the pound
The euro and British pound have shown small gains against the US dollar this week, but these moves may not last.
If the next US inflation report shows prices rising faster than expected, the dollar could strengthen again – putting pressure on both the euro and the pound.
This is especially true because the European and UK economies don’t currently look strong enough to support their currencies on their own.
Traders who expect more weakness might consider options or positions that benefit if EUR/USD or GBP/USD falls after the US data release.
Volatility may return soon
Right now, markets are quiet. Prices are moving within tight ranges, and overall volatility (price swings) is low. But this calm might not last.
Next week’s US CPI (Consumer Price Index) report is a major event. If inflation is higher or lower than expected, markets could move sharply in either direction. For traders, this can be an opportunity to prepare ahead of time.
One way to do this is by using options strategies such as straddles or strangles, which are designed to profit from big moves – regardless of direction.
These can be useful on instruments like the DAX index or currency pairs such as EUR/USD.
A time to prepare, not to chase
Right now, European markets are in a holding pattern. There’s no strong trend, and economic data is sending mixed signals.
This quiet period is a chance to get ready. The next big move could come after the US inflation numbers are released – and that could set the tone for the rest of the month.
For now, risk management and planning are key. Whether it’s through protective strategies or well-timed entries, being prepared matters more than being early.
Contango and backwardation are terms used in futures trading to describe how contract prices relate to the current market (spot) price. These pricing patterns offer key insights into supply, demand, and market sentiment. Whether you’re trading oil, gold, or commodity ETFs, understanding the difference between contango and backwardation can shape how you manage positions and assess risk. In this article, we’ll explain what these terms mean, what causes them, how they differ, and how traders and investors can apply this knowledge in real-world scenarios.
What Does Contango Mean?
Contango is a market condition where futures prices are higher than the current spot price. Contango refers to a situation in which the price for a commodity to be delivered at a future date is above the price available in the spot market, where immediate delivery occurs. In simple terms, it means you’re paying more for delivery in the future than if you bought the commodity today.
This usually happens when the cost of holding or storing the asset—such as storage costs, insurance costs, and interest rates—is factored into the price. Markets often experience contango when there is no immediate shortage or supply disruption, and future prices reflect normal storage and carry costs.
Example of Contango:
Contango often appears in the crude oil market when supply is abundant and demand is stable or declining. Brent crude oil is a classic example of a commodity that often trades in contango. For instance, if the spot price of oil is $75 per barrel, but a futures contract for delivery in six months (the future date) is priced at $78, the market is in contango. This price difference reflects the storage, insurance, and financing costs associated with holding the physical commodity until delivery. In this scenario, the futures curve is typically an upward-sloping forward curve, where the future price or forward price for a future date is higher than the current spot price, and is compared to the expected spot price at the time of contract expiration.
What Does Backwardation Mean?
Backwardation is the opposite of contango. It occurs when futures prices are lower than the current spot price, creating a market known as a backwardation. In such a market, the futures curve is typically a downward-sloping curve, reflecting market expectations that prices will fall or that there is a supply-demand imbalance. Backwardation can also occur when the futures price is below the expected future spot price, a situation referred to as normal backwardation. This is often explained by Keynesian theory, where the difference between the futures price and the expected future spot price represents a risk premium earned by speculators for taking on price risk. Additionally, convenience yield—the benefit or incentive for holding the physical commodity now rather than later due to anticipated supply disruptions or tight supply conditions—can contribute to backwardation.
Backwardation tends to favor long positions, as futures prices often rise and converge with the spot price before expiry. This creates what’s known as a positive roll yield, which can enhance returns over time.
Example of Backwardation:
Backwardation is common in natural gas markets during periods of high seasonal demand. For example, if the spot price of natural gas rises to $5.00 per MMBtu due to increased heating needs, while a futures contract for delivery a few months later is priced at $4.30, the market is in backwardation. This reflects strong near-term demand, the influence of convenience yield, and expectations of lower prices once the short-term pressure eases. The difference between the futures price and the expected future spot price may also include a risk premium, further contributing to the backwardation structure.
What Causes Contango and Backwardation?
Several factors can influence whether a market is in contango or backwardation:
1. Storage and Insurance Costs
Storage costs and insurance costs are significant factors, especially in commodity futures and commodity futures markets. These costs are incurred to hold the underlying commodity until the delivery date, and they are reflected in the delivery price of the futures or forward contract. As the delivery date approaches, the futures price and spot price tend to converge.
2. Financing Costs and Interest Rates
Financing costs and interest rates are also part of the total cost structure for future delivery of the underlying asset. In both futures markets and forward contracts, these costs are included in the calculation of forward prices and delivery prices, impacting the price differences between spot and futures prices.
3. Expectations of Future Supply and Demand
Investors anticipate changes in future supply and demand, which affect the expected future price and expected spot price of the underlying commodity. These expectations are reflected in the pricing of futures contracts, forward contracts, and forward prices.
4. Contract Structure and Expiration
The structure of futures contracts and forward contracts includes specific expiration dates, expiry dates, and delivery dates. As the contract expires or the futures contract expires, the futures price and spot price converge, and the delivery price becomes equal to the spot price. This convergence is a key feature of both futures and forward contracts.
5. Arbitrage and Price Risk
Price risk and price differences between spot and futures prices create opportunities for market participants to sell futures contracts or engage in arbitrage. In the futures market and commodity futures markets, these activities help align prices and manage risk for both speculators and hedgers.
For example, in extreme market conditions, the current futures price and current price can diverge significantly, reflecting the impact of storage costs, financing costs, and market expectations. In normal market conditions (contango), futures prices are above spot prices, and as the delivery date or expiry date approaches, prices converge.
Contango vs Backwardation: What Are the Key Differences?
The key differences between contango and backwardation lie in how they reflect market expectations and trading conditions. As a futures contract approaches expiration, spot and futures prices tend to move closer together, eventually meeting at the contract’s expiry. The table below highlights the main contrasts between the two pricing structures.
Aspect
Contango
Backwardation
Price Relationship
Futures price > Spot price
Futures price < Spot price
Market Condition
Surplus or stable supply
Tight supply or rising demand
Trader Impact
Negative roll yield
Positive roll yield
Common in
Energy, gold in stable periods
Agriculture, energy in crisis
Risks
Costly rollovers in ETFs
Limited availability or volatility
1. Price Relationship
In a contango market, the futures price is higher than the spot price. This reflects the costs associated with holding or storing the asset until delivery. The delivery price reflects the agreed cost of the commodity upon settlement, aligning futures and spot prices as the contract nears expiry. Traders expect prices to rise gradually toward the futures price as the contract matures. In backwardation, the futures price is lower than the spot price, meaning immediate delivery is more expensive. This often signals strong current demand or limited supply.
2. Market Condition
Contango typically occurs when the market is well-supplied and stable. There is no immediate need for the commodity, so traders price in the cost of carrying the asset into the future. In contrast, backwardation suggests a tight market where supply is constrained or demand is surging. It reflects urgency — buyers are willing to pay more now rather than wait.
3. Trader Impact and Roll Yield
Contango can be costly for traders and investors who roll over futures contracts. As each expiring contract is replaced by a more expensive one, the strategy generates a negative roll yield, reducing overall returns. Backwardation, on the other hand, often produces a positive roll yield. Traders benefit as futures prices tend to rise and converge with the spot price before expiry, effectively boosting returns.
4. Common Markets and Conditions
Contango is often observed in markets with high storage capacity and low short-term demand, such as crude oil or gold during calm economic periods. Backwardation is more common in commodities sensitive to seasonal demand or geopolitical stress, such as natural gas during winter or agricultural products during supply disruptions.
5. Risks and Challenges
In contango, investors in commodity-based ETFs or funds may experience performance drag due to repeated rollovers into higher-priced contracts. This is especially problematic for long-term holders. In backwardation, while roll yield can be positive, the market may be volatile and unpredictable. Prices may reflect panic buying or unexpected supply shocks, which pose risks of their own.
How Traders and Investors Use Contango and Backwardation
Understanding whether a market is in contango or backwardation helps traders and investors make more informed decisions about when to enter or exit a position, and how to manage risk. Analyzing price movements and futures curves allows investors to identify opportunities and risks in contango and backwardation markets.
In a contango environment, futures prices are higher than spot prices, which can erode profits over time through negative roll yield. This is especially important for short-term traders or ETF investors, as rolling into higher-priced contracts repeatedly can reduce performance. As a result, traders in contango markets often limit their holding periods or seek alternative strategies like calendar spreads to manage the cost of rollover.
In backwardation, futures prices are lower than the current spot price. This can work in favor of long-term holders because of the positive roll yield — as contracts move toward expiry, they tend to rise and converge with the spot price, offering a potential return boost. Traders often see backwardation as a sign of near-term scarcity, which can lead to more confident or aggressive long positions.
For investors using commodity ETFs or funds tied to futures (such as oil, gas, or metals), the shape of the futures curve matters significantly. ETFs that roll contracts monthly can suffer in contango, while they tend to perform better in backwardation. Monitoring curve structures regularly helps investors avoid underperformance and align with market conditions more effectively.
Advantages and Disadvantages of Contango
Contango affects traders and investors in different ways depending on their strategy and holding period. Below are the key advantages and disadvantages of operating in a contango market.
Advantages of Contango
1. Predictable and Stable Markets
Contango often reflects normal market conditions where supply is sufficient and prices move steadily over time. This predictability can benefit institutions or hedgers seeking long-term exposure.
2. Useful for Hedging Long-Term Contracts
Producers and commercial users can lock in future prices above current levels, helping them budget and protect against price drops.
3. Reflects Full Cost Structure
The futures price in contango includes storage, insurance, and interest costs, offering a more complete picture of long-term commodity pricing.
Disadvantages of Contango
1. Negative Roll Yield
When traders roll expiring contracts into higher-priced futures, the price difference results in a loss over time — a major concern for futures-based strategies.
2. ETF Underperformance
Commodity ETFs that track futures often roll contracts monthly. In contango, these rollovers happen at higher prices, which can cause the fund to underperform the actual spot price of the asset.
3. Discourages Long-Term Holding
For investors seeking long exposure, contango adds a cost burden that reduces returns over time, making it less attractive for buy-and-hold strategies.
Advantages and Disadvantages of Backwardation
Backwardation can create favorable conditions for certain strategies but may also signal market stress. The following points outline its major benefits and risks.
Advantages of Backwardation
1. Positive Roll Yield
Traders benefit as futures prices rise toward the spot price at expiry, generating a potential return from contract rollovers.
2. Favorable for Long Positions
Investors entering long positions at discounted futures prices can gain an edge as prices rise closer to the spot.
3. Signals Strong Demand or Tight Supply
Backwardation often indicates immediate demand or supply shortages, providing bullish signals for short-term trading opportunities.
Disadvantages of Backwardation
1. Supply Risk and Market Stress
Backwardation may reflect underlying issues like geopolitical risk or inventory shortages, increasing market uncertainty.
2. Higher Market Volatility
Sharp changes in supply and demand can cause price swings, making backwardated markets more volatile and harder to predict.
3. Limited Hedging Flexibility
Lower future prices reduce incentives for producers to hedge, which can lead to more exposure to price fluctuations.
In Summary
Contango and backwardation are key concepts in futures trading that reflect market expectations, cost factors, and the balance of supply and demand. Understanding the differences between them helps traders and investors manage risk, interpret market signals, and make more informed decisions when dealing with futures contracts or commodity-based ETFs.
Explore market opportunities, test your strategies risk-free with a VT Markets demo account, and take advantage of advanced tools to navigate pricing structures like contango and backwardation with confidence.
Contango is when futures prices are higher than the current spot price due to storage or financing costs.
2. What is backwardation in simple terms?
Backwardation is when futures prices are lower than the current spot price due to strong near-term demand or limited supply.
3. Can ETFs be affected by contango?
Yes. Commodity ETFs that roll futures contracts can suffer performance drag in contango markets.
4. How do I know if a market is in backwardation?
Check the futures curve. If short-term contracts are priced higher than long-term ones, it’s backwardation.
5. Why does contango result in negative roll yield?
In a contango market, rolling into a more expensive futures contract means buying high and selling low repeatedly, which erodes returns over time.
6. Can backwardation be sustained long-term?
Backwardation is often short-lived and driven by temporary factors like supply shocks or seasonal demand. It typically shifts back to contango as conditions normalize.
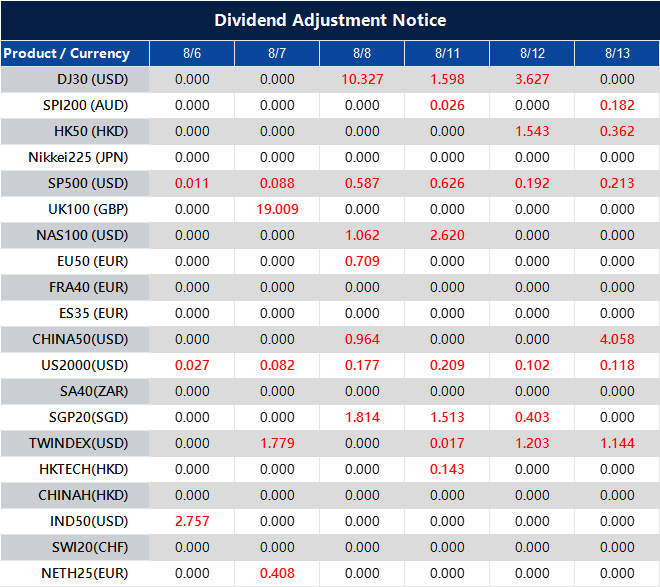
Please note that the dividends of the following products will be adjusted accordingly. Index dividends will be executed separately through a balance statement directly to your trading account, and the comment will be in the following format “Div & Product Name & Net Volume”.
Please refer to the table below for more details:
The above data is for reference only, please refer to the MT4/MT5 software for specific data.
If you’d like more information, please don’t hesitate to contact info@vtmarkets.com.
Markets opened the week on a positive note as signs of a slowing US economy raised hopes for interest rate cuts. While softer job data might typically worry investors, it’s now fuelling confidence that the Federal Reserve could ease policy – setting the tone for a cautious but optimistic August.
The bullish momentum followed a weaker-than-expected US jobs report, which strengthened investor expectations that the Federal Reserve could begin cutting interest rates as early as next month.
The benchmark index led the broader advance, with the Dow Jones Industrial Average climbing 585 points – a 1.3% gain – while the tech-focused Nasdaq Composite jumped 2%.
Notably, small-cap stocks also joined the rally, pointing to wider market participation beyond just mega-cap tech names.
This broad-based move suggests that investors quickly brushed off the initial concerns sparked by Friday’s disappointing employment data.
Cooling job market reshapes Fed outlook
Investor sentiment shifted significantly following the latest Non-Farm Payrolls report released last Friday.
The US economy added just 73,000 jobs in July – well below expectations – and revisions for May and June showed substantially lower figures than previously reported.
In response, market participants have drastically recalibrated their expectations for monetary policy.
According to futures markets, there is now a 92.1% chance the Federal Reserve will cut interest rates in September – up sharply from the 38% probability priced in before the jobs report was released.
This growing divergence between softening economic indicators and the Fed’s recent guidance has increased the likelihood of policy easing.
Last month’s Consumer Price Index (CPI) report added to this view, revealing that core inflation declined for a third straight month – further fuelling hopes of a rate cut.
Market analysis: August volatility poses fresh test for bulls
As traders enter August – a historically turbulent month for equities – caution may be warranted.
The Dow Jones Industrial Average has delivered its worst monthly performance in August since 1988, and similar seasonal weakness often affects both the S&P 500 and Nasdaq.
Tomorrow wraps July, historically the most bullish month for the S&P 500 over the past 20 years.
But don’t get too comfortable. August and September? Historically choppy. September is the worst month on record.
This backdrop means traders should be prepared for increased market volatility. The continuation of the recent rally will likely depend on incoming data that confirms a cooling US economy, maintaining pressure on the Federal Reserve to act.
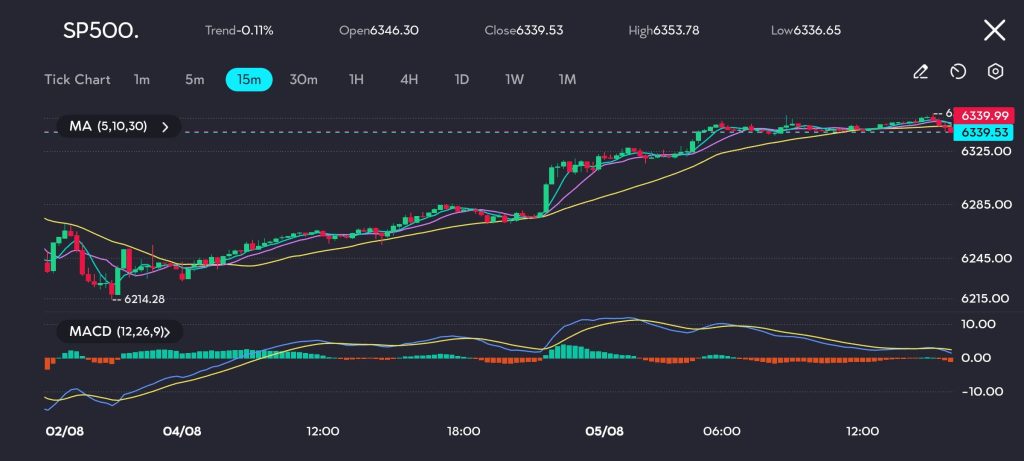
Technically, the S&P 500 has shown strong gains since 2 August, as seen on the 15-minute chart, followed by a consolidation phase.
The early-week momentum appears to be fading, suggesting potential for a near-term pullback. Currently, the index sits at a pivotal level, with technical indicators pointing to possible downside risk.
Picture: SP500 hovers near 6340 after a rebound from 6214, but upside momentum appears to be fading, as seen on the VT Markets app.
The first key level to monitor is the lower boundary of the consolidation range at 6336.65. A break below this zone could lead to a test of deeper support.
The 30-period moving average – around 6325 – is another crucial marker. A close below this level would indicate the uptrend is losing steam and a more meaningful correction may be underway.
Looking ahead, traders are focused on the upcoming Initial Jobless Claims report due Thursday, 7 August.
This data release could either reinforce the market’s current optimism for rate cuts or challenge it – depending on whether further signs of labour market weakness emerge.
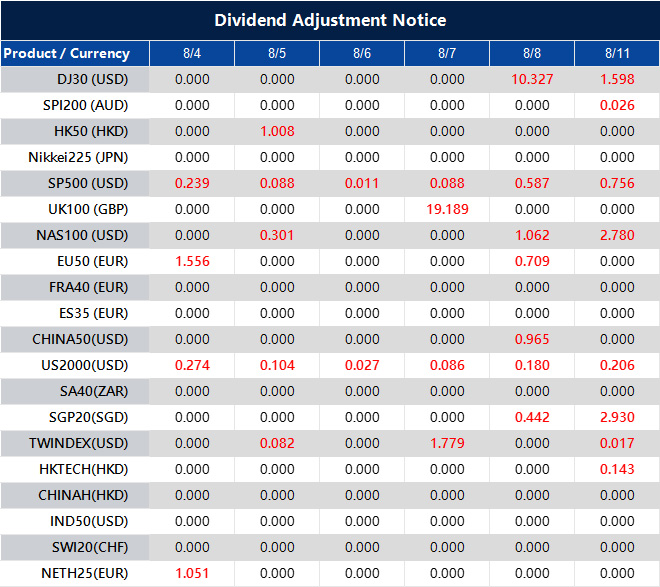
Please note that the dividends of the following products will be adjusted accordingly. Index dividends will be executed separately through a balance statement directly to your trading account, and the comment will be in the following format “Div & Product Name & Net Volume”.
Please refer to the table below for more details:
The above data is for reference only, please refer to the MT4/MT5 software for specific data.
If you’d like more information, please don’t hesitate to contact info@vtmarkets.com.
5 August 2025, Sydney, Australia – VT Markets‘ 10 week global trading competition, VT Trading Arena, has reached new milestones, reinforcing its status as one of the premier global trading events of the year as traders compete for a share of the remarkable USD1,000,000 prize pool.
The VT Trading Arena has witnessed an overwhelming global response, attracting traders of all experience levels. This impressive turnout reflects the international appeal of the competition, which has united traders from various regions and backgrounds.
Total Trading Volume Surpasses USD2B in the First 4 Weeks: This immense trading activity is a clear reflection of the serious stakes participants are playing for and the competitive spirit that defines the event.
Most Traded Symbols: The most-traded symbols in the competition reveal valuable insights into the strategies of global traders. High-volume Forex pairs, such as EUR/USD, GBP/USD, and USD/JPY, dominate the leaderboard. This strategic focus on major currency pairs underscores the importance of liquidity and price movements in shaping effective trading strategies. As traders adapt their approaches to market conditions, these popular pairs remain at the heart of the action.
USD300,000 Awarded Through Spin the Wheel: A key feature of the competition, the Spin the Wheel reward mechanism, has already distributed over USD300,000 in cash prizes and additional rewards. Participants have enjoyed multiple opportunities to win various prizes, including cash payouts, trading vouchers, and exclusive event tickets, adding an extra layer of excitement to the competition.
The VT Trading Arena rewards participants throughout the competition, with the top trader every 5 weeks receiving a grand prize of USD10,000. Second and third place finishers are awarded USD7,000 and USD3,000, respectively, providing further motivation to remain engaged.
For more information on how to participate, eligibility requirements, and the full list of prizes, please visit: https://vttradingarena.com/
*Terms and Conditions apply.
Upcoming Promotions
Adding to the excitement of the VT Trading Arena, VT Markets are rolling out a series of upcoming flash sale promotions:
10-Day Flash Sale (August 25 – Sep 3): Earn up to $300 cashback when you trade with selected group of US and metal products!
5-Day Limited-Time Offer (August 18-22): Stand a chance to win a 14-inch MacBook Pro with every $500 deposit in BTCUSD/ETHUSD.
About VT Markets
VT Markets is a regulated multi-asset broker with a presence in over 160 countries as of today. It has earned numerous international accolades including Best Online Trading and Fastest Growing Broker. In line with its mission to make trading accessible to all, VT Markets offers comprehensive access to over 1,000 financial instruments and clients benefit from a seamless trading experience via its award-winning mobile application.
Understanding the difference between hawkish and dovish monetary policy is essential for interpreting central bank decisions and their impact on financial markets. Dovish and hawkish are contrasting approaches in monetary policy, with each stance representing a different response to inflation, interest rates, and economic growth. The contrast between these two approaches helps explain how institutions like the Federal Reserve respond to changing economic conditions. In this article, we explain the meaning of hawkish vs dovish, highlight their key differences, and explore how each stance can influence major markets—using real-life examples to bring the concepts to life.
What Does Hawkish Mean?
A hawkish stance in monetary policy refers to a central bank’s preference for raising interest rates to control inflation. Policymakers with a hawkish outlook, often called hawks, see inflation as a primary risk to economic stability and act proactively to prevent it from spiraling. The primary goal of hawkish policy is to control inflation, even if it comes at the expense of economic growth or employment. An inflation hawk is a policymaker who prioritizes controlling inflation through higher interest rates and a hawkish stance. This often involves tightening monetary conditions—such as reducing asset purchases or increasing rates—even if it slows economic growth or raises borrowing costs. A hawkish central bank signals that maintaining price stability takes precedence over short-term economic growth.
Example: In 2022, the U.S. Federal Reserve adopted a hawkish tone by raising interest rates multiple times to combat rising inflation. This shift aimed to slow down borrowing and reduce consumer spending to bring prices under control.
Hawkish meaning in short: A policy approach focused on tightening monetary conditions to control inflation.
What Does Dovish Mean?
A dovish stance in monetary policy reflects a central bank’s preference for lower interest rates to support economic growth and reduce unemployment. Doves tend to focus on stimulating the economy and are more tolerant of higher inflation if it means supporting job creation and economic expansion. Policymakers with dovish tendencies generally advocate for expansionary policies, such as looser monetary policy, which involves lowering interest rates and increasing the money supply to encourage borrowing, spending, and investment. Reducing unemployment is a key objective of dovish policy, as these measures are designed to boost hiring and stabilize the labor market. An economic policy advisor may recommend dovish strategies to promote growth, especially during periods of slow growth or recession. While it may lead to higher inflation over time, the main goal of a dovish approach is to boost economic activity and stabilize the labor market.
Example: In response to the COVID-19 pandemic, many central banks, including the European Central Bank and the U.S. Federal Reserve, implemented dovish policies by cutting interest rates to near zero and introducing stimulus measures.
Dovish meaning in short: A monetary policy approach aimed at promoting economic growth through accommodative measures.
Hawkish vs Dovish: What Are the Key Differences?
In monetary policy discussions, the terms ‘hawks and doves’ are commonly used as metaphors to describe contrasting stances: ‘hawks’ favor tighter policies to control inflation, while ‘doves’ support looser policies to encourage growth and employment.
Below is a clear comparison of dovish vs hawkish policies, highlighting the hawkish and dovish tendencies that central banks may adopt. The terms hawkish and dovish refer to these opposing approaches, with ‘hawkish’ indicating a focus on inflation control and ‘dovish’ emphasizing economic growth.
Feature
Hawkish Policy
Dovish Policy
Interest Rates
Higher rates to reduce inflation
Lower rates to stimulate growth
Economic Priority
Price stability and inflation control
Economic expansion and employment
Policy Tools
Rate hikes, balance sheet reductions
Rate cuts, quantitative easing
Market Perception
Strong currency, cautious stock market
Weaker currency, bullish equities
Common During
High inflation periods
Economic recessions or slowdowns
1. Interest Rates
Hawkish: A hawkish central bank raises interest rates to slow down economic activity. High interest rates make it more expensive to borrow, which discourages both consumers and businesses from taking out loans, mortgages, and credit. As borrowing becomes costlier, spending and investment tend to decrease. The goal is to reduce demand in the economy and prevent inflation from rising too quickly.
Dovish: A dovish central bank lowers interest rates to stimulate the economy. Lower borrowing costs encourage consumers and businesses to spend and invest more, which helps support economic growth, especially during downturns or weak demand periods.
2. Economic Priority
Hawkish: The main focus is on controlling inflation and maintaining price stability. Hawkish policymakers are willing to sacrifice short-term growth or tolerate higher unemployment to keep inflation in check.
Dovish: The priority is promoting economic growth and supporting employment. Dovish policymakers are more comfortable with slightly higher inflation if it helps create jobs and drives economic recovery. Their goal is often to stimulate economic growth and create more jobs through measures such as lowering interest rates and quantitative easing.
3. Policy Tools
Hawkish: Typical tools include raising interest rates, reducing the central bank’s balance sheet, and limiting liquidity in the financial system. These measures tighten financial conditions to cool off an overheating economy. Implementing a tighter monetary policy helps control inflation but can also restrict economic growth and impact currency value.
Dovish: Tools often include cutting interest rates, purchasing financial assets (quantitative easing), and increasing liquidity. By increasing the supply of money, these actions are designed to ease financial conditions and encourage spending and investment.
4. Market Perception
Hawkish: Markets often react to hawkish policies with a stronger currency, especially in forex markets, as investors seek higher yields. These policies are often implemented to prevent rising prices and price increases by controlling inflation through higher interest rates. However, higher rates can dampen stock market performance, particularly in interest-sensitive sectors like technology and real estate.
Dovish: Dovish policies typically lead to a weaker currency due to lower interest rates, which reduce returns on investment. However, equity markets often respond positively because cheap credit can boost corporate profits and encourage investment.
5. Common Economic Conditions
Hawkish: This stance is usually adopted when inflation is rising too quickly or when the economy is growing too fast, risking overheating. It is used as a corrective measure to cool down demand and restore balance. Sometimes, a hawkish stance is necessary to prevent runaway inflation, which can occur if demand exceeds supply and prices spiral out of control.
Dovish: A dovish approach is common during economic slowdowns, recessions, or periods of low inflation. Central banks use it to stimulate demand, boost consumer confidence, and support recovery efforts.
Pros and Cons of a Hawkish Monetary Policy
A hawkish monetary policy aims to control inflation and maintain price stability, but it also carries certain trade-offs.
Pros:
Controls inflation effectively: By raising interest rates, a hawkish policy reduces consumer demand, which helps bring inflation under control and protect purchasing power.
Strengthens the national currency: Higher interest rates often attract foreign capital, increasing demand for the currency and supporting exchange rate stability.
Prevents overheating of the economy: Slowing down excessive spending and investment helps reduce the risk of asset bubbles and unsustainable growth.
Cons:
May slow down economic growth: Tighter monetary conditions can discourage business expansion and consumer spending, which may lead to a slowdown in GDP.
Increases borrowing costs: Loans, mortgages, and credit become more expensive, affecting both households and businesses financially.
Can lead to higher unemployment in the short term: As growth slows, companies may cut back on hiring or lay off workers, particularly in interest-sensitive industries.
Pros and Cons of a Dovish Monetary Policy
A dovish monetary policy focuses on stimulating economic growth, but like any approach, it comes with both benefits and potential drawbacks.
Pros:
Encourages borrowing and investment: Lower interest rates make it cheaper for businesses to finance expansion and for consumers to spend more confidently.
Stimulates job creation and economic growth: Easier access to credit can lead to increased hiring, consumer demand, and overall economic activity.
Supports financial markets during downturns: Dovish policies often provide a safety net for markets by boosting liquidity and investor confidence.
Cons:
Can trigger inflation if overused: Prolonged low interest rates can overheat the economy and push prices up too quickly, eroding value.
May weaken the currency: Lower rates reduce foreign investment appeal, which can put downward pressure on the currency.
Reduces returns for savers: Interest earnings from savings accounts and fixed-income investments decline, affecting retirees and conservative investors.
How These Stances Affect Financial Markets
Understanding whether a central bank is hawkish or dovish helps traders and investors anticipate market trends. A hawkish tone usually leads to a stronger currency and weaker equity markets, especially in interest-sensitive sectors. On the other hand, a dovish stance often boosts stock markets but can lead to currency depreciation and higher commodity prices.
Hawkish Policy: Typically strengthens the national currency. Higher interest rates attract foreign capital as investors seek better returns, increasing demand for the currency. For example, a hawkish U.S. Federal Reserve often results in a stronger U.S. dollar against major currencies like the euro or yen.
Dovish Policy: Usually weakens the currency. Lower rates reduce the appeal of holding that currency, leading to outflows. This can make exports more competitive but may reduce international investment.
Hawkish Policy: This can put downward pressure on equities, especially in growth-sensitive sectors like technology. Higher interest rates increase borrowing costs and reduce corporate profits, making stocks less attractive.
Dovish Policy: Often supports stock market growth. Lower rates reduce financing costs, boost consumer spending, and encourage risk-taking in equities, particularly in sectors that benefit from cheap credit.
Hawkish Policy: This may lead to short-term declines in major indices such as the S&P 500 or Nasdaq. Investors often rotate into safer assets or defensive sectors during periods of tightening.
Dovish Policy: Typically drives indices higher due to increased liquidity and stronger investor sentiment. Growth-oriented indices tend to benefit the most from low interest rates.
Hawkish Policy: This can lead to lower commodity prices, particularly for gold, as rising rates increase the opportunity cost of holding non-yielding assets. A stronger currency also makes commodities more expensive in other currencies, dampening demand.
Dovish Policy: Often supports commodity prices, especially precious metals like gold and silver, which are seen as inflation hedges. Lower rates and a weaker currency can also boost demand for oil and industrial metals.
Hawkish Policy: Usually causes bond prices to fall and yields to rise. Investors demand higher returns in a rising rate environment, and existing bonds with lower yields become less attractive.
Dovish Policy: Supports bond prices and keeps yields low. Central bank bond purchases (quantitative easing) also increase demand, pushing prices higher and yields lower.
In Summary
Understanding the key differences between hawkish vs dovish monetary policies is vital for anyone involved in the financial markets. Hawkish policies are designed to fight inflation and stabilize currency strength, while dovish policies prioritize growth and employment support. Both have their place in economic management, and their effectiveness depends on timing and execution. By keeping an eye on central bank statements and economic indicators, investors can make more strategic decisions, aligning their trades with the prevailing monetary stance.
Start Trading Today with VT Markets
At VT Markets, we provide traders with powerful tools and expert insights to navigate any market condition—whether shaped by hawkish or dovish monetary policy. Trade with confidence on MetaTrader 4 (MT4) and MetaTrader 5 (MT5), industry-leading platforms offering fast execution, advanced charting, and competitive spreads across a wide range of assets. If you need assistance, our dedicated Help Centre is always ready to support you.
Start trading with VT Markets today and experience the advantage of a broker focused on your long-term success.
Frequently Asked Questions (FAQs)
1. What does hawkish mean in monetary policy?
Hawkish refers to a central bank’s stance that focuses on controlling inflation, often through higher interest rates and tighter financial conditions.
2. What does dovish mean in monetary policy?
Dovish describes a policy approach that prioritizes economic growth and employment, typically involving lower interest rates and accommodative measures.
3. What is the difference between hawkish and dovish?
Hawkish means focusing on controlling inflation through tighter policies like raising interest rates, while dovish means prioritizing growth and job creation with measures like lowering rates.
4. Can a central bank be both hawkish and dovish?
Yes. Central banks often balance between the two depending on economic conditions. They may shift from dovish to hawkish based on inflation trends or vice versa.
5. Can a central bank change its stance quickly?
Yes. Central banks can shift from dovish to hawkish or vice versa if economic conditions, inflation data, or geopolitical risks change significantly.
6. Why do markets react strongly to hawkish or dovish comments?
Markets are highly sensitive to changes in interest rates and monetary policy signals. A shift in tone can impact currencies, stocks, bonds, and commodities.
7. How can traders benefit from understanding dovish vs hawkish policies?
Recognizing these stances helps traders anticipate market trends, manage risk, and position their portfolios in line with central bank directions.
Oil markets are navigating competing forces this week, with traders balancing fresh OPEC+ supply signals against rising geopolitical tensions and shifting expectations for US rate cuts.
WTI crude rises ahead of OPEC+ output increase
WTI crude futures moved higher as markets evaluated the impact of an upcoming OPEC+ production increase, possible sanctions on Russian oil, and growing expectations of interest rate cuts from the Federal Reserve.
West Texas Intermediate (WTI) crude prices advanced toward $67.50 per barrel on Monday, recovering after an initial sell-off triggered by fresh output plans from the Organisation of the Petroleum Exporting Countries and its allies (OPEC+).
Demand for all primary fuels is set to increase to 2050, with the exception of coal. Demand for other renewables (mostly wind and solar) is set to see the largest increase at 40.5 mboe/d over this period. Demand for oil and gas is also expected to increase, in line with the need… pic.twitter.com/Cr07BhQGUl
The group announced a planned production increase of 547,000 barrels per day starting in September, aiming to regain market share lost over the past year.
However, this additional supply could act as a cap on prices in the near term, particularly as WTI approaches the key $70 resistance level.
A cautious market outlook suggests gains may be limited without stronger demand or further supply disruptions.
US pressure on Russian oil could trigger supply shock
The United States is stepping up diplomatic efforts to discourage India from purchasing Russian crude oil.
This strategic move coincides with President Donald Trump’s stated goal of brokering a Ukraine peace deal by 8 August.
American officials have reportedly warned their Indian counterparts of potential punitive actions, including 100% secondary sanctions targeting any entity that continues to buy Russian oil.
If enforced, these sanctions could jeopardise up to 2.75 million barrels per day of Russian exports — much of which currently flows to China and India.
Such a sharp reduction in global supply could cause prices to spike quickly as traders react to the sudden shortfall.
At the same time, a weaker-than-expected US jobs report for July has raised expectations of Federal Reserve rate cuts. Easing monetary policy would likely stimulate economic activity and boost oil demand.
As a result, expectations of lower interest rates may create a solid price floor, providing support even in the face of increased supply from OPEC+.
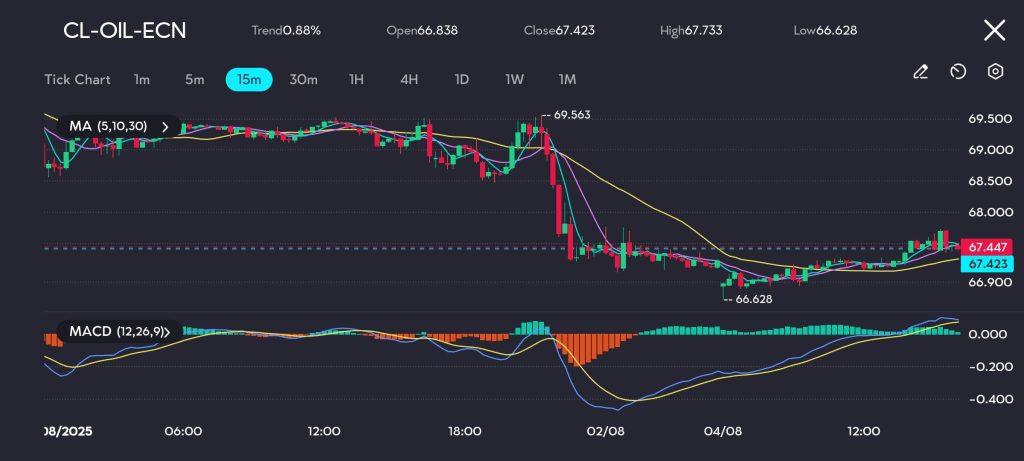
Technical analysis: Crude stabilises after sharp drop
The technical picture for WTI crude oil is currently leaning bullish, following a recent sharp decline and rebound.
After falling from above $69.00 on 2 August, prices found solid support at $66.628 — a level that has since triggered a modest recovery.
Picture: WTI crude finds support near $66.63 and begins a recovery, with MACD momentum turning positive, as seen on the VT Markets app.
Crude is now trading near $67.447, showing signs of stabilisation as traders digest the latest OPEC+ supply news and broader macroeconomic factors.
The recovery suggests renewed buying interest, although momentum remains cautious.
Traders should watch for a breakout above immediate resistance at $67.733. A confirmed move higher, particularly with rising volume, could pave the way for a test of the $68.000 level.
Continued bullish divergence in the MACD indicator would further reinforce this positive short-term outlook.
Please note that the dividends of the following products will be adjusted accordingly. Index dividends will be executed separately through a balance statement directly to your trading account, and the comment will be in the following format “Div & Product Name & Net Volume”.
Please refer to the table below for more details:
The above data is for reference only, please refer to the MT4/MT5 software for specific data.
If you’d like more information, please don’t hesitate to contact info@vtmarkets.com.
The NASDAQ 100 is a major stock market index that includes 100 of the largest non-financial companies listed on the NASDAQ exchange. It is heavily weighted toward technology, featuring industry leaders like Apple, Microsoft, Amazon, and NVIDIA. Known for its growth potential and innovation-driven focus, the index attracts both investors and traders looking to capitalize on market trends. In this guide, you’ll learn what the NASDAQ 100 is, which companies are included, how it compares to other indices, and how to start trading it effectively.
What Is the NASDAQ?
The NASDAQ, short for the National Association of Securities Dealers Automated Quotations, is a major global stock exchange known for its fully electronic trading system. Launched in 1971, it was the first exchange to enable automated trading, making it faster and more accessible than traditional floor-based exchanges like the New York Stock Exchange (NYSE).
Today, the NASDAQ is home to many of the world’s most innovative and growth-oriented companies. It is especially dominant in the technology sector, with listings that include Apple, Microsoft, Amazon, and NVIDIA. While the NYSE is often associated with older, more established firms, the NASDAQ has become the go-to exchange for companies in tech, biotech, e-commerce, and other forward-looking industries.
Because of its strong focus on innovation, the NASDAQ plays a central role in global markets and serves as the foundation for major indices like the NASDAQ 100.
NASDAQ Trading Hours
The Nasdaq Stock Market operates during regular trading hours from 9:30 a.m. to 4:00 p.m. Eastern Time, Monday through Friday. During these hours, investors can trade a wide range of securities listed on the exchange, including stocks, options, and ETFs.
For those seeking additional flexibility, the Nasdaq also offers extended trading hours:
Pre-market trading: 4:00 a.m. to 9:30 a.m. ET
After-hours trading: 4:00 p.m. to 8:00 p.m. ET
While these extended sessions allow investors to react to news and events outside of regular hours, it’s important to note that trading volumes and liquidity may be lower, which can affect pricing and execution. Whether trading during standard or extended hours, the Nasdaq Stock Market provides investors with access to some of the world’s most dynamic companies.
The NASDAQ 100 is a stock market index that tracks the 100 largest non-financial companies listed on the NASDAQ exchange, ranked by market capitalization. While it excludes banks and insurance firms, it includes major players across sectors like technology, healthcare, consumer services, and industrials.
The index uses a modified market-cap weighting, which means larger companies like Apple and Microsoft have more influence on its performance. To stay current, the NASDAQ 100 is reviewed and rebalanced quarterly, ensuring it reflects the top-performing and most relevant companies on the exchange.
What Are the Companies in the NASDAQ 100?
If you’re wondering what is in the NASDAQ 100, the index is made up of the 100 largest non-financial companies listed on the NASDAQ exchange, ranked by market capitalization. These companies span industries such as technology, consumer services, healthcare, and industrials, though the index is heavily weighted toward technology firms.
The NASDAQ 100 includes many of the most recognized and influential companies in the world. These are businesses that shape global innovation, commerce, and consumer trends. Together, the top 10 companies make up more than half of the index’s total weight, meaning their performance can significantly impact the index’s overall movement.
Below is a table showing the top 10 companies in the NASDAQ 100, along with their ticker symbols, estimated market capitalizations (as of mid-2025), and their approximate weight in the index:
Note: Market cap and index weight figures are estimates based on the most recent available data. Exact values may change as the market fluctuates or during quarterly index rebalancing.
The NASDAQ 100 index (NDX) has shown strong long-term growth, especially during periods of tech sector expansion. However, it can also be highly volatile in response to macroeconomic shifts.
Here’s how the index has performed in recent years:
2020: Gained approximately +47%, rising from around $8,800 to over $13,000 by year-end, fueled by demand for digital services during the pandemic.
2021: Added another +27%, reaching nearly $16,500 as tech and consumer stocks continued to rally.
2022: Fell about -33%, dropping to around $11,000 due to inflation concerns and rising interest rates.
2023: Rebounded strongly with a +43% gain, ending the year above $15,700, led by the surge in AI, semiconductors, and large-cap tech earnings.
Note: Price levels are approximate closing values of the NASDAQ 100 (NDX) and are rounded for clarity.
This historical data highlights the index’s strong growth potential, while also reminding investors of its susceptibility to volatility, particularly due to its heavy exposure to the technology sector.
How to Trade or Invest in the NASDAQ 100
If you’re looking to gain exposure to the NASDAQ 100 index, here’s a simple step-by-step guide to get started, whether you’re an investor or an active trader.
Step 1: Understand the NASDAQ 100
Start by learning what the index represents, its sector breakdown, and how its top companies influence price movement.
Step 2: Choose Your Trading Method
Decide whether to invest through ETFs, trade CFDs for flexibility and leverage, or use futures and options if you’re more advanced.
Protect your capital by applying risk management strategies such as keeping position sizes small, using stop-losses, and avoiding over-leverage — especially in volatile conditions.
Step 8: Monitor and Manage Your Position
Track price action, review economic updates, and adjust your trade if necessary. Close the trade when your target is met or conditions change.
NASDAQ 100 vs. Other Major Indices
The NASDAQ 100 is often compared with other major U.S. indices like the S&P 500, Dow Jones, and Russell 2000. While all of them track large portions of the U.S. stock market, each one has a different composition and market focus.
The table below highlights the key differences between these indices, helping you understand how the NASDAQ 100 fits into the broader market landscape:
Index
Composition
Key Sector Weighting
NASDAQ 100
100 largest non-financial NASDAQ stocks
Technology-heavy
S&P 500
500 largest US companies across sectors
Broad sector representation
Dow Jones (DJIA)
30 large US companies
Industrial and legacy firms
Russell 2000
2000 small-cap US companies
Small-cap focus
The NASDAQ 100 stands out for its strong focus on high-growth and innovation-led companies, especially in technology. In contrast, the S&P 500 offers more sector diversification, while the Dow Jones reflects more mature, industrial firms, and the Russell 2000 targets smaller, emerging businesses.
In Summary
The NASDAQ 100 is a major stock index made up of 100 of the largest non-financial companies listed on the NASDAQ exchange.
It is dominated by technology and consumer-focused companies, many of which are global leaders.
The index has delivered strong returns historically, but can also be volatile.
Investors can access it through ETFs, futures, CFDs, and options.
Understanding what is in the NASDAQ 100 helps you make informed decisions, especially if you focus on innovation-driven sectors.
It is widely followed by traders and analysts as a benchmark for growth stocks and tech-sector performance.
Start Trading the NASDAQ 100 Today with VT Markets
With competitive spreads, lightning-fast execution, and a user-friendly interface, VT Markets allows you to trade one of the world’s most influential indices confidently—whether you’re aiming for short-term price movements or long-term tech-sector exposure.
The NASDAQ 100 is a stock market index that includes 100 of the largest non-financial companies listed on the NASDAQ exchange. It mainly features technology, consumer, and healthcare companies.
2. What companies are in the NASDAQ 100?
Some of the top companies include Apple, Microsoft, Amazon, NVIDIA, Meta Platforms, and Alphabet. The full list is updated quarterly and reflects the largest and most traded non-financial companies on the NASDAQ.
3. How can I invest or trade in the NASDAQ 100?
You can invest via ETFs like QQQ, or trade it through futures, CFDs, and options. Platforms like VT Markets offer flexible access via CFDs with tools for both new and experienced traders.
4. Is the NASDAQ 100 only tech companies?
While the index is technology-heavy, it also includes companies from consumer services, healthcare, industrials, and communication sectors.
5. Can I trade the NASDAQ 100 with VT Markets?
Yes. VT Markets offers trading on the NASDAQ 100 through CFDs on MetaTrader 4 and MetaTrader 5 platforms, with competitive spreads and a user-friendly interface.
6. Is the NASDAQ 100 a good investment?
The NASDAQ 100 has shown strong historical performance, particularly during tech-led market cycles. However, it can be volatile, so it may suit investors who are seeking growth and can tolerate short-term fluctuations.