


Basic to Expert: Start trading effortlessly, and become a professional

Take a journey from beginner to expert with our webinar, ‘Basic to Expert: Start Trading Effortlessly.’ We’ll guide you through trading essentials, offering insights and strategies to make your transition smooth. Learn to navigate the markets confidently, turning beginner steps into pro moves.
Stocks Surge Close to Record Highs in Year-End Rally; Currency Markets Await Fed’s Next Moves
The markets witnessed a surge as major indices edged closer to historic peaks in the final week of the year. The S&P 500, Nasdaq Composite, and Dow Jones Industrial Average all marked significant gains, with the Nasdaq 100 hitting a new all-time high. Wall Street’s bullish run continued, fueled by optimism stemming from encouraging inflation data aligning with the Federal Reserve’s targets. Meanwhile, the USD/JPY pair saw movement, while the Australian Dollar stood strong against a subdued US Dollar, influenced by potential central bank stances. Furthermore, developments in China’s industrial profits hinted at a slowdown, impacting trade relations and currency movements. In the currency markets, the EUR/USD pair maintained stability, influenced by data-driven decisions by the ECB and prevailing market sentiment, as economic data remained minimal.
Stock Market Updates
Stocks surged at the onset of the final week of the year, propelling major indices closer to historic peaks. The S&P 500 escalated by 0.42% to reach 4,774.75, nearing its all-time high of 4,796.56 from January 2022. Similarly, the Nasdaq Composite surged by 0.54% to settle at 15,074.57, while the Dow Jones Industrial Average gained 159.36 points, closing at 37,545.33, marking a 0.43% increase. The Nasdaq 100 notably climbed by 0.6%, achieving a new all-time high and ending at 16,878.46.
The market’s bullish trajectory persisted as the S&P 500 approached record levels, merely less than 1% away from its previous peak. Wall Street sustained this momentum, with the S&P 500 marking its eighth consecutive weekly advance, the lengthiest streak since 2017, and similar winning streaks observed in the Dow and Nasdaq Composite. Investor optimism soared following encouraging inflation data indicating a closer alignment with the Federal Reserve’s 2% target. Moreover, the anticipation of potential rate cuts in the upcoming year further bolstered equities, contributing to recent weeks’ market upswings.
Data by Bloomberg
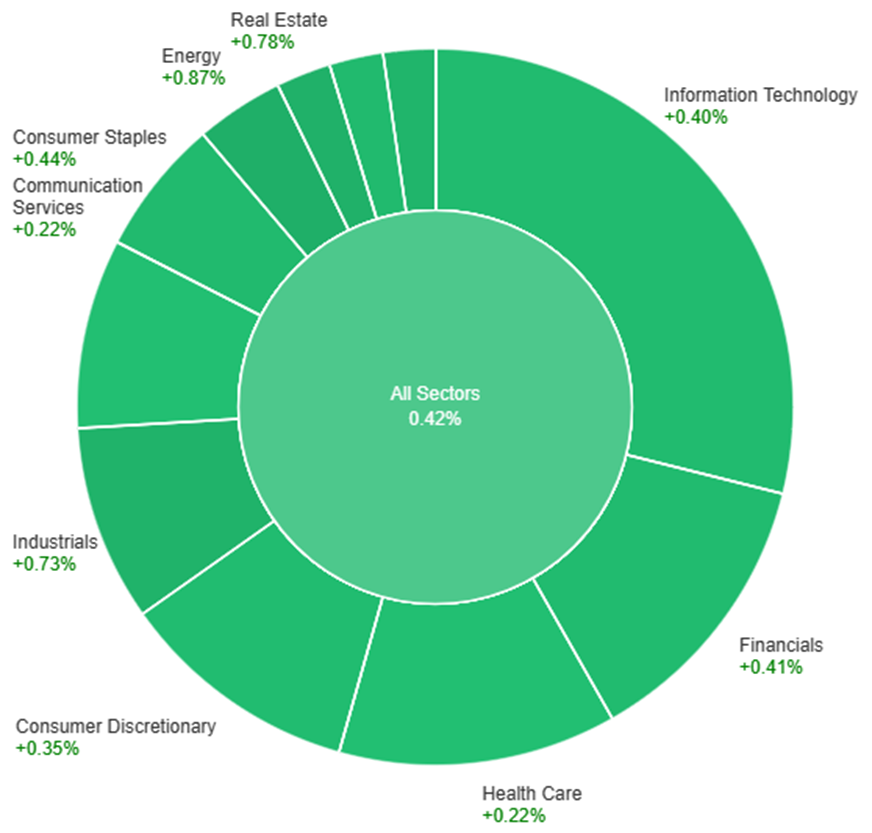
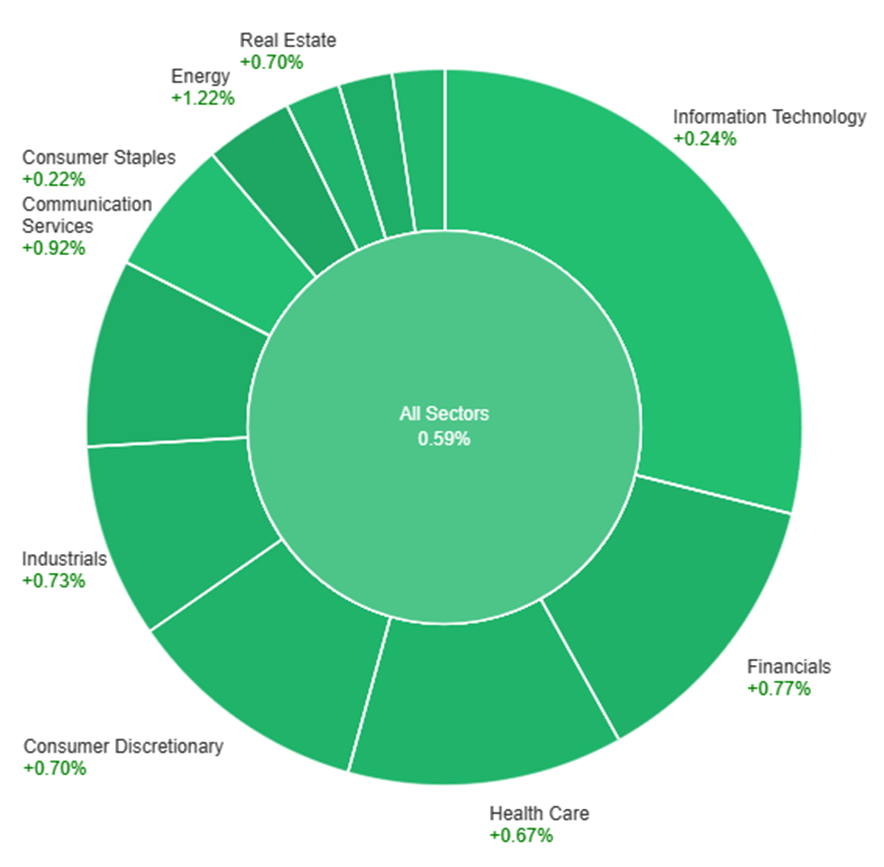
On Tuesday, across various sectors, the market saw a positive trend with a general increase in most sectors. Energy stood out with a notable rise of 0.87%, leading the charge, followed closely by Real Estate at 0.78% and Industrials at 0.73%. Utilities and Materials showed moderate gains at 0.65% and 0.44% respectively, aligning with Consumer Staples also at 0.44%. Financials and Information Technology both saw increases of around 0.4%, while Consumer Discretionary showed a slight uptick of 0.35%. Communication Services and Health Care trailed the pack with a smaller increase of 0.22% each. Overall, the market demonstrated positive momentum, particularly in the Energy and Real Estate sectors on Tuesday.
Currency Market Updates
The USD/JPY pair experienced upward movement, reaching 142.84 after the Bank of Japan’s Summary of Opinions release, with the market showing quiet activity amidst the holiday season’s thin trading. The BoJ hinted at potential policy shifts if the wage-price cycle strengthens but has not finalized the timing for such changes. Meanwhile, in the US, the latest Core PCE figures fell slightly below expectations, signaling a 3.2% YoY growth in November, potentially influencing the Federal Reserve’s future interest rate decisions. Amidst these developments, the currency market awaits the US Richmond Fed Manufacturing Index and Initial Jobless Claims for further insights, but their impact might be limited given the prevailing light trading conditions.
Concurrently, the Australian Dollar stood at a five-month high against a subdued US Dollar, backed by the Australian central bank’s potential hawkish stance in early 2024 due to robust inflation. However, China’s reported decline in Industrial Profits for January to November by 4.4% hints at a slowdown, prompting expectations for additional policy support to bolster the second-largest global economy. This slowdown could impact the RBA’s stance, considering the significance of trade relations between Australia and China. The weakening US Dollar Index, influenced by Fed easing speculations and declining Treasury yields, further highlights the prevailing pressure on the Greenback.
On the EUR/USD front, the pair traded near August’s highest level around 1.1040, encountering minimal losses. The Core PCE figures in the US slightly missed expectations, growing 3.2% YoY, while the Eurozone witnessed a consistent ECB policy stance, with no change in interest rates. The ECB’s data-driven decisions, clarified by President Christine Lagarde, and the slightly more hawkish tone from ECB Vice President Luis de Guindos may contribute to lifting the Euro and maintaining stability for the EUR/USD pair. However, with minimal top-tier economic data expected, market sentiment remains a crucial factor influencing the pair’s movement.
Picks of the Day Analysis
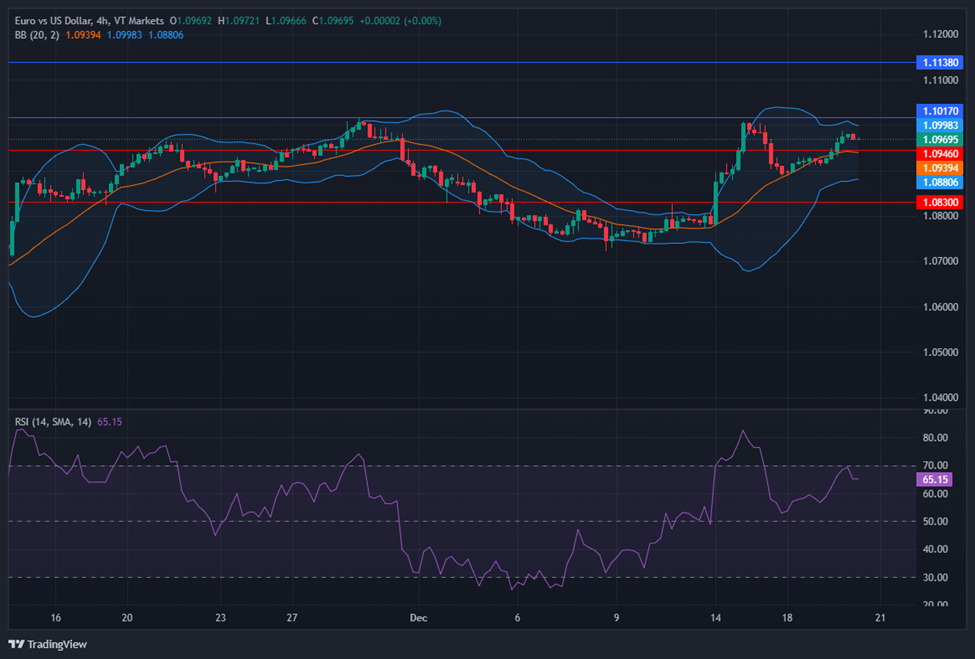
EUR/USD (4 Hours)
EUR/USD Sees Mild Losses Amidst Light Trading
The EUR/USD pair hovers near 1.1037, experiencing marginal setbacks amidst subdued trading conditions. The Federal Reserve’s favored inflation metric, the Core PCE, exhibited a 3.2% year-on-year growth, slightly under the anticipated 3.3%, further affecting the US Dollar’s stance. Conversely, ECB statements from President Christine Lagarde emphasized the bank’s data-dependent approach, dismissing market pressures. Eurozone outlook remained cautiously optimistic, with ECB Vice President Luis de Guindos highlighting a reluctance to alter monetary policy prematurely. As economic calendars lack major data releases, the EUR/USD trend hinges on prevailing market sentiment, potentially swayed by upcoming US Richmond Fed Manufacturing Index and Initial Jobless Claims reports, influencing near-term price movements.
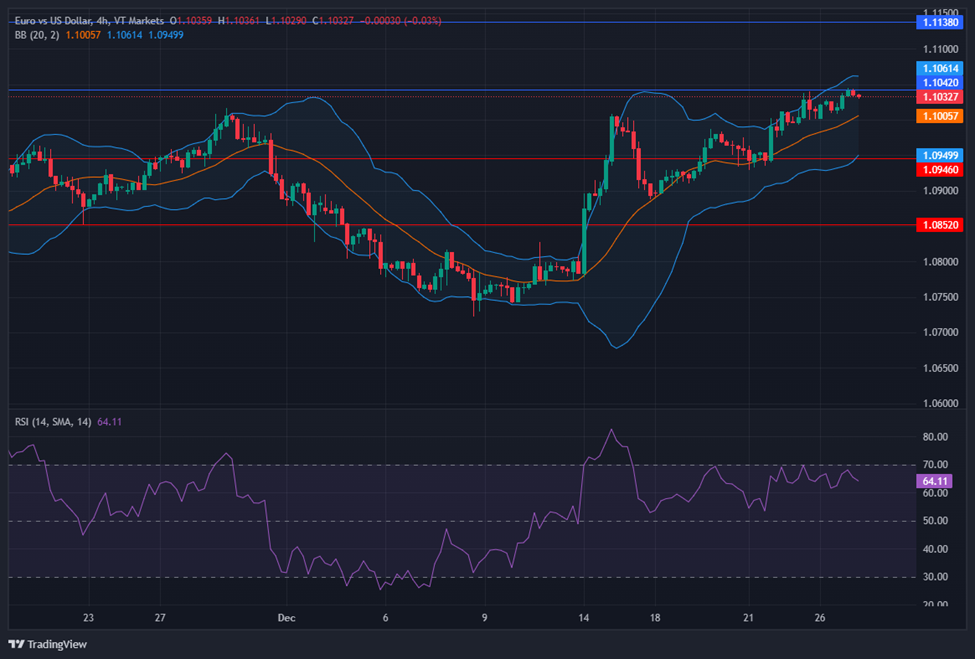
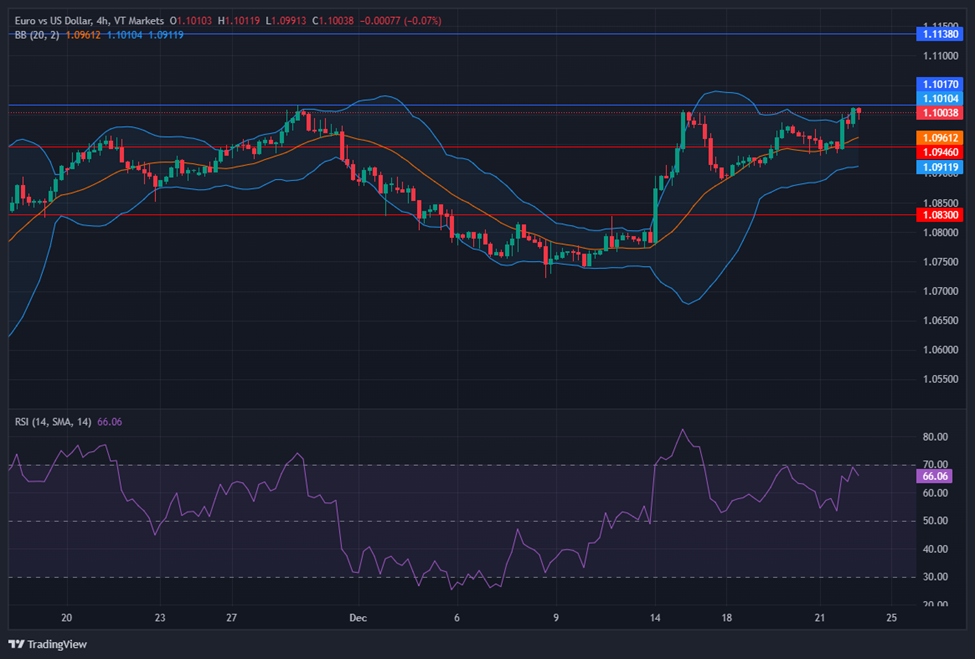
On Tuesday, the EUR/USD moved slightly higher and tried to reach the upper band of the Bollinger Bands. Currently, the price moving slightly below the upper band, suggesting a potential upward movement. Notably, the Relative Strength Index (RSI) maintains its position at 64, signaling a neutral but slightly bullish outlook for this currency pair.
Resistance: 1.1042, 1.1138
Support: 1.0946, 1.0852
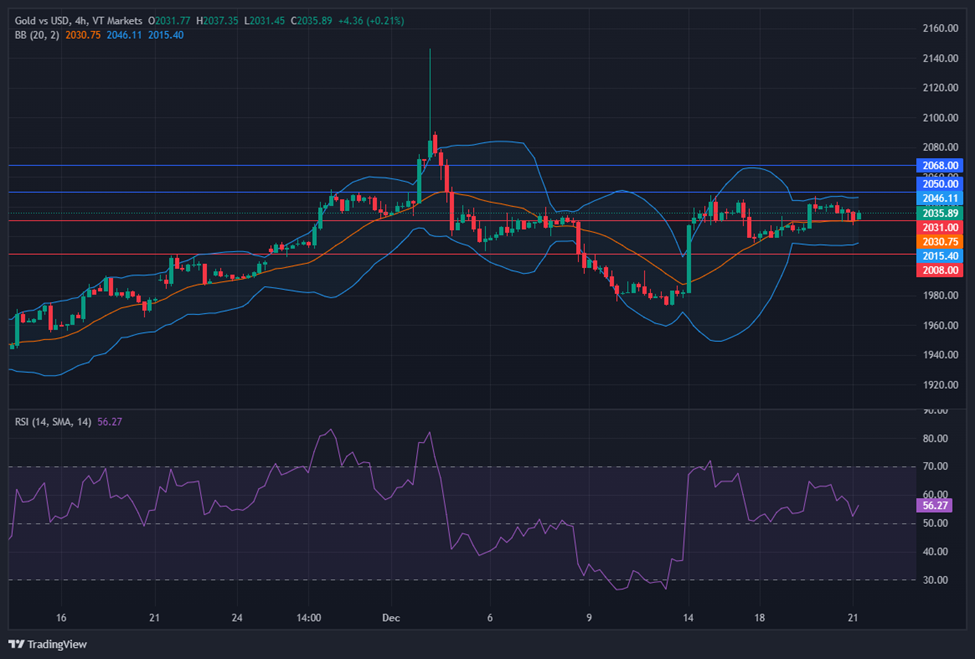
XAU/USD (4 Hours)
XAU/USD Holds Steady Above $2,060 Amid Dollar Weakness and Easing Speculations
In the early Asian session, Gold (XAU/USD) maintained its position above $2,060 despite a marginal 0.09% dip, set amidst a quiet trading week expected due to light volumes in the final stretch of 2023. The US Dollar weakened against its counterparts, pressing the US Dollar Index (DXY) to its lowest since July near 101.45. As Treasury yields edged lower, resting at 3.89%, expectations of Federal Reserve easing intensified, with the market pricing in potential cuts in January and fully anticipating cuts by March 2024. This dovish stance, alongside recent data showing a softer increase in the Core PCE, has positioned lower interest rates as a potential boon for gold, reducing its opportunity cost as a non-yielding asset. Geopolitical tensions in the Middle East, particularly Yemen’s threat to Red Sea shipping and Iran’s potential actions in the Gibraltar Strait, are adding pressure, potentially elevating gold’s safe-haven appeal. Traders are keenly observing the unfolding geopolitical landscape alongside upcoming economic indicators like the US Richmond Fed Manufacturing Index and Initial Jobless Claims.
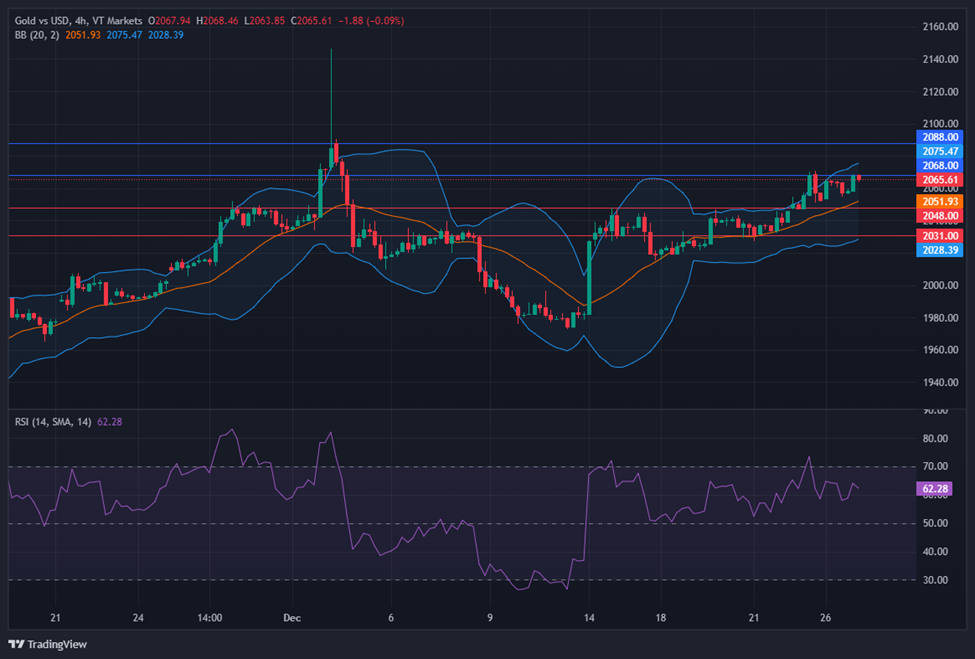
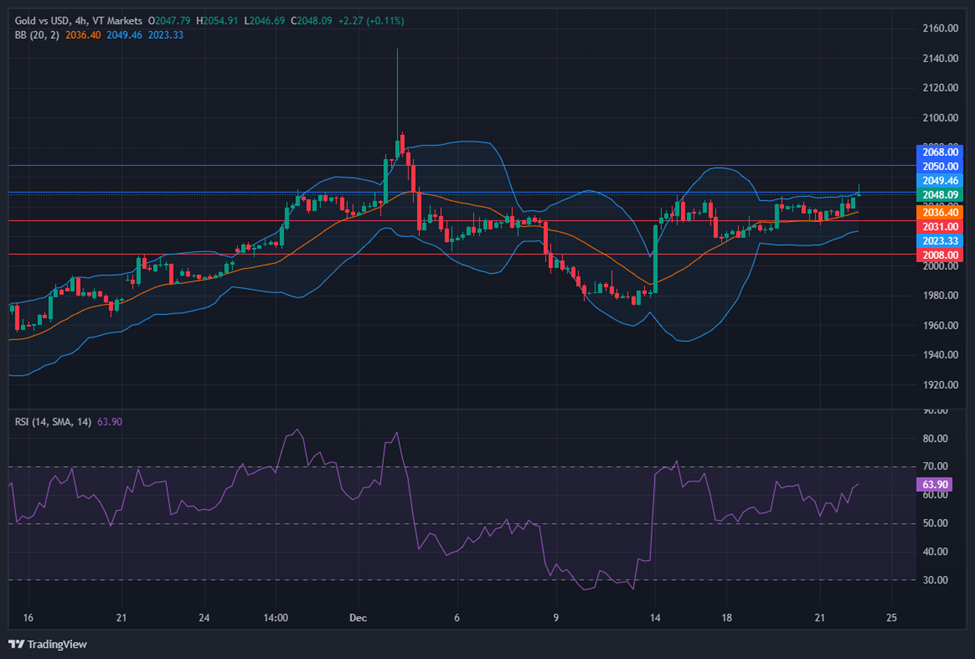
On Tuesday, XAU/USD moved slightly higher and tried to reach the upper band of the Bollinger Bands. Currently, the price moving just below the upper band, suggesting a potential upward movement. The Relative Strength Index (RSI) stands at 62, signaling a neutral but slightly bullish outlook for this pair.
Resistance: $2,068, $2,088
Support: $2,048, $2,031
Week ahead: Santa Claus rally and holiday season take centre stage

With no high-impact news expected, the market’s attention will be focused on the holiday season this week. Investor sentiment is likely to be influenced by holiday festivities, resulting in increased shopping activity and the investment of holiday bonuses. Additionally, the end-of-year period typically coincides with institutional investors going on vacation, leaving the market in the hands of comparatively bullish retail investors. This phenomenon, known as the Santa Claus rally, is expected to occur in the last week of December.
Holiday-related factors aside, here are several other medium-impact market indicators to watch for in the last week of 2023:
US unemployment claims (28 December 2023)
The number of Americans filing for unemployment benefits increased by 2,000 to 205,000 in the week ending 16 December, staying close to the 2-month low of 203,000 seen in the previous week.
Analysts expect a further rise to 207,000 in the week ending 28 December.
US pending home sales (28 December 2023)
Following a 1% rise in September 2023, pending home sales in the US dropped 1.5% month-over-month in October, marking the lowest level since records were first kept in 2001.
Analysts expect a 0.5% increase in the figures for November, set to be released on 28 December.
S&P 500 and Tech Leaders Lead Market Recovery, Forex Eyes USD Downtrend
Thursday witnessed a strong comeback for stocks, with the S&P 500, Dow Jones, and Nasdaq rebounding significantly, nearing their record highs. Micron Technology’s stellar performance fueled tech stocks, while companies like Salesforce contributed to the climb. This turnaround followed a recent market dip attributed to profit-taking after a sustained period of gains. Meanwhile, the currency market saw the dollar index decline due to weaker U.S. economic data, impacting Treasury yields, while EUR/USD faced resistance and USD/JPY retreated within a defined range. Attention now turns to pivotal economic releases that could influence market dynamics, including the US core PCE and Japan CPI data.
Stock Market Updates
Stocks rebounded on Thursday after a recent dip, marking a robust resurgence in the year-end rally. The S&P 500 recovered from its recent decline, edging up by 1.03% to 4,746.75, inching within 1% of its closing high and 1.5% of its intraday record. The Dow Jones Industrial Average soared by 0.87% to 37,404.35, and the Nasdaq Composite surged 1.26% to 14,963.87. The market’s upward trajectory was widespread, with over 450 companies in the S&P 500 index witnessing gains. Micron Technology notably stood out, jumping by 8.6% following its quarterly performance surpassing expectations, bolstered further by an optimistic current-quarter guidance. Chip stocks broadly surged, with Intel and Advanced Micro Devices rising by 2.9% and 3.3%, respectively. Salesforce also contributed to the Dow’s climb, rising by 2.7% after receiving an upgrade from Morgan Stanley.
This upward swing followed a recent downtrend where Wall Street faced losses due to profit-taking after a streak of gains. The prior session marked the Dow and Nasdaq’s worst performance since October, breaking nine-day winning streaks, while the S&P 500 experienced its most significant decline since September. Rhys Williams, chief strategist at Spouting Rock Asset Management, attributed this shift to a technical correction following a robust market period. Since late October, the Dow and S&P 500 have surged over 15%, while the Nasdaq Composite saw an impressive 18% surge during the same period, reflecting a substantial upward momentum in the market.
Data by Bloomberg
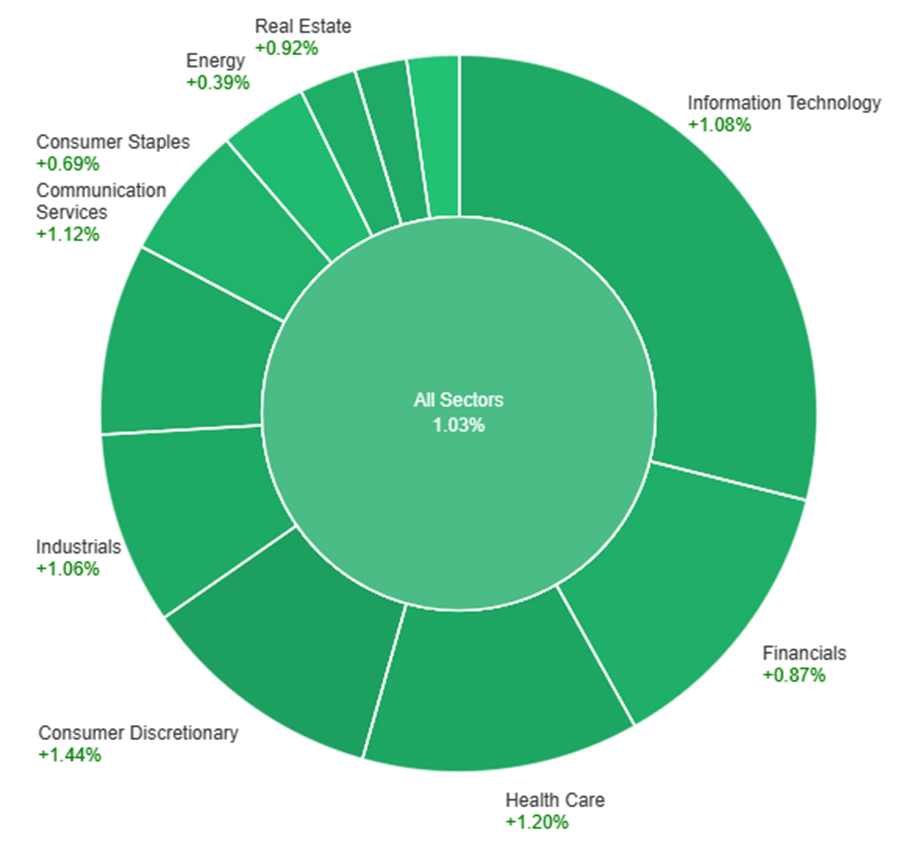
On Thursday, across various sectors, the market showed a general upward trend with an overall increase of 1.03%. Consumer Discretionary saw the highest surge at 1.44%, followed closely by Health Care at 1.20% and Communication Services at 1.12%. Information Technology and Industrials also experienced notable gains at 1.08% and 1.06%, respectively. Meanwhile, Energy and Utilities demonstrated the smallest upticks, with Energy rising by 0.39% and Utilities by 0.13%. Real Estate and Financials fell within the mid-range increases, with Real Estate at 0.92% and Financials at 0.87%. Consumer Staples trailed behind with a rise of 0.69%.
Currency Market Updates
The currency market saw notable shifts as the dollar index declined by 0.4% due to weaker-than-expected U.S. economic data, impacting Treasury yields. Despite a solid 4.9% annualized GDP increase in Q3, downward revisions in GDP and core PCE figures influenced market sentiment. Core PCE rose only 2.0% year-on-year, signaling a potential downside miss, which could favor dollar bears. The upcoming release of November’s core PCE, income, and spending figures was highlighted as pivotal for Treasuries, risk, and the dollar, with indications pointing towards a possible downward trend in core PCE, impacting market dynamics.
EUR/USD observed a 0.4% rise, facing resistance near 1.1000 due to ongoing weak economic data and outlooks in the eurozone, particularly in Germany. USD/JPY, on the other hand, experienced a 0.8% fall, retracting all weekly gains but maintaining a recovery pattern within the 140.95-4.95 range following dovish meetings from both the Fed and BoJ. With the upcoming Japan CPI and U.S. core PCE releases, attention is on the 200-day moving average at 142.72, potentially signaling a retest of 140.95. Sterling saw a marginal 0.25% rise amidst a pessimistic UK CBI retail sales survey and below-forecast UK CPI, with further market focus on impending UK retail sales and Q3 GDP announcements.
Picks of the Day Analysis
EUR/USD (4 Hours)
EUR/USD USD Gains Ground Amid Dollar Weakness Despite Mixed US Data; Eyes on Inflation Figures
The EUR/USD edged higher, reaching the 1.1000 mark as the Dollar struggled despite increased Treasury yields. US economic indicators presented a mixed picture, with declines in the Philadelphia Fed Index and a revision in Q3 GDP, while Jobless Claims remained steady. Investors await the crucial Core PCE inflation data, anticipating a 0.2% rise for November. Despite the rebound in US yields, the Dollar remains subdued, limiting the EUR/USD upside potential amidst thinner market conditions.
On Thursday, the EUR/USD moved higher and reached the upper band of the Bollinger Bands. Currently, the price moving slightly below the upper band, suggesting a potential upward movement. Notably, the Relative Strength Index (RSI) maintains its position at 66, signaling a neutral outlook for this currency pair.
Resistance: 1.1017, 1.1138
Support: 1.0946, 1.0830
XAU/USD (4 Hours)
XAU/USD Resilient Above $2,040 Despite USD Swings Amidst Mixed US Economic Data
In fluctuating market sentiment driven by a resilient US Dollar and mixed economic indicators, spot Gold managed to maintain its position above $2,040 per troy ounce. The Dollar initially gained traction, favored by Wall Street’s lackluster performance and softer Treasury yields, but a shift in direction followed mixed US data. Despite GDP figures slightly below estimates and declining bond yields, investor confidence bounced back on Wall Street. With attention now turning to upcoming US economic releases, including the Core PCE Price Index and Michigan Consumer Sentiment Index, Gold remains resilient amidst the market’s uncertain landscape.
On Thursday, XAU/USD moved slightly higher and reached the upper band of the Bollinger Bands. Currently, the price moving just below the upper band, suggesting a potential upward movement. The Relative Strength Index (RSI) stands at 63, signaling a neutral outlook for this pair.
Resistance: $2,050, $2,068
Support: $2,031, $2,008
Economic Data
| Currency | Data | Time (GMT + 8) | Forecast |
|---|---|---|---|
| GBP | Retail Sales m/m | 15:00 | 0.4% |
| CAD | GDP m/m | 21:30 | 0.2% |
| USD | Core PCE Price Index m/m | 21:30 | 0.2% |
| USD | Revised UoM Consumer Sentiment | 23:00 | 69.4 |
Futures Show Modest Gains Amidst Micron’s Surge, Eyes on Economic Data, and Nike’s Earnings
Stock futures edged higher after a recent market pause, with S&P 500, Nasdaq 100, and Dow Jones futures indicating slight upticks. Micron’s notable postmarket leap of over 4% propelled optimism after surpassing Wall Street’s projections for its first fiscal quarter. However, the prior day marked a downturn as investors seized profit opportunities, reflecting the S&P 500’s worst performance since September. Looking forward, attention is on forthcoming economic indicators like jobless claims and GDP figures, alongside Nike’s imminent earnings release. In currency markets, Sterling declined by 0.5% due to disappointing UK CPI, while the dollar, euro, and yen stabilized. Ongoing central bank comments continue to sway sentiment, impacting the EUR/USD pair and hinting at potential shifts in global monetary policies tied to upcoming data releases like Japan’s core CPI and the U.S. core PCE.
Stock Market Updates
Stock futures indicated a modest upward trend following a pause in the recent market surge. S&P 500 futures rose by 0.16%, Nasdaq 100 futures by 0.24%, and Dow Jones Industrial Average futures climbed 0.15%. Micron experienced a significant postmarket increase, jumping over 4% after surpassing Wall Street’s expectations for its first fiscal quarter and providing a stronger-than-expected outlook for the current quarter. The day prior witnessed a downturn in the markets as investors seized the opportunity to capitalize on recent profits, resulting in the S&P 500’s worst performance since September and the Dow and Nasdaq marking their most significant drops since October. These declines marked a breather from a robust market rally that saw substantial gains in the Dow, S&P 500, and Nasdaq Composite over the past few months.
Looking ahead, investors are eyeing upcoming data releases such as jobless claims and third-quarter gross domestic product figures, along with the closely watched personal consumption expenditures price index, known as an essential measure of inflation. Additionally, market watchers are anticipating Nike’s earnings announcement after the closing bell on Thursday, which is likely to influence market sentiment and direction.
Data by Bloomberg
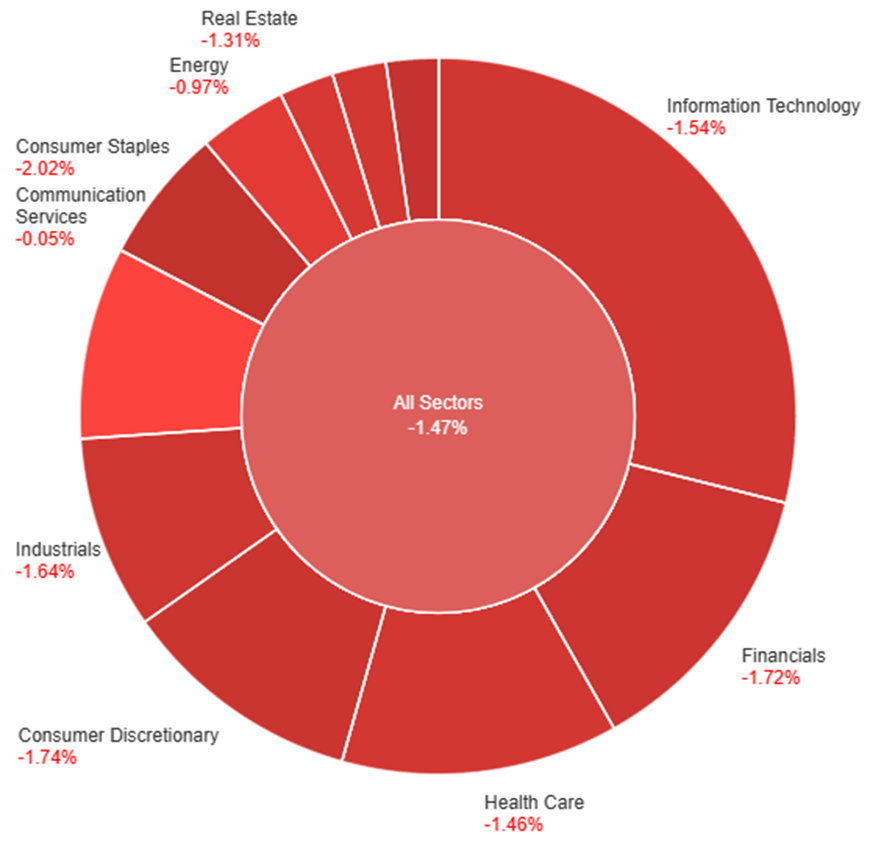
On Wednesday, the overall market experienced a decline of 1.47%. Across sectors, most industries saw negative movements, with Utilities and Consumer Staples facing the steepest drops at -1.98% and -2.02% respectively. The Information Technology sector also fell notably by 1.54%, while Financials and Consumer Discretionary both recorded decreases of 1.72% and 1.74% respectively. Other sectors such as Health Care, Materials, and Industrials followed a similar downward trend, showing declines ranging from 1.46% to 1.64%. Communication Services and Energy sectors were relatively less affected, with marginal decreases of -0.05% and -0.97% respectively. Real Estate experienced a decline of 1.31%. Overall, it was a day of widespread negative performance across various sectors, with Utilities and Consumer Staples bearing the brunt of the losses.
Currency Market Updates
In recent currency market movements, Sterling faced losses as UK CPI fell below expectations, leading to a 0.5% decline. This drop was influenced by a significant 16bp decrease in two-year gilt yields, impacting the market and offsetting risk-on flows. Conversely, the dollar, euro, and yen stabilized within specific ranges following fluctuations post-recent central bank meetings. However, these adjustments were insufficient to extend the EUR/USD’s attempt to surpass November and December highs or bolster USD/JPY after its post-Fed pivot retreat.
The market sentiment remains influenced by ongoing post-meeting comments from the Fed and ECB. Eurozone dynamics saw ECB hawks challenging aggressive rate cut expectations while grappling with declining German producer prices amidst forecasts of increased German inflation in early 2024 due to budget constraints. As a result, the EUR/USD pair experienced a 0.2% decline, nearing 1.0950 from its late 2023 peaks. Additionally, the focus now shifts towards upcoming data releases, including Japan’s core CPI, predicted to drop to 2.5%, potentially influencing the BoJ’s policies. Meanwhile, the U.S. core PCE is expected to decrease to 3.3%, aligning with futures pricing indicating a decline in Fed rates to 3.85% by the next December. These impending reports stand poised to shape future currency movements.
Picks of the Day Analysis
EUR/USD (4 Hours)
EUR/USD Teeters Amid US Dollar Recovery: Key Data Points Influence Direction
The EUR/USD faced a dip amidst a recovering US Dollar Index, struggling to break the 1.1000 mark as it moved directionlessly. Supported by a weak US Dollar and a hint of risk appetite, the pair showed resilience. Positive US data, including a rise in Existing Home Sales and Consumer Confidence, countered the Eurozone’s moderate uptick in Consumer Confidence and the ECB’s resistance to early rate cuts. While the bias leans towards an upward trajectory, the EUR/USD needs to breach 1.1000 swiftly to mitigate focus on the diverging economic performances of the US and Eurozone. Thursday’s upcoming data, including Jobless Claims and Q3 GDP, followed by Friday’s Core PCE report, will likely steer the pair’s direction.
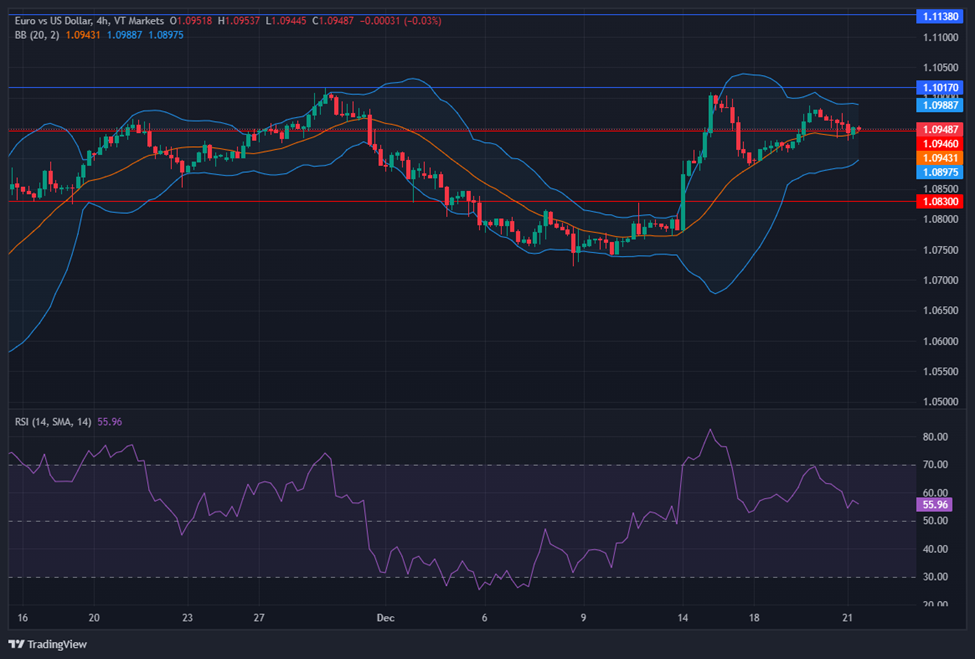
On Wednesday, the EUR/USD moved slightly lower reaching the middle band of the Bollinger Bands. Currently, the price moving slightly above the upper band, suggesting a potential for another upward movement. Notably, the Relative Strength Index (RSI) maintains its position at 55, signaling a neutral outlook for this currency pair.
Resistance: 1.1017, 1.1138
Support: 1.0946, 1.0830
XAU/USD (4 Hours)
XAU/USD Holds Steady Amidst USD Strength and Inflation Concerns
Spot Gold, represented by XAU/USD, navigated within a tight range as the US Dollar gained momentum earlier in the day, buoyed by upbeat US data like the CB Consumer Confidence report. Despite hitting an intraday high before retracing, Gold settled near its daily low. Market sentiment shifted during the European session on news of easing UK inflation, alleviating some concerns. Eyes now turn to the upcoming US Personal Consumption Expenditures Price Index, anticipated to influence markets significantly and potentially affirm or challenge the Fed’s recent policy stance.
On Wednesday, XAU/USD moved slightly lower and reached the middle band of the Bollinger Bands. Currently, the price moving just above the upper band, suggesting a potential upward movement. The Relative Strength Index (RSI) stands at 56, signaling a neutral outlook for this pair.
Resistance: $2,050, $2,068
Support: $2,031, $2,008
Economic Data
| Currency | Data | Time (GMT + 8) | Forecast |
|---|---|---|---|
| USD | Final GDP q/q | 21:30 | 5.2% |
| USD | Unemployment Claims | 21:30 | 214K |
S&P 500 Nears Record High on Fed’s Optimism, Energy Stocks Surge, and Currency Markets Fluctuate
The stock market witnessed a strong surge, propelling the S&P 500 close to its all-time high after significant gains fueled by the Federal Reserve’s positive stance on interest rates. The Dow Jones Industrial Average and Nasdaq Composite also experienced substantial increases, while energy stocks, particularly in the S&P 500 sector, saw notable rises due to escalating oil prices. The bullish momentum, backed by the Fed’s indications of potential interest rate cuts in 2024 and favorable market conditions, led to December’s substantial gains across major indices. Concurrently, currency markets saw fluctuations, with the US Dollar Index declining, housing sector data revealing mixed results, and various currency pairs experiencing diverse movements amidst global economic shifts.
Stock Market Updates
The stock market showed a robust uptick, with the S&P 500 nearing its all-time high after a 0.59% gain, coming within 0.6% of its previous record close. This surge was fueled by the Federal Reserve’s dovish stance on interest rates, fostering investor confidence. The Dow Jones Industrial Average climbed by 0.68%, reaching 37,557.92 points, while the Nasdaq Composite surged by 0.66%, breaching the 15,000 mark for the first time since January 2022. Additionally, the Nasdaq 100 hit all-time intraday and closing highs, ascending by 0.49% to 16,811.85. Energy stocks, particularly in the S&P 500 sector, outperformed with a 1.2% rise, propelled by increasing oil prices, with companies like Occidental Petroleum, Halliburton, and Exxon Mobil witnessing significant gains. Moreover, Walgreens Boots Alliance led the Dow with a 4.2% surge, while Enphase Energy and First Solar notably contributed to S&P 500 advances, up by about 9% and 4%, respectively.
The market’s bullish momentum has been amplified by recent Federal Reserve indications of potential interest rate cuts in 2024, along with encouraging signs of moderated inflation and a retreat in Treasury yields. December showcased significant gains across the board, with the S&P 500, Dow, and Nasdaq boasting increases of 4.4%, 4.5%, and 5.5%, respectively, reflecting the market’s strong performance and its longest weekly winning streak since 2017. This rally coincides with the typically robust season for equities, further buoyed by favorable market conditions.
Data by Bloomberg
On Tuesday, across all sectors, there was a positive trend with a 0.59% increase. Energy notably surged by 1.22%, leading the gains, followed closely by Communication Services and Materials, both showing strong increases at 0.92% and 0.91%, respectively. Financials, Industrials, Consumer Discretionary, and Real Estate all demonstrated moderate growth between 0.70% and 0.77%. Health Care also contributed positively, rising by 0.67%, while Utilities saw a more modest increase of 0.56%. However, Information Technology and Consumer Staples exhibited lower growth rates, with increases of only 0.24% and 0.22%, respectively, compared to the other sectors.
Currency Market Updates
In the latest currency market updates, the US Dollar Index (DXY) continued its downward trajectory, slipping by over 0.30% and approaching the 102.00 mark, albeit remaining above December lows. Wall Street stocks surged, pushing the Dow Jones to a fresh all-time high close, while the 10-year Treasury yield hovered around 3.90%. Mixed data from the US housing sector revealed an unexpected rise in Housing Starts to 1.56 million, surpassing predictions, while Building Permits slightly declined to 1.46 million, below the anticipated figure. Wednesday’s focus will be on further housing data release with Existing Home Sales and the CB Consumer Confidence survey.
Meanwhile, the currency pairs saw notable movements: EUR/USD displayed an upward bias but struggled to reclaim the 1.1000 mark, hovering around 1.0970. GBP/USD trimmed gains and dipped towards 1.2700, encountering resistance near 1.2800, ahead of significant UK consumer and wholesale inflation figures due on Wednesday. The Japanese Yen weakened sharply following a “dovish hold” by the Bank of Japan, impacting USD/JPY, which initially spiked before retracing amidst a weaker US Dollar and declining global yields. USD/CHF hit four-month lows under 0.8600 and is expected to test the 2023 low around 0.8550, with the Swiss National Bank’s quarterly bulletin due.
Additionally, the Canadian Dollar (CAD) strengthened across the board after the Consumer Price Index rose 0.1% in November, contrary to expectations of a 0.2% decline. This led USD/CAD to its lowest daily close since early August below 1.3350, ahead of the Bank of Canada’s (BoC) Summary of Deliberations. On another front, AUD/USD broke above 0.6730 and surged to 0.6774, marking its highest level in nearly five months, driven by US Dollar weakness, improved risk appetite, and support from rallying commodity prices. Meanwhile, Gold prices struggled to sustain gains above $2,040, while Silver, despite reclaiming $24.00, faced challenges holding above the 20-day Simple Moving Average, aiming for a breakthrough at $24.30 for substantial advances in XAG/USD (Silver/US Dollar).
Picks of the Day Analysis
EUR/USD (4 Hours)
EUR/USD Surges Amid Dollar Weakness Despite Euro’s Mixed Signals
The EUR/USD pair rallied for a consecutive second day, edging closer to the 1.1000 mark and November’s peaks, buoyed by a faltering US Dollar amidst growing risk appetite. Despite the Dollar’s downturn, the Euro’s outlook remains uncertain, highlighted by Eurostat’s revised downward November inflation figures, tempering optimism. As the Federal Reserve and European Central Bank officials push against market expectations, the interest rate market hints at probable rate cuts by April, pressuring the Dollar amid ascending equity and commodity prices. Mixed US housing sector data added to the complex market landscape, with Housing Starts surpassing forecasts while Building Permits fell short. The upcoming data on Wednesday, including Current Account, Construction Output, and Consumer Confidence figures, further intensifies the intricate dynamics influencing the EUR/USD pair.
On Tuesday, the EUR/USD moved higher trying to reach the upper band of the Bollinger Bands. Currently, the price moving slightly below the upper band, suggesting a potential upward movement. Notably, the Relative Strength Index (RSI) maintains its position at 65, signaling a neutral but still bullish outlook for this currency pair.
Resistance: 1.1017, 1.1138
Support: 1.0946, 1.0830
XAU/USD (4 Hours)
XAU/USD Holds Steady Amidst Dollar Weakness and Equities’ Optimism
Gold (XAU/USD) maintained a resilient stance, hovering around $2,040 as the US Dollar weakened, buoyed by a positive equities market driven by robust risk appetite. The Nasdaq Composite achieved consecutive record highs, reinforcing the sentiment inspired by central banks. Compounding the USD’s pressure were sliding Treasury yields, hitting lows unseen since July. Despite a relatively quiet US macroeconomic calendar, attention is fixated on Friday’s release of the Core PCE Price Index, the Federal Reserve’s favored inflation gauge, keeping speculative interests keenly attuned to potential market shifts.
On Tuesday, XAU/USD moved slightly higher and reached the upper band of the Bollinger Bands. Currently, the price moving just below the upper band, suggesting a potential upward movement. The Relative Strength Index (RSI) stands at 62, signaling a neutral outlook for this pair.
Resistance: $2,050, $2,068
Support: $2,031, $2,008
Economic Data
| Currency | Data | Time (GMT + 8) | Forecast |
|---|---|---|---|
| GBP | CPI y/y | 15:00 | 4.3% |
| USD | CB Consumer Confidence | 23:00 | 104.6 |
| USD | Existing Home Sales | 23:00 | 3.77M |
Important Forex Terms That Every Trader Should Know
THE WORLD OF FOREX TERMS FOR EVERY TRADER
Embarking on a journey into the world of Forex trading can be both exciting and overwhelming. The key to navigating this dynamic market confidently lies in understanding its unique language. This article demystifies the essential terms every Forex trader should know, paving the way for informed and strategic trading decisions.
1. Pips: Precision in Forex Pricing
A ‘pip’ is the smallest price movement in the currency market and is essential in measuring gains or losses. In most currency pairs, a pip represents a one ten-thousandth movement (0.0001) in the exchange rate. For example, if the EUR/USD pair moves from 1.1050 to 1.1051, that 0.0001 USD rise is one pip.
2. Lot Size: The Building Blocks of Forex
Lot size refers to the number of currency units you’re trading. In Forex, a standard lot represents 100,000 units of the base currency. However, for individual traders, mini (10,000 units) and micro (1,000 units) lots are also commonly used, providing flexibility and risk management options.
3. Leverage: Amplifying Your Trading Power
Leverage in Forex allows traders to gain a larger exposure to the market than what their initial capital would permit. It’s essentially a loan provided by the broker, enabling traders to open larger positions. High leverage can magnify profits but also losses, making it a double-edged sword.
4. Margin: The Key to Leveraged Trading
Margin is the amount of capital required to open and maintain a leveraged position. It’s a fraction of the full value of your trade. Margin trading allows you to make significant trades with a relatively small investment, yet it increases the potential for both profits and losses.
Discover Forex Basics In This Article
5. Spread: The Cost of a Forex Trade
The spread is the difference between the bid (sell) price and the ask (buy) price of a currency pair. It’s essentially the broker’s fee for executing your trade. Narrower spreads usually mean lower trading costs, making them preferable for traders.
6. Bid and Ask: The Two-Way Price Quotes
In Forex, every currency pair has a bid price and an ask price. The bid price is the price at which you can sell the base currency, while the ask is the price at which you can buy it. The difference between these two prices is the spread.
7. Stop-Loss Order: Managing Trading Risks
A stop-loss order is an automatic order to close a trade at a specific price to prevent further losses if the market moves against your position. It’s a crucial risk management tool, helping traders to control potential losses on their positions.
8. Take Profit Order: Locking in Profits
Opposite to the stop-loss, a take profit order automatically closes your trade when it reaches a predetermined profit level. It ensures that a profitable position doesn’t turn into a loss, especially in volatile markets where changes can happen rapidly.
9. Currency Pair: The Foundation of Forex Trading
Currency pairs represent two different currencies, with the value of one currency quoted against the other. The first currency listed (base currency) is the one being bought or sold against the second currency (quote currency), like EUR/USD or USD/JPY.
10. Bull and Bear Markets: Understanding Market Sentiments
Bull Market: This term describes a financial market in which prices are rising or expected to rise. In a bullish Forex market, traders generally buy in anticipation of future price increases.
Bear Market: Conversely, a bear market indicates declining prices. Traders might sell or short-sell currencies expecting further decreases.
11. Fundamental Analysis: Gauging Currency Value
Fundamental analysis involves evaluating a currency’s value by examining related economic, social, and political factors. This includes GDP growth, interest rates, inflation, and political stability, influencing traders’ decisions on currency positions.
Test Your Trading Skills with VT Forex Demo Account
12. Technical Analysis: Predicting Price Movements
Technical analysis is the study of historical market data, primarily price and volume, to forecast future market behavior. Traders use various tools like charts, trend lines, and indicators such as moving averages and Bollinger Bands.
13. Swap: The Cost of Holding a Position Overnight
A swap in Forex is the interest paid or earned for holding a position overnight. This rate varies depending on the currency pair and the difference in interest rates between the two currencies involved.
14. Volatility: The Measure of Market Fluctuations
Volatility refers to the frequency and magnitude of price movements in the Forex market. High volatility means significant price movements within a short time, offering both high-risk and high-reward trading opportunities.
15. Economic Calendar: Tracking Market-Moving Events
The economic calendar lists scheduled financial events such as central bank meetings, economic indicator releases, and government reports. These events can significantly impact currency markets, and traders often plan their strategies around them.
16. Order Book: A Window into Market Activity
An order book is a list showing the number of buy and sell orders for a currency pair at different prices. It provides valuable insights into potential support and resistance levels and overall market depth.
17. Scalping: A Rapid Trading Strategy
Scalping is a trading strategy that involves making numerous trades over a short period, often just a few minutes, aiming to profit from small price changes. This high-intensity approach requires quick decision-making and constant market monitoring.
Learn More About Forex With VT Markets
18. Carry Trade: Profit from Interest Rate Differentials
Carry trade is a strategy where a trader borrows a currency with a low-interest rate and uses it to buy a currency with a higher interest rate. The trader profits from the interest rate differential as long as the exchange rate doesn’t move unfavorably.
19. Hedging: Reducing Risk Exposure
Hedging in Forex is a strategy used to protect one’s position from an adverse move in currency pairs. It involves opening additional positions to offset potential losses.
20. Liquidity: The Ease of Buying and Selling
Liquidity in the Forex market refers to the ability to buy or sell assets without causing a significant price change. Highly liquid markets allow for faster and larger transactions with minimal price impact.
21. Broker: Your Gateway to the Forex Market
A Forex broker is an intermediary between you and the interbank system. Brokers provide platforms and tools for executing trades in the Forex market.
22. Sentiment Analysis: Gauging Market Mood
Sentiment analysis involves assessing the overall attitude of the market participants towards a particular currency pair, helping traders understand potential future movements.
23. Drawdown: Understanding Trading Losses
Drawdown refers to the reduction of one’s trading capital after a series of losing trades. It’s an important metric for assessing risk and trading performance.
Your Forex Journey with VT Markets
Mastering these terms is key to understanding the complexities of Forex trading. With VT Markets, you can apply this knowledge on a platform that offers advanced trading tools, educational resources, and expert insights. Visit VT Markets for a comprehensive trading experience.
S&P 500 Continues Winning Streak, Tech Giants Propel Communication Sector, and Currency Markets Navigate Fed Rate Cut Speculations
The stock market witnessed a persistent upward trend with the S&P 500 maintaining a seven-week winning streak, inching closer to its previous all-time high. While the Dow Jones Industrial Average showed marginal movement, the S&P 500 surged by 0.45%, notably driven by gains in mega-cap tech companies like Meta Platforms and Alphabet. U.S. Steel shares soared by 26% following an acquisition announcement by Japan’s Nippon Steel. December marked robust performance across major indices, spurred by the Federal Reserve’s indication of potential short-term interest rate cuts in 2024 amidst cooling inflation. In the currency market, fluctuations in major pairs like EUR/USD, USD/JPY, Dollar Index, and British Pound were observed, influenced by speculation on rate cuts by central banks and economic indicators impacting their trajectories.
Stock Market Updates
The stock market saw a continuation of its upward trend as the S&P 500 maintained its seven-week winning streak. The Dow Jones Industrial Average experienced marginal movement, edging up by only 0.86 points to 37,306.02, while the S&P 500 climbed by 0.45% to reach 4,740.56, inching closer to its all-time closing high from January 2022, now just 1.2% away. Communication services stood out with a 1.9% increase in the S&P 500, notably driven by gains in mega-cap tech companies like Meta Platforms and Alphabet, which surged nearly 3% and more than 2%, respectively. Additionally, U.S. Steel shares soared by 26% following the announcement of Japan’s Nippon Steel acquiring the company for $14.9 billion.
December showcased robust performance across major indices, with the S&P 500 up by 3.8% for the month, while the Dow and Nasdaq rose by 3.8% and 4.8%, respectively. The positive investor sentiment stemmed from the Federal Reserve’s indication of expecting three short-term interest rate cuts in 2024, given the backdrop of cooling inflation. This sentiment shift led to a drop in Treasury yields, with the 10-year Treasury yield dipping below the 4% mark, further contributing to the market’s positive trajectory.
Data by Bloomberg
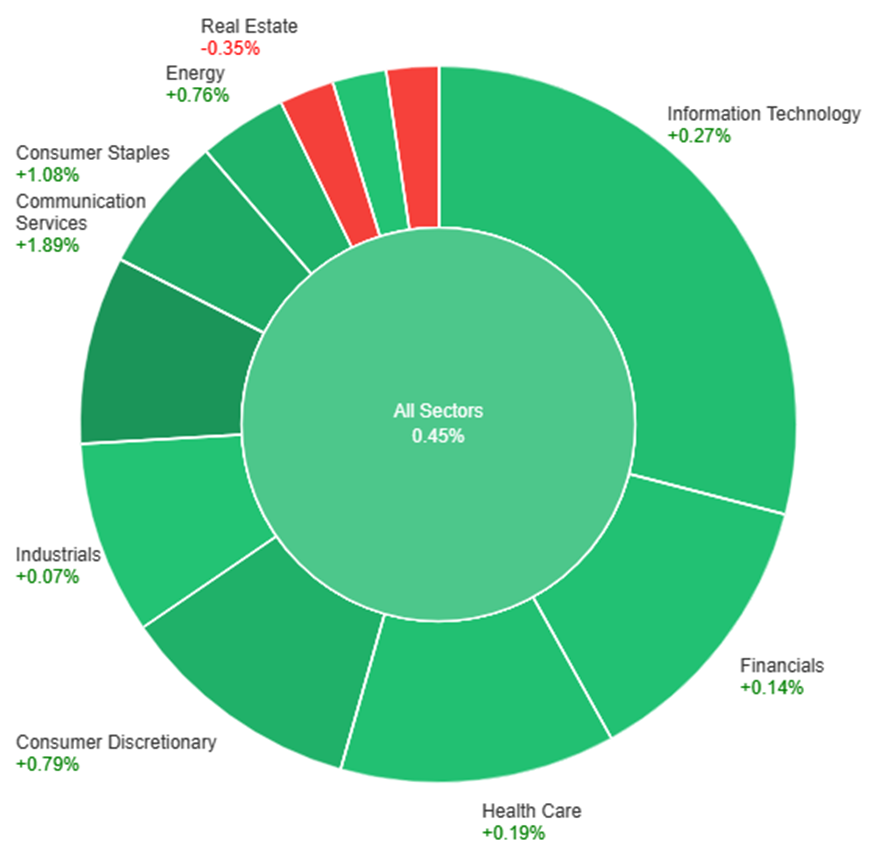
On Monday, the overall market saw a positive trend, with a collective rise of 0.45% across all sectors. Notably, Communication Services performed exceptionally well, soaring by 1.89%, followed by strong gains in Consumer Staples at 1.08% and Consumer Discretionary at 0.79%. Energy and Information Technology also contributed positively with increases of 0.76% and 0.27%, respectively. However, Utilities and Real Estate experienced declines, showing decreases of -0.30% and -0.35%, respectively, marking the only sectors that saw a downturn on that day.
Currency Market Updates
In the recent currency market updates, the focus was primarily on the fluctuations of major currency pairs, notably the EUR/USD and USD/JPY, alongside observations regarding the Dollar Index and the British Pound. The Dollar Index experienced a 0.1% decline amid speculations regarding potential rate cuts by the Fed, ECB, and BoE in 2024. The EUR/USD pair saw a 0.3% rise, influenced by the rebound in Bunds-Treasury yield spreads due to resistance from some ECB policymakers against early 2024 rate cuts. However, the pair faced concerns over German Ifo business sentiment and the risk of a potential recession reading, impacting its trajectory within a specific trading range.
Conversely, USD/JPY observed a 0.5% increase as it continued its recovery from prior plunges, influenced by market uncertainties surrounding aggressive Fed rate cut expectations versus the possibility of a BoJ hike. The broader trend for USD/JPY seemed downward, particularly if the BoJ failed to indicate a move away from negative rates. Meanwhile, the British Pound declined by 0.3%, distancing itself from recent highs following a dovish Fed and hawkish BoE meeting. Focus shifted to the upcoming UK CPI report, while observations noted a bearish divergence from last week’s highs and a strong demand for Sterling at its 200-day moving average, hinting at potential consolidation in the near term.
Picks of the Day Analysis
EUR/USD (4 Hours)
EUR/USD Holds Ground Amidst Dollar Pressure and ECB Speculation
The EUR/USD pair showed resilience, edging up after a recent dip, finding support above the 20-day SMA, and hovering above 1.0900 in a subdued market atmosphere. The US Dollar faced bearish pressures following the Federal Reserve’s dovish tone, although rate cuts seem distant despite initial forecasts. Meanwhile, in the Eurozone, lower-than-expected IFO business survey readings in Germany and steady but moderate inflation figures have raised expectations of potential ECB rate cuts, capping the Euro’s upward momentum below the 1.1030 mark. The market awaits the US Core PCE Price Index report for further cues on the greenback’s trajectory.
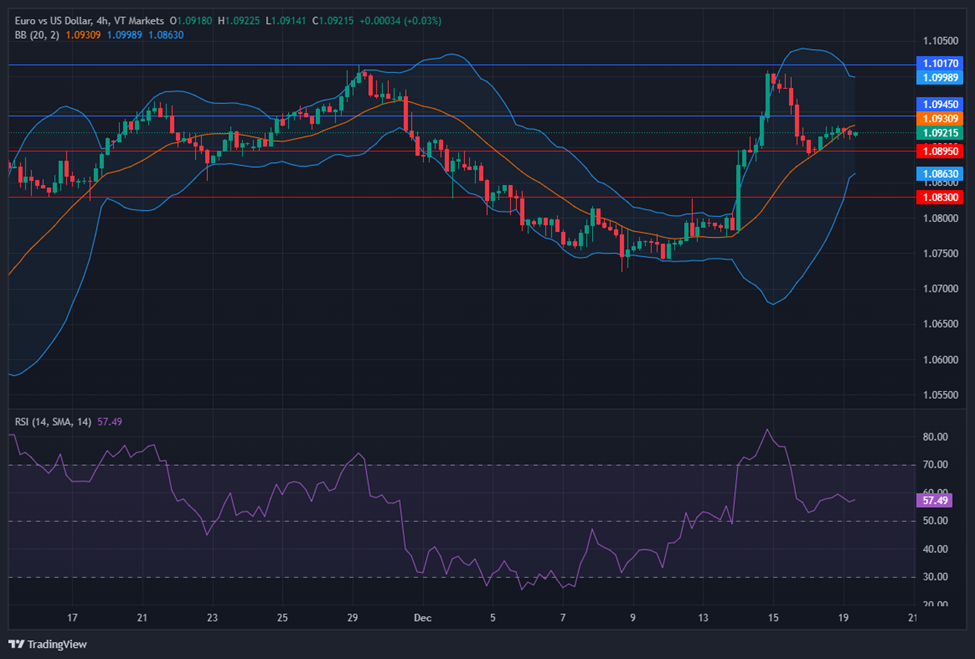
On Friday, the EUR/USD moved flat and moved around the middle band of the Bollinger Bands. Currently, the price moving slightly below the middle band, suggesting a potential for another consolidation movement. Notably, the Relative Strength Index (RSI) maintains its position at 57, signaling a neutral but still bullish outlook for this currency pair.
Resistance: 1.0945, 1.1017
Support: 1.0895, 1.0830
XAU/USD (4 Hours)
XAU/USD Maintain Soft Tone Amid Fed’s Stance on Monetary Policy and Market Optimism
Gold prices for XAU/USD held marginally above Friday’s closure at $2,018.19 per troy ounce despite subdued demand for the US Dollar triggered by softer government bond yields following the Fed’s decision to halt monetary tightening. The Fed’s stance, marking a pivot toward potential rate cuts, caused a retreat in US Treasury yields, notably the 10-year note, which currently stands at 3.95%. Wall Street’s positive performance limited the safe-haven appeal of the Greenback, constraining upward movement for gold. However, as financial markets approach the winter holidays, attention turns to upcoming inflation updates from the UK, Canada, and the Bank of Japan’s monetary policy decision, culminating with the US releasing the Core PCE Price Index, anticipated to show a slight decrease in November’s YoY inflation.
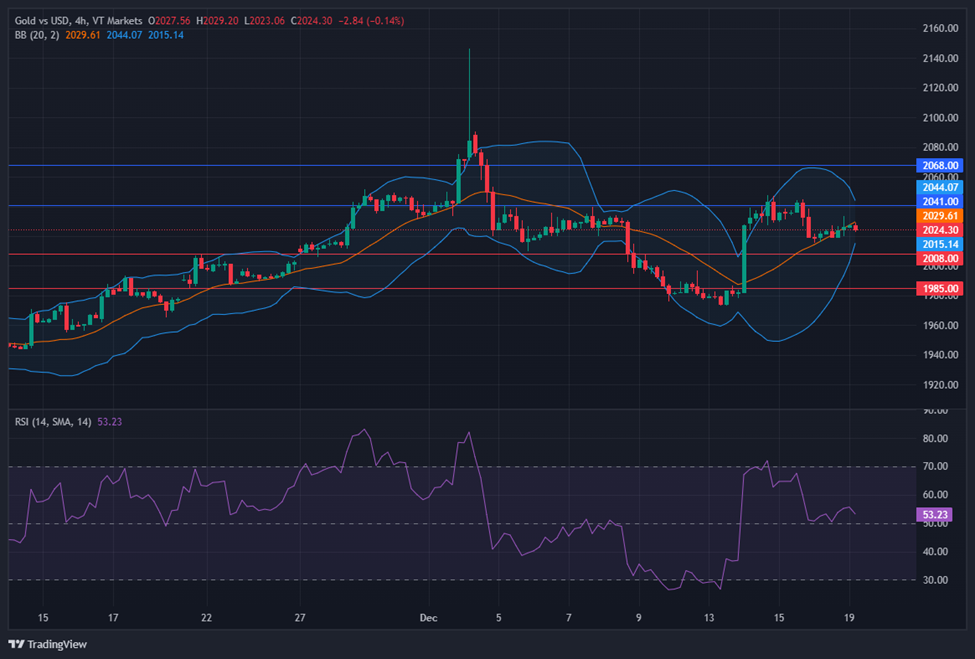
On Friday, XAU/USD moved in consolidation around the middle band of the Bollinger Bands. Currently, the price moving just below the middle band, suggesting a potential consolidation movement. The Relative Strength Index (RSI) stands at 53, signaling a neutral outlook for this pair.
Resistance: $2,041, $2,068
Support: $2,008, $1,985
Economic Data
| Currency | Data | Time (GMT + 8) | Forecast |
|---|---|---|---|
| JPY | BOJ Policy Rate | Tentative | |
| JPY | BOJ Press Conference | Tentative | -0.10 (Actual) |
| CAD | Consumer Price Index m/m | 21:30 | -0.1% |
Diversifying Your Portfolio with Gold to Help Spread Risk
Integrating Gold into Your Investment Strategy
Are you looking to make your investment portfolio more robust and resilient in the face of market uncertainties?
If so, consider adding gold to your investment mix. Gold has been a valuable asset for centuries, known for its ability to retain value and act as a hedge against economic downturns.
In this blog post, we’ll explore diversifying your portfolio with gold, and we’ll provide simple examples to help you understand the process.
Why Diversify Your Portfolio
Before we dive into the gold aspect, let’s quickly recap why diversification is crucial. The saying “don’t put all your eggs in one basket” holds true in the world of investments.
By spreading your investments across various asset classes, you can reduce the overall risk in your portfolio. When one asset class underperforms, others may offset the losses, helping you maintain a more stable financial position.
The Role of Gold in Diversification
Gold is often considered a “safe-haven” asset, meaning it tends to perform well when other investments, such as stocks or bonds, are underperforming. This makes gold a valuable addition to your portfolio for risk management.
Let’s say you have a portfolio heavily invested in stocks. If the stock market experiences a significant downturn, the value of your stocks may decrease substantially.
But, if you also hold gold in your portfolio, the price of gold tends to rise during economic crises. This can help offset the losses in your stock investments.
Balancing Your Portfolio with Gold
Now, let’s discuss how to incorporate gold into your portfolio. The key is to find the right balance. You don’t want to allocate all your assets to gold, as that would defeat the purpose of diversification.
Instead, consider allocating a portion of your portfolio to gold, typically around 5% to 10%, depending on your risk tolerance and investment goals.
For instance, if you have a $100,000 investment portfolio, you might allocate $5,000 to $10,000 towards gold investments. This way, you benefit from gold’s stability without overcommitting to a single asset class.
Ways to Invest in Gold
There are several ways to invest in gold, each with its own advantages and considerations. Here are a few common options:
1. Physical Gold:
This includes buying gold coins or bars. While you have the advantage of owning physical gold, you’ll need a safe place to store it, and there may be additional costs associated with purchasing and storing physical gold.
2. Gold ETFs:
Exchange-traded funds (ETFs) that track the price of gold are a convenient way to invest.
Let’s say you want to invest in gold, but you don’t want to store gold bars at home. Instead, you buy shares of a Gold ETF. Each share you buy represents a tiny piece of a big pot of gold owned by the ETF.
So, if the Gold ETF’s price goes up, the value of your shares goes up too. And if the Gold ETF pays out dividends, you get a share of those as well.
It’s like having a piece of gold without needing to keep it in your house or worry about security. Plus, it’s easy to buy and sell Gold ETF shares through your brokerage account, just like trading stocks.
3. Gold Mining Stocks:
Investing in companies engaged in gold mining can provide exposure to the gold market. However, keep in mind that the performance of mining stocks may not always align perfectly with the price of gold itself.
Getting Started with Gold
Now that you understand the basics of diversifying your portfolio with gold, it’s time to take action. Speaking with a financial advisor can help you determine the optimal allocation of gold in your portfolio, aligning with your financial goals and risk tolerance.
A practical next step is to open a demo trading account with a reputable online broker like VT Markets. This allows you to practice trading gold without risking real money, offering a valuable opportunity to understand the dynamics of the gold market before making actual investments.
Week ahead: Markets to focus on Bank of Japan rate decision and UK, Canada inflation data

This week, the market’s focus will primarily revolve around the Bank of Japan’s rate decision. Investors are eagerly anticipating any statements from the bank’s governor Kazuo Ueda, especially after observing the impact of the strong Japanese Yen arising from a weakening US Dollar. In addition to this, consumer price index (CPI) and gross domestic product (GDP) data for various regions will also be released, possibly further affecting the market.
As always, traders are advised to exercise caution as we approach these significant market highlights for the week:
Bank of Japan’s interest rate decision (19 December 2023)
Following its October meeting, the Bank of Japan (BOJ) maintained its key short-term interest rate at -0.1% and held 10-year bond yields steady at approximately 0%.
No changes are expected in the BOJ’s upcoming rate statement, scheduled for release on 19 December.
Canada CPI (19 December 2023)
Canada’s CPI rose by 0.1% month-over-month in October 2023, rebounding from a 0.1% decline in September.
Analysts expect a decrease of 0.2% in the CPI figures for November, scheduled for release on 19 December.
UK annual CPI (20 December 2023)
The UK’s annual CPI data reflected a decline in the UK’s inflation rate, from 6.7% in August and September 2023 to 4.6% in October 2023.
Analysts expect the UK’s annual CPI to drop further to 4.3% in the next set of updated figures, scheduled for release on 20 December.
US final GDP (21 December 2023)
The US economy saw an annualised expansion of 5.2% in Q3 2023, surpassing a preliminary estimate of 4.9% and marking the strongest growth since Q4 2021.
Analysts expect a 5.2% expansion in the US economy to be confirmed following the release of updated GDP data on 21 December.
UK retail sales (22 December 2023)
Retail sales in the UK declined by 0.3% month-over-month in October 2023 following a revised 1.1% decrease in September.
Analysts expect a 0.5% increase in the next set of UK retail sales figures, scheduled for release on 22 December.
Canada GDP (22 December 2023)
The Canadian economy grew by 0.1% in September 2023, primarily propelled by a 0.3% increase in goods-producing industries. This also marked its first upturn in six months.
Analysts expect a 0.2% increase in the next set of GDP data for Canada, slated for release on 22 December.
US core PCE price index (22 December 2023)
Core personal consumption expenditure (PCE) prices for the US increased by 0.2% in October 2023, marking a slight easing from the 0.3% rise observed in September.
Analysts expect a 0.2% increase in the core PCE price index for the US following the release of updated data on 22 December.


