Back

In May, Michigan’s Consumer Sentiment Index recorded 50.8, falling short of the expected 53.4

The United States Michigan Consumer Sentiment Index stood at 50.8 in May, falling short of the anticipated 53.4. This data point reflects consumer confidence in the economic outlook and is crucial for assessing consumer spending behaviour.

EUR/USD experienced a decline to three-day lows around 1.1130. Despite the decrease in the U-Mich index, the US Dollar gained support as inflation expectations rose.

GBP/USD dropped back to 1.3250 as USD buying intensified, indicating strong US Dollar movement. The rise in US consumer inflation expectations contributed to this trend, according to data from the U-Mich survey.

Gold Prices And Us Dollar Movement

Gold prices fell sharply below the $3,200 mark after a previous rally, affected by a recovering US Dollar and decreased geopolitical tensions. The XAU/USD remains on track to register its largest weekly loss of the year.

Ethereum’s price remained stable above $2,500 following a significant increase since April. Increased adoption of the ETH Pectra upgrade demonstrated positive market reaction with over 11,000 EIP-7702 authorisations in a week.

President Trump’s Middle East visit led to numerous high-profile deals intended to bolster US trade relationships. This development aims to correct trade imbalances and strengthen American leadership in defence and technology exports.

The lower-than-expected Michigan Consumer Sentiment Index in May, which came in at 50.8 against forecasts of 53.4, points to weaker confidence among households regarding the future state of the economy. A result this subdued often precedes more cautious discretionary spending, which tends to feed back into retail and services demand metrics over the following quarters. It can be tempting to interpret this sentiment drop as a buy signal for risk assets, especially when viewed in isolation, but that would miss the wider implications of the inflation expectations buried within the same report. Those expectations shifted higher—even as overall sentiment dipped—and that nuance rebalanced trader sentiment sharply toward the dollar.

This dynamic was reflected most clearly in the EUR/USD and GBP/USD pairs, both of which reversed their earlier moves. The euro’s slip to 1.1130, a level last seen three sessions ago, may seem confusing at first given the soft consumer data. However, we need to remember that the bond market reacted more to the pricing in of stickier inflation than to the sentiment surprise. Our experience tells us that when expectations of longer-lasting inflation rise, traders often pre-emptively back the greenback to hedge across assets—an instinct that was present again here.

Sterling followed a similar path. The pound fell back to 1.3250 against the dollar, largely as a result of increased USD buying across the board. It’s clear that inflation fears nudged Treasury yields up again this week, drawing flows toward dollar-denominated assets. The post-survey adjustment was rapid, with speculative positions reflecting this shift almost as soon as the revised data crossed the wires.

Gold And Ethereum Price Stability

In the commodities space, the sharp move lower in gold, slipping under the $3,200 level, marked a break after weeks of climbing momentum. Weakened geopolitical risk, including a few de-escalations in regions that typically support safe-haven bids, effectively removed one of the primary drivers behind the recent rally. Overlay that with a reinvigorated dollar and short-term technical triggers, and the sell-off was both sharp and widespread. Weekly forecasts show XAU/USD on pace for its worst performance of the year so far, with futures traders tightening risk on long gold derivatives earlier than expected. Notably, several positions linked to ETF flows shed exposure in sync with the stronger dollar bid.

ETH, by contrast, managed to hold firm above $2,500, broadly maintaining the gains chalked up since April. The uptake of the Pectra upgrade—especially the EIP-7702 smart contract authorisations surpassing 11,000—illustrates tangible developer confidence. This is not merely speculative repositioning. When network participation increases alongside price, there’s typically a medium-term positioning benefit that begins to show up in options open interest. We are already seeing that pre-emptive hedging behaviour pick up with more consistent call spreads being written at higher levels.

Turning to geopolitics, the former administration’s recent tour through key parts of the Middle East was not just symbolic. Several of the joint statements signed are multi-year agreements with delivery pipelines baked in. Considering the nature of these defence and tech-related deals, the downstream effects fall more on industrial equities and manufacturing output indicators over time. From a market-making perspective, the longer view is needed. These contracts won’t impact next month’s numbers, but they’re likely to factor into second-half positioning, particularly in sectors exposed to aerospace and advanced computing exports.

In the next few weeks, we expect derivatives markets to remain event-driven. Short-term setups must be weighed against macro inputs more carefully, especially as traders adjust to the inflation-forward interpretation of recent sentiment data. Timing entries without watching both real yields and dollar funding pressures will be difficult. It’s not a straight path, but the directional cues remain clear when we step out of the intraday noise.

Create your live VT Markets account and start trading now.

The upcoming UMich report may alter inflation expectations, impacting interest rates, asset classes, and markets

May’s University of Michigan Consumer Sentiment report is expected today. While many anticipate a decrease in inflation expectations due to recent trade developments, further increases in these expectations would be unexpected.

The Federal Reserve is especially focused on inflation expectations and may exercise caution regarding rate cuts if growth picks up soon. A premature rate cut might lead to increased inflation expectations and rising long-term Treasury yields, contrary to some beliefs.

The Federal Reserve Target Challenge

The Federal Reserve faces the challenge of not having reached its target amid optimistic growth forecasts, potential economic activity surges, tax cuts, deregulation, and existing 10% tariffs. If inflation expectations rise, it may prompt a reevaluation of interest rate expectations across various asset classes.

A hawkish shift may lead to a preference for USD and a decrease in long-term Treasuries. There could also be a reduction in the stock market as current positioning appears overstretched.

These paragraphs highlight how inflation expectations in the United States are being closely watched, especially in relation to the upcoming University of Michigan data. If consumers believe prices will rise more quickly than before, it could mean that people are less confident in the Federal Reserve keeping inflation under control. Central banks often find it harder to manage actual inflation if expectations begin to shift away from target levels. So far, some market participants had anticipated price pressure to soften, likely influenced by recent trade policy revisions, but that assumption may not hold if today’s figures surprise to the upside.

Cautious Stance on Interest Rate Cuts

The central bank, wary of interpreting temporary trends too hastily, is taking a cautious stance—possibly delaying interest rate cuts until higher confidence in disinflation returns. Lowering rates too early, particularly in an environment where the economy starts showing stronger performance, could backfire. It risks fuelling inflation again, especially when fiscal policy is still moderately expansionary. More economic activity puts further pressure on wage growth and consumer prices. Against that backdrop, any uptick in inflation expectations may quickly force expectations around interest rates to shift upward.

Yields on longer-dated bonds could rise as a result, since investors would need higher compensation to lend under less predictable inflation conditions. A pullback in demand for 10- and 30-year Treasuries seems probable if real yields reset higher. That, in turn, might dampen appetite for riskier assets.

Powell and his team appear to be walking a fine line. Positioning across most asset classes suggests that much of the current optimism prices in only benign outcomes—perhaps too optimistically. Overextended long equity and fixed-income positions appear vulnerable if market data starts pushing against the disinflationary narrative.

In the short-term, it seems clear that we need to consider the bond-equity correlation carefully. If a rebound in growth leads the Fed to adjust course, and inflation readings climb higher with it, this may initiate a repricing scenario. From our point of view, it’s better to avoid assumptions of a quick policy reversal. Rather than planning for imminent rate relief, it may be wise to prepare for pricing to reflect higher-for-longer conditions.

Dollar exposure shows signs of becoming more attractive in this setup, particularly with nominal differentials looking less negative. Tactically, there’s little reason to expect a smooth ride in rates-sensitive pairs if incoming CPI and labour figures remain sticky. Treasury futures could stay under pressure should real rates shift back into focus.

With sentiment leaning heavily on the idea that the Fed’s next step involves cutting, any data that challenges this belief would be disruptive. We’ve seen positioning that depends on a soft-landing scenario with little policy tightening—this doesn’t fully reflect the upward risk to rates or the resilience in underlying consumer activity. Equity valuations have run higher while discounting fewer earnings risks, and any move in yields could stir volatility.

From a derivatives perspective, implied volatility curves may look cheap under these conditions. Skew towards downside put hedges might steepen if realised volatility picks up on repricing concern. In this context, shorter-term gamma exposure may offer better entries than committing to duration-heavy views susceptible to mispricing.

It remains best, then, to stay nimble and carefully assess cross-asset dynamics week by week. Sentiment shifts tend to start in rates and ripple outward.

Create your live VT Markets account and start trading now.

A rise in the five-year consumer inflation expectation in the United States reached 4.6%

The University of Michigan’s 5-year US consumer inflation expectation increased from 4.4% to 4.6% in May. This rise in inflation expectations supported the US Dollar, despite weaker indices.

The EUR/USD saw a decline to three-day lows around 1.1130, as the euro faced pressure against a stronger USD. Supporting this was the rise in US consumer inflation expectations.

Forex Market Movements

In the forex market, GBP/USD dipped to 1.3250 as USD-buying resumed. The US Dollar’s strength comes amid increased consumer inflation expectations stemming from the recent U-Mich data.

Gold’s value fell below $3,200 on Friday, reversing gains from the previous day. The decrease was influenced by a stronger US Dollar and reduced geopolitical tension, leading to reduced demand for gold.

Ethereum’s value continued its upward trend, standing above $2,500 after nearly doubling since early April. The recent ETH Pectra upgrade has generated over 11,000 EIP-7702 authorizations, reflecting strong acceptance among wallets and dApps.

Donald Trump’s upcoming May 2025 Middle East visit is poised to create substantial business deals. The deals focus on enhancing US trade relationships and boosting leadership in defence and technology exports.

Market Recalibration

These recent shifts reflect a market recalibration that places growing weight on inflation expectations over immediate economic data. The University of Michigan’s upward revision of 5-year consumer inflation expectations—from 4.4% to 4.6%—sent a clear message: inflation isn’t retreating quickly. And even though stock indices failed to impress simultaneously, the US Dollar scaled higher, drawing strength from the prospect of persistent price pressures.

When the dollar gains like this, it doesn’t do so quietly. We could see that clearly as the EUR/USD skidded to three-day lows around 1.1130. What’s hammering the euro is not some fresh weakness out of the eurozone. Instead, it’s the mere fact that traders now assume the Federal Reserve may hold rates higher for longer. That assumption tilts demand away from the euro and strengthens demand for USD assets. Likewise, sterling isn’t sheltered either—GBP/USD softened to 1.3250, revealing how quickly previous optimism over UK data gets overshadowed once the greenback attracts new flows. The dollar, in this case, isn’t climbing on strength from employment or consumption—it’s climbing because inflation reluctance implies tightened conditions may not ease soon.

Gold’s retreat below the $3,200 level is another moment to unpack. When the dollar climbs while worries about global conflicts subside, traditional hedges like gold quickly fall out of favour. Traders pulled back from bullion, not because of rumbles in macroeconomic performance, but due more to reduced urgency for safer assets and rising opportunity costs of holding non-interest yielding assets like precious metals.

Meanwhile, Ethereum’s advance past $2,500 bucks this broader retracement narrative. The rise, nearly doubling since early April, is being carried by more than general risk appetite. The recent upgrade associated with EIP-7702 has already been widely adopted, with over 11,000 authorisations recorded from wallets and decentralised applications. That sort of traction speaks not to speculative froth but increasing integration, which could attract even more capital if technical indicators keep moving in tandem.

While geopolitical heat has cooled somewhat in recent days, it may not stay quiet for long. The anticipation around former President Trump’s 2025 Middle East visit is already being discussed in boardrooms—especially among firms with vested interests in aerospace, defence, and security contracts. The emphasis on bilateral trade and technology cooperation stands to create tailwinds for certain sectors, even if broader policy details are still being finalised.

So, how to move forward? Watch interest rate expectations more closely than calendar data drops alone. Pressure across FX, commodities, and digital assets is reacting faster to changing inflation sentiment than it did earlier in the year. In derivatives, be prepared for wider swings tied not just to data outcomes, but to what those figures imply for central bank patience. Shorter-term setups might outperform medium-duration positioning if rate outlooks diverge between major economies. Keep an eye not only on inflation reads but also on forward-looking measures embedded in consumer surveys—we’ve seen how even these softer indicators can spark currency realignments.

Create your live VT Markets account and start trading now.

Major currencies remained stable, while gold experienced a decline amid light trading activity

US officials plan to send letters soon to other countries for trade deals, while Global Times suggests extending the US-China trade truce. A South Korean delegation will visit the US next week to discuss tariff negotiations, and a potential trade deal is expected after the 8 July deadline.

Regarding interest rates, Fed’s Bostic predicts only one rate cut this year due to uncertainty. ECB’s Villeroy describes the current situation as a trade war, not a currency war. ECB’s Kazāks advocates for a meeting-by-meeting approach, and SNB’s Schlegel states Switzerland is not a currency manipulator.

Market Overview

Markets saw NZD lead and CHF lag, with European equities higher and US 10-year yields down 5.7 basis points to 4.398%. Gold fell 2% to $3,175.20, WTI crude rose 0.3% to $61.80, and Bitcoin climbed 0.2% to $103,712.

The dollar remained stable against the euro and yen, with EUR/USD near 1.1200 and USD/JPY around 145.60. USD/CHF rose 0.1% to 0.8368, while USD/CAD stayed nearly flat. Bond yields slightly decreased, with 10-year yields at 4.40% and 30-year yields at 4.86%.

The article outlines ongoing and upcoming trade negotiations across several major economies, alongside recent central bank commentary and market moves.

Trade discussions are widening, with the United States looking to spark or amend agreements beyond Asia. Correspondence is expected to be dispatched to multiple countries, which signals a fresh round of trade outreach. Meanwhile, commentary from Chinese state-run media points to a preference for preserving the relative calm in US–China trade relations. That timing isn’t incidental; we’re midway through the year, and several deadlines are now in focus.

A delegation from Seoul will soon meet with US officials to review tariffs. It’s understood a deal may be arranged around early July, likely post the 8th, giving both sides breathing room to finalise details. This type of targeted engagement has a useful knock-on effect for industries sensitive to trade frictions, particularly in sectors like semiconductors and automotive goods. For us, it reinforces how specific dates can anchor volatility and set direction even before official agreements are inked.

Monetary Policies and Currency Trends

On the monetary policy front, Bostic gave a clear steer that a rate cut is still on the table but will remain singular unless future data compels otherwise. That creates a narrow policy window. It’s not an aggressive stance, but nor is it entirely hands-off. Villeroy’s analogy of a “trade war” carries weight, especially amid fragmented global policy stances. Notably, Kazāks supported a case-by-case approach to rate decisions—this response framework is more cautious than reactive, and in current terms, it maps neatly to the current inflation path.

For Switzerland, Schlegel clarified their role in currency markets, rebuffing any accusation of manipulation. That’s pertinent; the franc’s underperformance this week happened not because of sharp intervention, but due to overall market alignment around yield differentials. If it signals anything further, it’s that central banks are increasingly vocal in pre-empting narrative drift.

Regionally, the New Zealand dollar outperformed, supported by either soft-landing optimism or forward yield premium—likely both—-while the Swiss franc underwhelmed. Equities in the euro area continued their gradual rise, helped by a pullback in yields and the lack of fresh policy shocks. The US 10-year yield dropped to 4.398%, suggesting confidence that rate normalisation can last a little longer before re-steepening resumes. It’s worth noting that core fixed income continues to drift lower in yield without panic or external catalysts.

Commodities reflected this mixed tone. Gold shed another 2%, now sitting at $3,175.20, which reflects shifting expectations on rates and inflation rather than safe haven outflows. Crude oil, via WTI, added a modest 0.3%, hovering near $61.80 per barrel. It’s unremarkable in volume but more reflective of supply reassessment than demand surge. Meanwhile, Bitcoin ticked up again, quietly registering a gain of 0.2% at $103,712—less about conviction buying and more to do with liquidity shifts driven by cash instruments.

The foreign exchange market was relatively balanced. The dollar was steady—EUR/USD found rhythm near 1.1200, providing little room for breakout trades; USD/JPY hovered around 145.60, with minimal intervention chatter; USD/CHF inched up 0.1% to 0.8368. Broadly, this suggests sustained interest rate spreads are holding firm across G10. USD/CAD barely budged, again highlighting how stable petroleum names often correlate with neutral CAD flows.

In rates, 10-year bond yields settled at 4.40% while 30-year treasuries edged to 4.86%. This yield compression supports the outlook that we’re not in a dislocation phase, but rather tracking expectations that don’t yet require recalibration. For those watching the next few weeks closely, the implications are clear. Yield stability plus modest FX adjustments limit room for leveraged repositioning. The next shift will likely come from policy minutes or scheduled data surprises—not the flow itself. Let’s stay patient and alert across sessions.

Create your live VT Markets account and start trading now.

During North American trading, the USD/JPY pair recovers slightly to approximately 145.50, down 0.1%

Japanese Yen Performance Despite GDP Decline

The Japanese Yen performs well despite weak GDP data, with a 0.2% decline in early 2023 against projections of 0.1%. Previously, the economy expanded by 0.6% in Q4 of 2024. The Yen showed its strongest performance against the Swiss Franc in currency exchanges.

USD/JPY retraced from a recent high of 148.54 to near 145.00. The pair finds support from the 20-day EMA around 145.20. The RSI struggles to surpass 60.00, suggesting potential bullish movements. A rise past 148.57 could lead to levels around 150.00. Conversely, breaks below 142.42 may see dips toward 139.90 or 137.25.

We’ve seen the USD/JPY pair settle around 145.00, which came after a brief spike closer to 148.50 earlier in the month. The price action has pulled back but continues to find footing around its 20-day exponential average, just above the psychological 145.00 level—this continues to act as a short-term support. As this technical marker holds, it becomes less about guessing and more about observing how price behaves near the boundary.

Markets had expected Japan’s economy to shrink slightly in the first quarter, and while it did contract, the number was lower than forecasts gave room for. Often, when an economy comes in softer than estimates, especially after a stronger end to the previous year, it can send the domestic currency into a slide. Yet here, the Yen bucked the trend. It performed well—even strengthening against the Swiss Franc—suggesting defensive positioning and capital flows tied more to global concern and less about local data. That matters.

Meanwhile, the US Dollar remains stable after initially losing ground. The DXY drifting sideways around 100.80 tells us there’s an absence of urgent directional bias, at least from the broader Dollar-based markets. Traders are carefully watching incoming data. In particular, the preliminary Michigan sentiment reading for May now carries weight, especially after the April figure took a tumble to 52.2. We watch these numbers not only because they reflect consumer mood, but because they help shape expectations for future central bank action. If confidence softens further, that would likely have knock-on effects for interest rate projections.

Technical Analysis Of USD/JPY Levels

Murata’s GDP print marks a return to contraction for Japan—unexpected by a small margin—but still showing that economic momentum is struggling. Though last quarter growth was encouraging, a reversal like this paints a picture that’s uneven. In our view, this places the Bank of Japan in a position where they are forced to stay accommodative, wary of making any tightening moves too soon. Contrast this with Powell’s camp in the US, where rates have stayed high, and inflation is still under the microscope. The divergence continues to define broader trend direction in USD/JPY.

Technically, the resistance at near 148.50 remains intact. Momentum indicators, such as the RSI, have not been able to convincingly push above the 60.00 level. This usually indicates there’s not enough strength in the current buying pressure to sustain a larger move upward. However, the structure is still in favour of higher levels—so long as price remains above that 145.00 marker. Should buyers gather enough strength to clear 148.57, the path opens toward 150.00, a level not seen since late 2022 and one likely to attract attention from central banks.

Below current levels, if sellers step up, we’ll be eyeing 142.42 as the first key level. If that doesn’t hold, then 139.90 becomes a natural target with 137.25 farther out. For now, range trading around the current band appears to dominate. It reflects a wait-and-see approach, especially with macro fundamentals not pushing decisively one way.

We continue to monitor yield spreads between JGBs and Treasuries. The wider they get, the more it favours the Dollar, unless risk sentiment abruptly shifts. The next few sessions, particularly with fresh US consumer data and any follow-up commentary from the Fed, will likely give more clarity. Until then, it’s about timing entries carefully and respecting levels that have proven durable under recent pressure.

Create your live VT Markets account and start trading now.

Schlegel affirmed Switzerland’s lack of currency manipulation, focusing instead on price stability concerns and interventions

The Swiss National Bank (SNB) states that Switzerland is not engaging in currency manipulation. The actions taken are meant to reduce the Swiss Franc’s overvaluation to maintain price stability, rather than to secure trade advantages. Technical experts in the US reportedly understand this position.

Although Switzerland has used negative interest rates in the past, the SNB does not favour them. However, it admits that such measures might be required again. Alongside the Bank of Japan (BoJ), the SNB remains one of the most active central banks in intervening in currency markets.

Currency Manipulation Definition

A currency manipulator is defined as a country that alters its exchange rate to gain undue benefits in global trade. The SNB and BoJ’s interventions are focused on price stability, not manipulation for trade advantages. Comments on negative rates have been consistent over recent months.

What the current article tells us, in clear terms, is that the Swiss National Bank is actively working to keep its currency from being too strong, but not for the reasons some might assume. Their intent isn’t to push exporters into a more favourable position or gain a better trade balance. Instead, they’re trying to keep inflation in check. The franc has a tendency to strengthen quickly when global uncertainty rises, and when that happens, domestic prices risk falling too much. That’s harmful.

Regarding interest rates, although they’ve gone negative before, the preference remains not to use them unless circumstances demand it. It’s more of a tool kept for emergencies than a first choice in policy. By positioning themselves carefully, both the Swiss and Japanese central banks are signalling that stability matters more than competitive advantage in trade. This sets them apart from jurisdictions that might lean toward more aggressive devaluation strategies.

Now, when we read between the lines, this matters for those of us trading interest rate futures, FX options, or volatility products tied to these currencies. Whether we’re modelling carry plays or defining skew based on central bank paths, these cues help frame the risk. If negative rates are back on the table, even if not likely in the short term, the floor for terminal rate assumptions can’t sit too far above neutral. This directly impacts forward guidance expectations and pricing through the 2-year part of the curve.

Swiss Franc Derivatives Pricing

Jordan’s tone remains aligned with previous statements, which means no surprise directional shifts are imminent. But heavy currency involvement always injects short-term noise. In risk terms, that tells us to be cautious about sharp reversals driven by policy commentary rather than fundamental flows. For longer-dated trades in the Swiss franc, a neutral to mildly dovish stance may still be embedded in derivatives pricing. Short-term positioning should account for the likelihood of temporary spikes in realised volatility driven by interventions or market misunderstandings.

We also shouldn’t overlook the indirect signal being sent to other monetary authorities. If this level of transparency continues, we may see slower reactions from speculative flows that traditionally expect central banks to “blink.” That ultimately lowers the chances of chasing abrupt moves at the margins, making liquidity easier to manage across time zones.

So, in the next few weeks, it’s sensible for us to review hedging ratios, particularly those tied to vega risk near key data prints. Our implied expectations may be lagging if they’re based on policy inertia. The messaging is more deliberate now—and small moves will be defended quickly. Not with surprise, but with steadiness. That matters when shaping exposure in Swiss franc pairs especially, where traditional fundamentals often don’t explain half the move.

Finally, for those operating in the volatility space, this atmosphere presents more steady ranges than cliff-edge action. If convexity plays are part of the approach, adjustments may be needed to reflect lower expected snapback alongside persistent intervention tones.

Create your live VT Markets account and start trading now.

In March, Russia’s foreign trade increased from $10.5 billion to $11.756 billion

Russia’s foreign trade experienced an increase, rising from $10.5 billion to $11.756 billion in March. This growth marks a positive change in the trade metrics for the country.

The data reflects changes in economic activities and transactions, indicating shifts in the global trade dynamics. Such numbers can influence economic forecasting and strategies.

Russia’s Trade Dynamics

That $1.256 billion rise in foreign trade from February to March, represented in simple figures, shows more than just an uptick in revenue—it tells us that Russia is, to some extent, actively re-routing its commercial channels to maintain momentum. While the month-on-month jump is noteworthy, what matters more is underlying consistency, not just a one-time adjustment reflecting supply chain repositioning or short-term pricing effects.

From a data-driven perspective, shifts like these often prompt recalculations in regional risk models. For us, it could mean broadening the scenarios applied to advanced derivative pricing, especially in rate-sensitive instruments where exposures link to macroeconomic shifts. That includes taking a closer look at forward-looking volatility linked to commodities and freight, areas directly impacted by trade volumes from jurisdictions under sanctions or alternative payment arrangements.

Nabiullina’s policy stance complements this shift. The feedback loop between the Central Bank of Russia’s monetary flexibility and its export-import flows seems tighter than usual. When trade expands during periods when policy signals are bypassing tightening, it leaves the door open for renewed currency movement, especially if the rouble tries to find a floor through non-dollar settlements. Currency-linked swaps are unlikely to remain muted. We should treat FX vol curves with more sensitivity.

Governance And Trade Stabilisation

Mishustin, on the governance end, has facilitated stabilisation measures without making too much noise. Fiscal support hasn’t been completely pulled back, despite global signals pointing towards synchronised tightening. Hence, carry trades that previously leaned on assumptions of declining export margins may need adjusting. Underwriters in the options market who had priced in reduced FX earnings may now face unmatched delta risk if pricing models use stale trade assumptions. One fix would be stress-testing implied correlations across rouble and crude baskets over weekly intervals to detect drift.

Put simply, the data point is a prompt: reconsider skew positions, especially those related to dollar-rouble pairs or shipping corridors through non-European routes. This doesn’t call for abrupt allocation changes but it does warrant shifting exposure duration on short-term derivatives from days to weeks. Given the friction in clearing routes and the watchful eye on sanctions compliance, the risk premium has shifted in ways not fully registered yet in short-dated vol.

Strong figures emerging in periods of constrained system access usually correlate with more aggressive hedging on the state side, which we often see mirror shifts in swap spreads. If history offers any guidance, compression could lag by two or three weeks, especially when reporting transparency becomes difficult to benchmark on global indices. We may prefer to lean into forward contracts where payment terms are known or guaranteed. Anything settlement-heavy should be verified against compliance desks for spillover effects.

Traders will benefit from staying alert to cross-instrument feedback loops—what emerges in trade data today might ripple into disconnected positions tomorrow, especially where synthetic exposure masks the real risk. Markets don’t wait for thresholds to be met; they often respond to conviction in data, regardless of origin.

Create your live VT Markets account and start trading now.

Week ahead: Fed policy shifts & geopolitics move the markets

Big moves are in play this week. With the Fed is shaking up its policy framework, and zero interest rates no longer being the default, markets are bracing for the potential ripple effects on markets, borrowing costs, and economic growth.

Meanwhile, the Russia-Ukraine peace talks have been pushed to May 16, but the bigger question is: Who’s showing up? Zelensky, Trump and the Kremlin, are all showing contrasting stands against one another, setting the stage for another diplomatic standoff.

In the Middle East however, Hamas signals a major shift, expressing willingness to relinquish control of Gaza if a permanent ceasefire can be secured.

As the world watches, markets react, and power players move, one thing is certain: This week will be one to watch.

Key Economic Indicators

Monetary Policy & Fed

  • Fed is adjusting its overall policy framework, with zero interest rates no longer being a baseline assumption. Regulators also plan to ease leverage rules for large banks in the coming months.
  • Language on underemployment and average inflation to be reconsidered.
  • April core PCE inflation expected to fall to 2.2%.

Trade & Tariffs

  • Japan seeks third round of U.S.-Japan trade talks next week.
  • U.S. considering modifications to the current U.S.-Japan trade agreement.
  • EU to accelerate trade talks with the U.S.; aims for deeper tariff cuts than what the U.K. has received.

Russia-Ukraine Talks

  • Peace talks postponed to May 16.
  • Zelensky: a technical ceasefire deal could make meeting Putin unnecessary.
  • Trump: may attend talks in Turkey; says no progress until he and Putin meet.
  • Kremlin: Putin has no plans to attend or meet Trump.

Middle East

  • Hamas official: Willing to give up Gaza control if a permanent ceasefire is achieved.

Energy Market

The IEA has revised its 2025 forecasts as below:

  • Oil demand growth up to 740,000 barrels/day.
  • Supply growth up to 1.6 million barrels/day.

Crypto

  • Coinbase reported a data breach involving customer information, refusing a $20 million ransom from hackers.
  • The SEC is investigating an alleged misreporting of user numbers.

Market movers

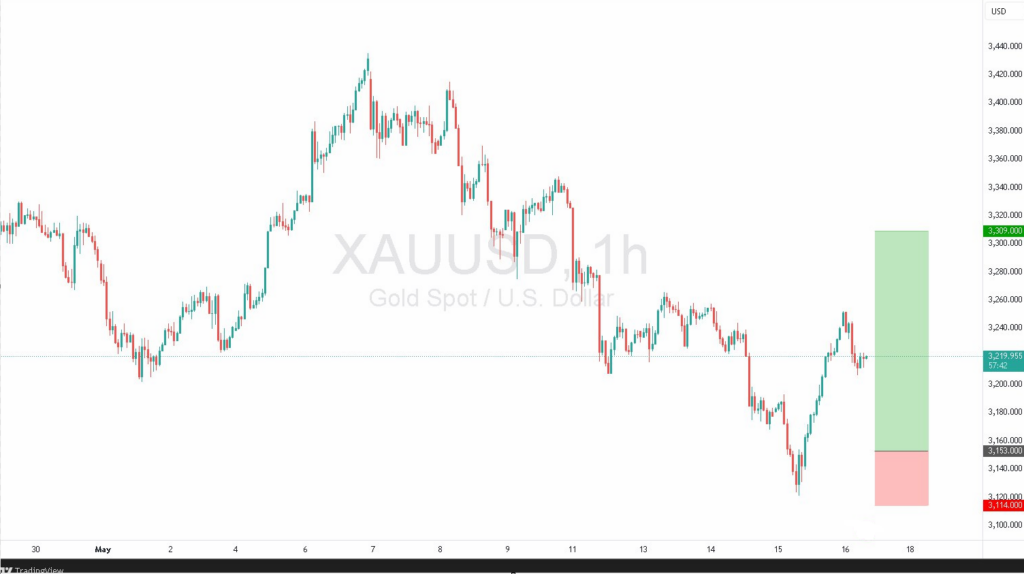
XAUUSD

  • The primary trend remains firmly bullish.
  • Price action suggests a potential bottom is forming.
  • A short-term pullback appears likely.
  • Preferred strategy is to buy on dips.
  • Key bespoke support is identified at 3153.0.

Trade Opportunity: Target 1: 3309 / Target 2: 3335

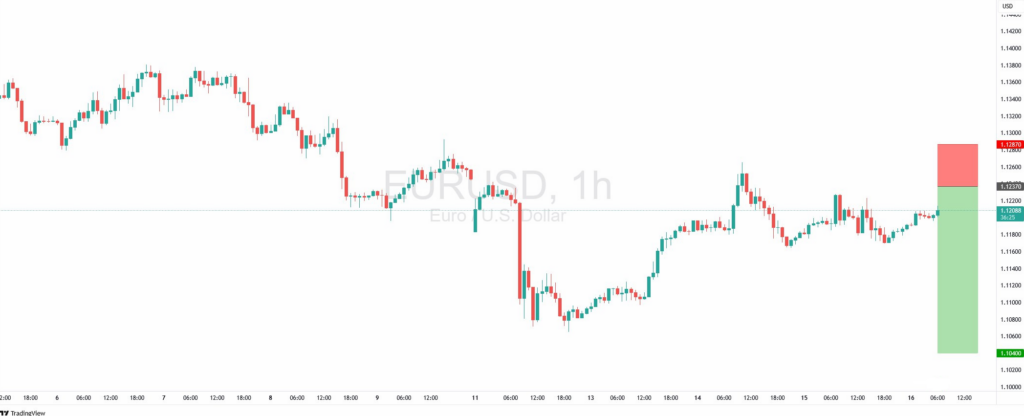
EURUSD

  • EUR/USD posted modest daily gains, though price action remained contained within the range from the prior trading day. This is an indecisive Inside Day.
  • Buying interest emerged during the Asian session.
  • On an intraday basis, price is trading between bespoke support at 1.1040 and resistance at 1.1237.
  • Market conditions are expected to stay mixed and volatile.
  • Preferred strategy is to sell into rallies.

Trade Opportunity: Target 1: 1.104 / Target 2: 1.101

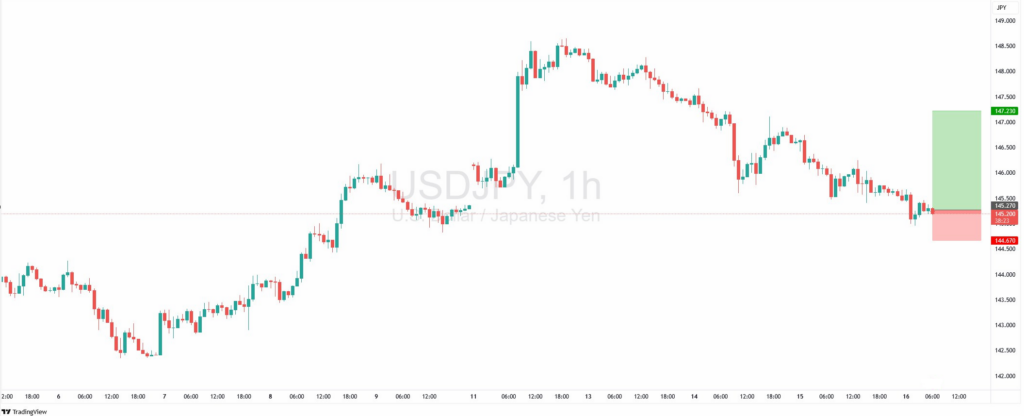
USDJPY

  • Prices are pushing higher, breaking out from a bullish flag/pennant pattern.
  • Three consecutive days of negative daily performance.
  • Selling pressure emerged during the Asian session.
  • Intraday, price is trading between bespoke support at 145.27 and resistance at 147.23.
  • The short-term structure reflects a sequence of lower highs and lower lows.
  • A break below 145.27 is required to confirm continued bearish momentum.

Trade Opportunity: Target 1: 147.23 / Target 2: 149

News headlines

Currencies

The U.S. dollar weakened against major peers following softer-than-expected producer price inflation data, with the Dollar Index slipping to 100.80.

  • EUR/USD edged up by 10 pips to 1.1184.
  • USD/JPY dropped sharply by 115 pips to 145.60, marking its third consecutive daily decline.
  • GBP/USD gained 44 pips, settling at 1.3303, after the U.K. reported stronger-than-expected Q1 GDP growth of 0.7% quarter-on-quarter compared to the forecast of 0.6%.
  • AUD/USD declined 21 pips to 0.6405.
  • USD/CHF lost 67 pips to 0.8351
  • USD/CAD dipped 24 pips to 1.3958.

What happened in the U.S. market

The stock market closed higher on Thursday:

  • Dow Jones gained 271 pts (+0.65%) to 42,322
  • S&P 500 rose 24 pts (+0.41%) to 5,916
  • Nasdaq 100 added 16 pts (+0.08%) to 21,335

It is important to observe that that both the S&P 500 and Nasdaq 100 have been extending their winning streak to four sessions.

However, the 10-year Treasury yield fell 8.9 bps to 4.439%, likely influenced by key economic data as below:

  • PPI (April): +2.4% YoY (vs 2.6% expected, 3.4% prior)
  • Retail Sales: +0.1% MoM (vs -0.1% expected, +1.7% prior)

What happened in the European market

Stock market saw some overall gains, with the German index DAX up 0.72%, the French index CAC up 0.21% and the British index FTSE up 0.57%.

What happened to global commodities

With President Trump signaled a potential nuclear deal with Iran, the market speculated that there may be eased sanctions and increased oil supply entering the picture. As such:

  • Gold surged $62 (+1.97%) to $3,240/oz
  • WTI crude fell $1.53 (-2.42%) to $61.62/bbl, extending its decline

Click here to open account and start trading.

Despite exceeding earnings expectations, Doximity’s stock fell; quarterly EPS rose significantly compared to last year

Doximity recorded an impressive fiscal fourth-quarter 2025, with adjusted earnings per share of 38 cents, surpassing expectations by 40.7%. Compared to the previous year’s quarter, where earnings were 25 cents per share, there was a notable improvement.

The company’s fiscal 2025 adjusted earnings were $1.42 per share, marking a 49.5% increase year-over-year. GAAP net income per share rose to 31 cents, compared to 20 cents in the same quarter a year ago.

Strong Revenue Growth In Fiscal 2025

Revenues grew 17% year-over-year to $138.3 million, driven by subscription revenues of $131.9 million. The annual revenue for fiscal 2025 was $570.4 million, up 20%, with subscription revenues reaching $543.8 million, an increase of 21%.

Despite these achievements, DOCS shares fell 20.7% post-earnings release and 9.5% year-to-date. The broader S&P 500 Index saw a decrease of 0.3% in the same period.

Adjusted gross profits reached $126.5 million, with a gross margin of 91.4%. The company’s research and development, as well as sales and marketing expenses, rose significantly year-over-year.

Doximity’s cash and cash equivalents ended the quarter at $915.7 million, with total assets at $1.26 billion. For fiscal 2026, revenue guidance is between $619 million and $631 million, slightly below analyst expectations.

Future Guidance And Market Reaction

Doximity’s fourth-quarter results for fiscal 2025 came in well above what many had forecast, especially on the earnings front. The adjusted earnings per share (EPS) of 38 cents marked a steep jump not only from last year’s 25 cents but also beat consensus by more than 40%. Over the course of the year, adjusted EPS reached $1.42, which is roughly half again as much as the year before. On a standard GAAP basis, net income per share climbed to 31 cents, adding further confirmation of healthy underlying profitability.

Revenue also grew at a double-digit pace. The latest quarter posted sales of $138.3 million, which was up 17% from the same period last year. Almost all of that came from subscription-based services, which contributed a hefty $131.9 million. Looking at the yearly figures, total revenue climbed 20% to $570.4 million, again largely supported by subscription revenue, which on its own expanded by 21%.

Gross profitability remained strong, with adjusted gross profit standing at $126.5 million. That translates to a 91.4% gross margin, indicating the firm continues to operate with enviable efficiency. However, there’s more to the story. Research and development spending, alongside outlays for sales and marketing, both rose considerably compared to the previous year. These increases likely reflect internal efforts to extend the platform, though they can also weigh on net margins if not carefully managed.

Despite all that, the share price took a sharp turn. Since the earnings were published, the stock dropped more than 20%, adding to a 9.5% decline over the year. During that same time, the S&P 500 shed just 0.3%, suggesting the market punished the stock far more than broader sentiment would justify. The reaction may stem from the forward guidance.

For the year ahead, management expects revenue somewhere between $619 million and $631 million. While still showing growth, this figure landed shy of what many had modelled. It would seem the market is more focused on future momentum rather than past performance. The thermal shift in investor appetite often arrives when high-growth firms move into a phase where growth moderates, and competition intensifies.

Taking this into consideration, the stretched valuations customary to high-margin subscription models appear to be undergoing a stress test. Near-term price action implies expectations have now reset somewhat lower. From our side, positioning ahead of potential sentiment reversals should be based on shorter-dated implied volatility readings, which are still digesting the post-earnings gap. Recent spikes create an opportunity to reassess strike selection and expiry timing.

Where we’ve previously focused attention on long gamma plays around predictable earnings beats, the surprise now lies in how quickly market sentiment can shift, even in the face of solid operational execution. As trading vehicles, options presently reflect a repricing of execution risk rather than business model integrity. That distinction matters, given how implied volatility may stay elevated even as realised price movement narrows.

In practical terms, this means we should look more to rangebound structures in the very short term, possibly neutral or even slightly bearish bias, hedged tightly. The longer-dated term structure has risen, creating opportunities for calendar or diagonal spreads, should new positioning be warranted. Careful monitoring of further guidance updates, especially during the next earnings cycle, will be key here.

Create your live VT Markets account and start trading now.

The market approaches crucial resistance as the S&P 500 rises past the 5,900 mark, questioning sustainability

The S&P 500 index has risen by 0.41% on Thursday, buoyed by optimism surrounding trade negotiations, investments from the Middle East in the U.S., and potential peace in Ukraine. It is now testing a resistance range of 5,900-6,000, approaching its record high from February of 6,147.43.

The index is set to open 0.4% higher today, suggesting continued upward momentum. Thursday’s AAII Investor Sentiment Survey shows 35.9% of respondents are optimistic, while 44.4% are pessimistic about the market’s future.

Nasdaq And Market Volatility

The Nasdaq neared 21,500 before retreating slightly, closing with a marginal gain of 0.08%. It is expected to open 0.5% higher today despite a 5% fall in Applied Materials’ pre-market trading.

Market volatility metrics show declining fear levels, with the VIX trending lower. Typically, a decreasing VIX signals calm in the market, but it also raises the possibility of a downward shift.

S&P 500 futures are trading higher, predicting a positive opening, with support near the 5,870 level. Following Thursday’s rally, traders should watch for potential profit-taking in the short term.

Market Sentiment Analysis

What the existing data reveals is a market leaning towards cautious optimism, though not without potential short-term hurdles. After a 0.41% climb in the S&P 500 driven by renewed hopes in global diplomacy and expanded foreign investment, the index now brushes up against the 5,900–6,000 range—a level that has previously posed difficulty. That corresponds with the all-time high set back in February. This proximity may prompt institutional positioning adjustments, particularly as a re-test of that peak now feels more plausible than speculative.

The minor positive shift expected at today’s market open—roughly 0.4%—extends the upward push and might invite fresh long positions from those who have remained on the sidelines during the week’s earlier moves. Nonetheless, sentiment gauges, such as the AAII survey, present a more nuanced view. With only 35.9% of respondents expressing bullish views and 44.4% pessimistic about what lies ahead, retail participation appears sceptical, perhaps unconvinced by this climb. A sentiment gap of this kind tends to create opportunities in derivative plays, especially those built around mean reversions or contrarian outcomes.

Looking to the Nasdaq, Thursday’s tepid 0.08% rise paints a picture of hesitancy, even as it flirted with levels near 21,500—a marker that has not held well this week. The projected 0.5% lift today is worth noting, though it must now do so against the drag from Applied Materials, which is showing a 5% decline in pre-market action. That kind of individual performance pressure can ripple outward, especially into semiconductor-weighted ETFs and sectoral options strategies.

Where implied volatility is concerned, the lower trending VIX paints a market that appears calm. But a compressed volatility environment often happens before unexpected swings. As fear metrics weaken, intraday movements can catch traders off-guard—especially those who have scaled down hedges. We are watching for potential snapbacks in implied volatility, which can often be amplified in derivative pricing structures, notably in short-dated weekly options.

S&P 500 futures activity is indicating another session of early positivity, placing the next nearby support at around 5,870. That level could become more important over the coming week, particularly if the index starts to reverse. After Thursday’s rally, rotation or short-term profit-taking would not be unexpected and could bring intraday weakness. This makes it a potentially ripe setup for fading strength near resistance or engaging with structured spreads that benefit from sideways or retracing action.

Current positioning suggests a growing appetite for risk, but this is not without bounds. The speed of the recent rally and the approaching prior high increase the probability that participants begin pricing in consolidation. In these circumstances, short-term contracts with defined risk profiles tend to offer better value than directional bets, especially when premiums are compressed and skew is flat. Keep an eye on how the market handles moves around 5,900—an inability to break and sustain above may lead to abrupt repositioning.

Create your live VT Markets account and start trading now.

Back To Top
server

Hello there 👋

How can I help you?

Chat with our team instantly

Live Chat

Start a live conversation through...

  • Telegram
    hold On hold
  • Coming Soon...

Hello there 👋

How can I help you?

telegram

Scan the QR code with your smartphone to start a chat with us, or click here.

Don’t have the Telegram App or Desktop installed? Use Web Telegram instead.

QR code