Master the Mean Reversion Strategy: Your Guide to Profitable Trading
The mean reversion strategy is a popular trading approach that focuses on the tendency of asset prices to revert to their historical average over time. This strategy can be effectively applied across various markets, including forex, stocks, and commodities. In this guide, we’ll explore the key indicators for identifying mean reversion opportunities, along with its benefits and risks.
What is Mean Reversion?
Mean reversion is a concept used in financial markets that suggests asset prices tend to revert to their historical average over time. This theory is based on the idea that if an asset’s price moves significantly away from its long-term mean, it will eventually return to that mean. For example, if a stock has been trading above its historical average for an extended period, it may be expected to fall back to its mean, and vice versa.
This strategy can be applied across various asset classes, such as stocks, forex, commodities, and indices. Traders use the mean reversion strategy to capitalize on price fluctuations by predicting that overextended moves will eventually reverse.
Key Indicators for Mean Reversion Strategies
Successful mean reversion traders rely on several technical indicators to identify when prices are likely to revert to the mean. These indicators help traders spot overbought or oversold conditions and anticipate price corrections. Some of the most common indicators include:
1. Moving Averages
Both simple moving averages (SMA) and exponential moving averages (EMA) are used to track the historical average of an asset’s price. If the current price significantly deviates from the moving average, it could indicate a potential reversion.
2. Bollinger Bands
Bollinger Bands consist of a moving average and two standard deviation bands. When the price touches or exceeds the upper or lower band, it may signal that the asset is overbought or oversold, respectively, making it a prime candidate for a reversion.
3. Relative Strength Index (RSI)
The RSI measures the speed and change of price movements, helping traders determine if an asset is overbought (above 70) or oversold (below 30). This indicator is especially useful for spotting potential reversals in price trends.
These indicators, used in combination, help traders identify mean reversion opportunities, increasing the accuracy of their predictions.
How Does the Mean Reversion Strategy Work?
The mean reversion strategy works by identifying when the price of an asset is deviating too far from its historical average, creating an opportunity for traders to profit from the expected price correction. Here’s a simple breakdown of how the strategy works:
- Identify Overbought/Oversold Conditions: Using indicators like Bollinger Bands or RSI, traders can determine when an asset has moved too far away from its mean. For example, if a stock has been rallying and the RSI exceeds 70, it may be overbought and due for a correction.
- Enter the Trade: Once an asset is identified as overbought or oversold, traders initiate a buy or sell order, depending on the direction of the reversion. For instance, if an asset is oversold, a trader would enter a buy order, anticipating the price will rise to its historical mean.
- Exit the Trade: The trader exits the position when the asset’s price returns to the mean or when the market shows signs of stabilizing.
Benefits of the Mean Reversion Strategy
The mean reversion strategy offers several advantages that make it a popular choice among traders:
- Consistent Profit Potential: Traders can identify consistent opportunities to capitalize on price corrections when an asset moves too far from its mean, especially in range-bound markets.
- Lower Risk in Sideways Markets: The strategy performs best in flat or sideways markets, where price fluctuations are typically smaller. This makes it less risky compared to trend-following strategies in volatile conditions.
- Predictable Outcomes: Because prices tend to revert to their historical average, the strategy offers a predictable framework for traders, allowing them to make decisions based on historical patterns.
- Effective in Stable Markets: The mean reversion strategy can generate reliable returns in stable markets where price movements fluctuate around a defined mean, reducing uncertainty for traders.
- Flexibility Across Asset Classes: This strategy can be applied across various asset classes like stocks, forex, and commodities, making it versatile for traders in different markets.
Risks and Limitations of the Mean Reversion Strategy
While the mean reversion strategy has its advantages, there are also risks and limitations to be aware of:
- Trends Can Override Reversions: In trending markets, prices may continue to move away from the mean, making it difficult for the mean reversion strategy to work. Strong trends can overpower short-term price corrections.
- Market Volatility: In highly volatile markets, prices may experience extreme swings that do not revert to the mean, leading to larger-than-expected losses if the trend continues in the wrong direction.
- Overestimating the Mean: The historical average may no longer be a reliable reference point, especially if external market factors or changes in the economic environment shift the mean over time.
- False Signals in High Volatility: During periods of high volatility, indicators like Bollinger Bands or RSI may produce false signals, leading traders to enter positions based on market noise rather than a true mean reversion opportunity.
- Short-Term vs. Long-Term Reversion: Mean reversion can be a long-term strategy, but if the market doesn’t revert to the mean within a trader’s desired timeframe, they might face unexpected drawdowns before the price correction occurs.
Popular Mean Reversion Strategies
Several mean reversion strategies have become widely used among traders. Some of the most popular include:
1. Pairs Trading
Pairs trading involves identifying two correlated assets (e.g., two stocks or currency pairs) that typically move in sync. When the price of one asset deviates significantly from its mean relative to the other, traders take a long position on the undervalued asset and a short position on the overvalued one, betting that their prices will converge back to historical levels.
Example: Imagine you’re trading major currency pairs like EUR/USD and GBP/USD, which are historically correlated pairs. If the EUR/USD pair rises significantly while the GBP/USD remains stable, you might go long on GBP/USD (betting it will rise) and short on EUR/USD (anticipating a price drop), expecting the price gap between the two to close.
Learn the differences between a long position and a short position.
2. Bollinger Band Reversals
Bollinger Bands are a tool that measures the volatility of an asset. The bands consist of a moving average and two standard deviation lines. When an asset’s price touches or exceeds the upper or lower band, it suggests that the asset is overbought (upper band) or oversold (lower band). The assumption is that the price will eventually revert to the moving average.
Example: Let’s say you’re trading EUR/USD and the price hits the upper Bollinger Band. This could signal that the currency pair is overbought, and you might decide to sell the pair, expecting the price to revert back down toward the moving average. Conversely, if the price touches the lower Bollinger Band, you might buy, betting that the price will bounce back up.
Discover the 8 most traded currency pairs in the world.
3. Contrarian Trading
Contrarian traders go against prevailing market sentiment, betting that market overreactions will eventually correct. For instance, in a market where everyone is overly optimistic, a contrarian might take a short position, expecting that prices are inflated and will revert to more reasonable levels.
Example: Imagine stock XYZ has been rallying for weeks, and market sentiment is overly bullish. If a contrarian believes the price has become overextended, they might decide to short the stock, anticipating that the price will soon correct as the optimism fades and reality sets in.
Applying Mean Reversion Strategy in Different Markets
The mean reversion strategy can be applied across various markets, but its effectiveness may vary depending on the type of market conditions and asset class. Understanding how this strategy behaves in different markets is crucial for traders.
1. Forex Market
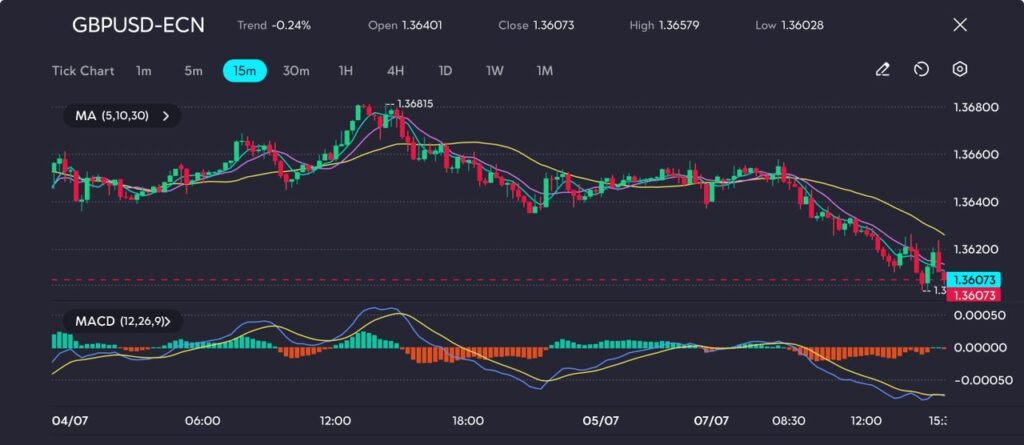
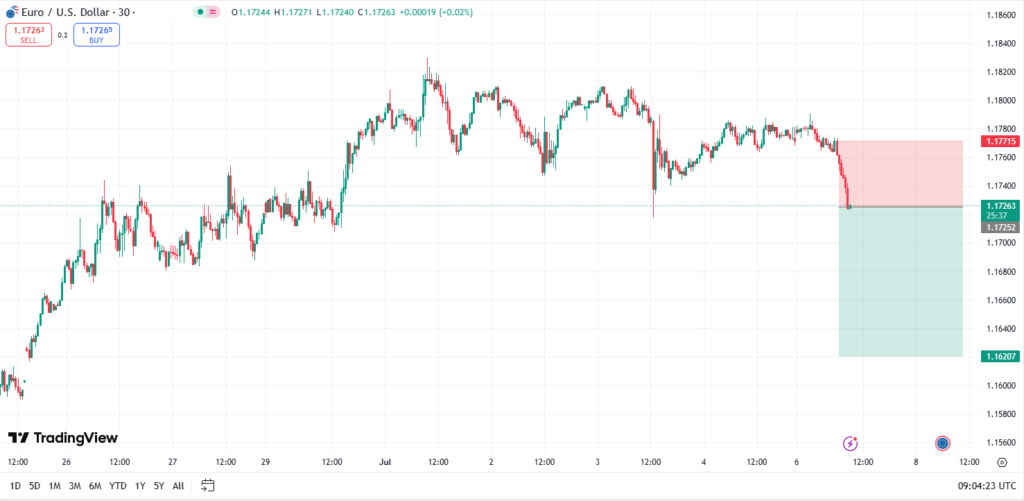
In the forex market, mean reversion works well with currency pairs that exhibit stable volatility. For instance, EUR/USD and GBP/USD tend to oscillate around certain levels, making them ideal candidates for mean reversion trades.
Example: If EUR/USD rises significantly above its 50-day moving average, a trader may anticipate a price correction back toward the average, entering a short position when the price starts to move back downward after touching the upper limit.
Discover the 9 best forex trading strategies you should know.
2. Stock Market
Stocks often experience mean reversion after earnings reports or significant news, where stock prices initially overreact and then return to their historical averages. Traders often use moving averages and RSI to spot when stocks are overbought or oversold and capitalize on the price correction.
Example: After a Tesla (TSLA) earnings report, the stock price may jump to an unsustainable high. A trader might use the RSI to confirm the stock is overbought and take a short position, expecting the price to revert to its average post-report.
3. Commodities Market
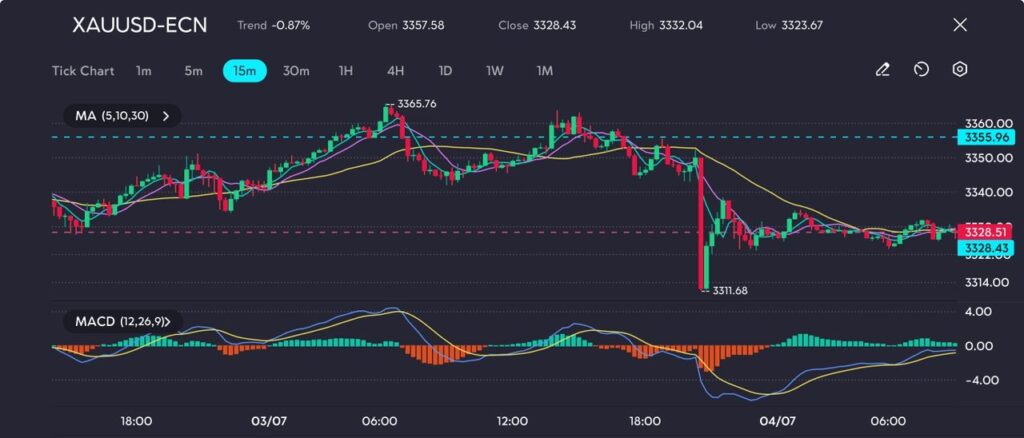
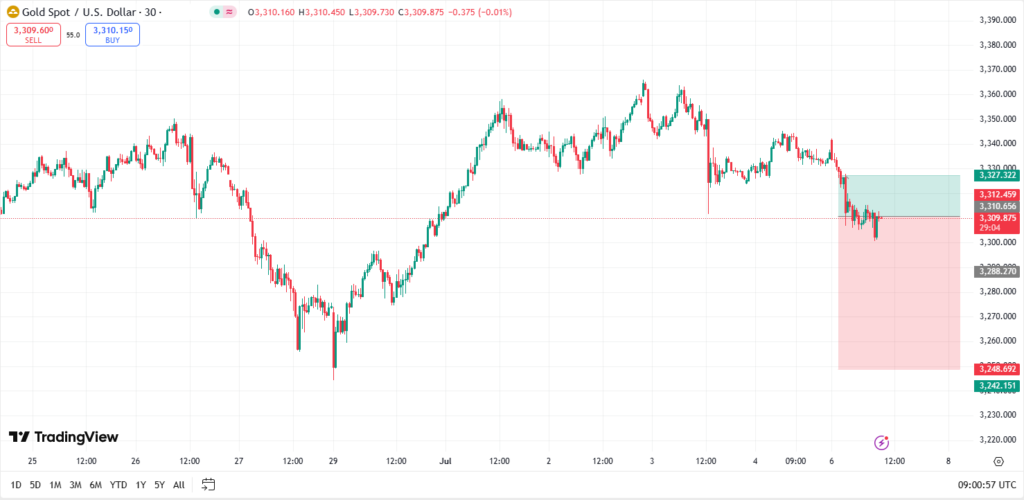
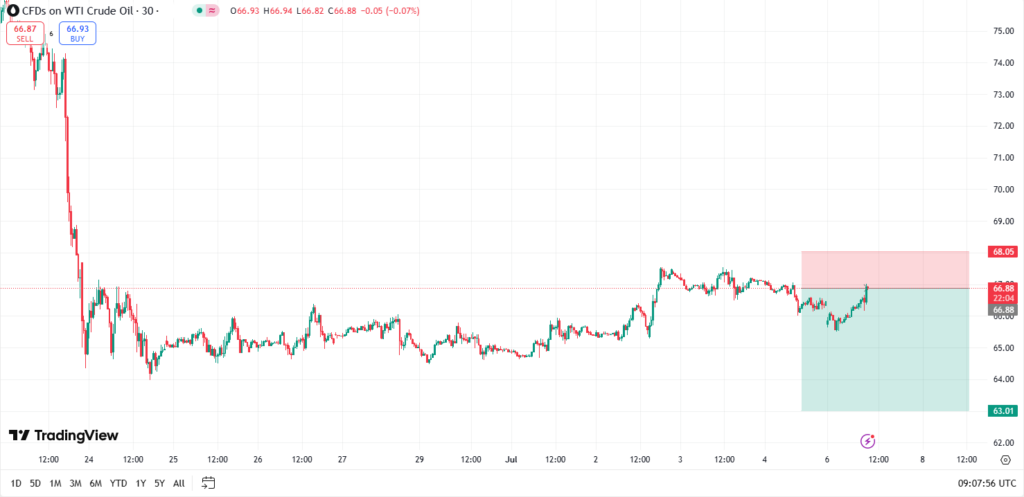
Commodities like gold or oil can show mean reversion during periods of fluctuating demand and supply. Prices may diverge from the mean due to geopolitical events or natural disasters, and once the market stabilizes, prices typically revert to the average.
Example: After a sharp drop in crude oil prices following a supply shock, a trader could look for signs of stabilization in the market and enter a long position, anticipating that oil prices will revert to a more typical level as the supply situation normalizes.
Discover the key differences between WTI and Brent crude oil.
4. Cryptocurrency Market
The crypto market is known for its extreme volatility. While mean reversion can work in this market, it requires extra caution. Cryptocurrencies often experience exaggerated price movements due to market sentiment, regulatory news, or speculative trading.
Example: After a significant dip in Bitcoin (BTC) due to negative news, a trader might use Bollinger Bands to identify when Bitcoin becomes oversold. If it touches the lower band, they may enter a long position, betting on a price reversion to its mean once the market stabilizes.
In Summary
The mean reversion strategy is a popular trading approach that capitalizes on price corrections when an asset moves too far from its historical average. By using key technical indicators such as moving averages, Bollinger Bands, and RSI, traders can identify opportunities for price reversals. While this strategy offers consistent profit potential, it does have risks, especially during trending markets or periods of high volatility. It’s crucial for traders to manage risk effectively and adapt their strategies to current market conditions.
Turn Your Knowledge into Practice with VT Markets Today
At VT Markets, we offer a range of tools and platforms to help you implement the mean reversion strategy successfully. Whether you’re a beginner or an experienced trader, our educational resources, including advanced charting tools, real-time market data, and access to MetaTrader 4 (MT4) and MetaTrader 5 (MT5), can help you take your trading to the next level.
With competitive spreads and the ability to practice strategies risk-free through the VT Markets demo account, we provide everything you need to get started. If you have any questions or need assistance, our Help Centre is always available to support you.
Start trading with VT Markets today and put your mean reversion strategy knowledge into practice.
Frequently Asked Questions (FAQs)
1. What is mean reversion?
Mean reversion is the concept that asset prices tend to move back toward their historical average or mean over time. When the price of an asset deviates significantly from its average, it is expected to return to that mean, creating opportunities for traders to profit from price corrections.
2. What is the best indicator for mean reversion?
The best indicators for mean reversion include Bollinger Bands, RSI, and moving averages. These tools help traders identify overbought or oversold conditions, signaling potential reversals.
3. Can mean reversion work in trending markets?
Mean reversion works best in sideways markets or range-bound conditions. In trending markets, it may fail because prices often do not revert to the mean.
4. How can I manage risk in mean reversion trading?
Risk can be managed using stop-loss orders and position sizing. It’s essential to set clear exit points and avoid chasing trends that could lead to significant losses.
5. What market conditions are best for mean reversion strategies?
Mean reversion works best in range-bound or sideways markets, where prices fluctuate around a specific average. It’s less effective in strong trending markets.
6. How do I identify overbought or oversold conditions for mean reversion?
RSI above 70 indicates overbought, while below 30 indicates oversold. Bollinger Bands can also help, with price touching the upper band suggesting overbought, and the lower band indicating oversold.
7. How do I set the target for a mean reversion trade?
Targets are usually set at the asset’s historical mean or moving average. Traders exit once the price reverts back to this level.
8. What is the role of volatility in mean reversion trading?
High volatility can lead to larger deviations from the mean, creating more opportunities for reversions. However, it also increases risk, so careful risk management is key.
9. Can I use mean reversion in conjunction with other trading strategies?
Yes, mean reversion can be combined with trading strategies like momentum trading or support and resistance to improve entry and exit points.
 | VT Markets")

 | VT Markets")

 | VT Markets")