Back

Forex market analysis: 16 May 2025

Gold prices edged lower to $3,216 per ounce on Friday, with the primary drag came from the temporary easing in U.S.-China trade tensions, where both sides agreed to a 90-day rollback of tariffs. The move reassured markets that the broader economic fallout from prolonged protectionist measures may be avoidable, at least in the short term.

Further weighing on demand for gold, other global hotspots appear to be stabilising. The ceasefire between India and Pakistan is holding, while Russia-Ukraine peace efforts, though now stalling, have not reignited risk-off panic.

Gold Dips as Calm Undermines Safe-Haven Demand

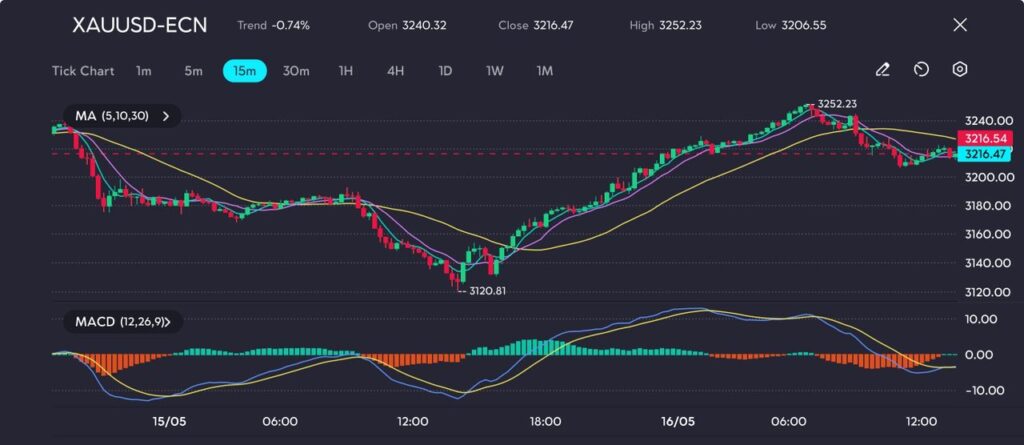
Bullion is now on track for a weekly loss exceeding 3%, retreating from a high of $3,252.23 earlier in the session.

However, the broader macroeconomic backdrop remains favourable for gold as the U.S. consumer inflation data came in soft, reinforcing expectations that the Federal Reserve will begin cutting interest rates likely twice before year-end. Traders are currently pricing in a total of 50 basis points of easing, beginning as early as July.

Still, Fed Chair Jerome Powell issued a note of caution during remarks this week, saying inflation could become more erratic going forward due to frequent supply-side disruptions. This could complicate central banks’ efforts to manage price stability, potentially reigniting gold’s appeal as a hedge against monetary policy uncertainty.

XAUUSD technical analysis

Gold prices initially extended their rebound, surging from a session low of 3120.81 to test resistance at 3252.23 before retreating. The strong upside move was supported by a bullish MACD crossover and upward momentum through the 5-, 10-, and 30-period moving averages on the 15-minute chart. However, the rally lost steam just below the 3260 mark, where sellers re-entered the market.

gold-xauusd

Picture: Gold jumps from $3120 to $3252 before paring gains, with momentum cooling near key resistance, as seen on the VT Markets app

Following the peak, bearish pressure set in, sending gold back below the 30-period MA and prompting a corrective pullback toward the 3215 area. The MACD histogram has flattened, and the signal lines are converging, suggesting the rally may be pausing. Immediate support lies around 3206, while resistance remains firm near 3250. A break below 3200 could open the door to 3180, whereas a bullish resurgence above 3252 would revalidate the uptrend.

Cautious outlook for the yellow metal

With risk appetite improving and inflation pressures subdued, gold may struggle to regain bullish momentum in the immediate term. However, persistent geopolitical friction and shifting expectations around central bank policy remain key tailwinds. Any deterioration in trade talks or renewed inflation volatility could revive safe-haven flows, offering support above $3,160.

Click here to open account and start trading.

In March, Canada’s foreign portfolio investment in securities registered at -£4.23 billion, missing predictions

Canada’s foreign portfolio investment in Canadian securities registered at -$4.23 billion for March. This figure contrasts with the expected $5.2 billion mark.

The discrepancy between the actual and forecasted investment levels suggests a lower demand or possible divestment in Canadian securities during this period. The negative figure indicates an outflow rather than an influx of investment.

shift in investor sentiment

This shortfall, especially when compared to projections, points to a tangible shift in the sentiment of international investors toward Canadian assets. With an outflow of $4.23 billion rather than the anticipated inflow, it’s likely that foreign holders either pared back their exposure or halted reinvestments altogether during March. These decisions may have been informed by weaker macroeconomic indicators, shifting interest rate narratives, or broader recalibrations of risk appetite within global portfolios.

In practical terms, this sort of behaviour tends to reflect dampened confidence in Canada’s short-term financial performance or simply more attractive opportunities elsewhere. Given the magnitude of the miss—over $9 billion between the estimate and the actual—we should not underestimate its implications. Such capital withdrawal has the potential to exert pressure across Canadian fixed income and equity markets, particularly if further outflows materialise in the coming months.

For those of us watching short-dated contracts, it might be worth paying closer attention to bond yields and their volatility in the near term. If inflows continue to decelerate or dip into negative territory again, yields on government securities may adjust accordingly, contributing to knock-on effects across rates-sensitive instruments. Expectations around the Bank of Canada’s rate stance could also start to shift from external pressure, even if domestic inflation data remains in line.

Additionally, the mechanics behind this data matter. When foreign investors sell off assets—be it bonds, equities, or other instruments—it can strengthen domestic currency volatility, particularly if proceeds are converted before repatriation. And although CAD has remained relatively stable recently, currency hedging strategies could become increasingly non-trivial for anyone holding longer durations.

international economic releases

We are likely to see gradual adjustments in forward-looking risk models, given that diversified international exposure usually hinges on stable capital flows. Timing remains unpredictable, but the March reading sets a concrete precedent. It’s necessary, then, to reassess positions where portfolio allocation is tilted towards Canadian credit or equity names with high correlation to global sentiment shifts.

As net flow activity deviates from expected norms, implied volatility may tick upwards—not just reactively, but potentially built into pricing models even before fresh data drops. Smith’s approach to de-risking in prior low-liquidity windows provides a helpful framework, though we wouldn’t mirror it directly unless further confirmation arrives. Of course, premature adjustments carry their own dangers.

Corporate issuance might also slow, subtly at first. With decreased external appetite, risk premia on new placements could rise enough to alter timing or structure of planned debt offerings. That means traders should monitor primary market volumes for any pause or delay, especially if margin conditions tighten heading into Q3.

Ultimately, attention should turn to the sequence of international economic releases and how they interact with Canada’s own data—inflation, retail sales, and GDP revisions. Minutes from policy meetings abroad could offer clues into just how sticky risk-off positioning will remain. The March figure may only be the first in a pattern. Without overcommitting to a direction, recalibrating exposure in relation to foreign activity might offer a more balanced hold-go strategy. There’s little benefit in being caught offside when inflows return, or if outflows accelerate.

Create your live VT Markets account and start trading now.

Understanding the reasons behind rising interest rates is crucial, as they influence market responses and outcomes

The repricing of interest rate expectations is influenced by two primary factors: growth and inflation. Understanding the driver behind rising interest rates is crucial for predicting market outcomes.

When rates rise due to growth expectations, the stock market often benefits. This is because earnings outlooks improve, and higher rates are more acceptable as stronger performance is anticipated. A notable example is the period from 2016 to 2018, during which the market thrived despite rising rates, aided by tax cuts and stable inflation.

Inflation Driven Rate Increases

Conversely, when interest rates rise due to inflation expectations, the stock market typically suffers. This scenario leads to downward revisions of returns and the likelihood of monetary tightening. The year 2022 serves as a recent example, where rapid tightening was necessary to control inflation.

Context plays an essential role in market reactions to rising rates. Growth-driven rate increases are generally welcomed by the market, while inflation-driven increases are approached with caution. Understanding the underlying reasons for rate changes helps in assessing potential market impacts.

So far, the article lays out a clear distinction between two scenarios in which interest rates can rise, and how those scenarios tend to impact equity markets. It outlines that an upwards shift in rates can happen either because the economy is showing signs of strength—what economists call a pick-up in real growth—or because inflation is running ahead of expectations. When the former happens, equities can often continue to gain ground, as companies mostly benefit from improved demand prospects. The article cites the 2016–2018 period as an example when higher rates were not harmful to market performance. In contrast, the 2022 tightening cycle was more damaging because it stemmed from an effort to curb inflationary pressures rather than growth.

For those of us operating within soft commodities, cross-asset volatility or interest rate forwards, this matters a great deal. If markets like the S&P 500 or credit spreads are caught between stronger economic prints and sticky inflation data, then the directional predictability of policy-linked moves becomes far less straightforward. Enough uncertainty creeps in to cloud even the sharpest models.

Powell’s messaging has of late been fairly consistent—wait for the disinflation trend to anchor well below 3% before committing to accommodation. At the same time, signs that consumers are still spending, and that employment conditions remain tight, have effectively boxed the Fed into a patience-based strategy. It creates tension: inflation is slowing, but not quite enough; growth is holding, but with some uneven spots. So, forward guidance is less about firm outcomes, and more about probabilities shifting week by week.

Market Volatility And Positioning

From a volatility standpoint, we observe that near-term implied vol in rate products remains elevated relative to realised movement. That premium implies uncertainty over the direction and timing of central bank action. In particular, longer-dated rate swaptions have retained a stubborn skew that reflects protection against a stubborn inflation regime—not just lower inflation taking time, but the tail risk that it could stop falling.

Bond yields in the belly of the curve—two- to five-year maturities—have moved higher through a sequence of stronger-than-expected data releases, which has not gone unnoticed by positioning metrics. CFTC data and flow-based indicators suggest leveraged accounts have trimmed rate cut exposure at the front end. Moreover, option activity has tilted heavily towards caps and payers, pointing to asymmetric hedging against the Fed holding rates elevated into next year.

Equity index volatility remains relatively muted in comparison, but that shouldn’t be mistaken for calm. Correlations across asset classes have quietly risen, and there’s an observable re-coupling between rates and risky assets. Equities have continued to climb, but with less confidence embedded under the surface. Skew in index options has steepened noticeably, especially on the downside. That reflects a positioning hedge—not conviction, but preparation.

The near-term setup suggests that any upside surprises in economic strength will keep implied rate volatility bid. Traders are likely to keep layering into convexity where carry costs are suppressed. On the inflation side, even a modest upward revision in core metrics such as services CPI or trimmed PCE could reawaken fears that the disinflation process is stalling, triggering further repricing across curves.

Thus, attention turns to pre-positioning ahead of CPI and labour reports, where skew charts and gamma trades imply a desire to express views with lean directionality and low delta. Monetary policy futures have increasingly shown asymmetric reactions—hawks are fading upside surprises less than doves are buying dips on soft prints.

We find that while the terminal rate hasn’t moved substantially, the path to it has shifted in tone. The market no longer debates whether policy is restrictive, but rather how sticky inflation must be for that posture to persist. That gives derivatives desks clear guidance: relative value along the curve is more fruitful than outright duration bets.

Clever structuring remains the focal point; there’s more opportunity in dislocations between realised and implied measures than from chasing large directional moves. Particularly around time-decay sensitive environments, such as week-of-data-event windows, theta erosion is shallow enough to make buying convexity not just palatable, but at times attractive.

As we move deeper into the quarter, what becomes more pressing is whether real rates continue to climb, and if they do, whether it’s driven by improved growth expectations or lingering inflation worry. That distinction isn’t academic—it materially alters how rate sensitivity manifests across asset classes.

Thus, this is a moment that demands a firmer eye on breakevens, term premium shifts, and equity-sector rotation rather than headline prints alone. The narrative has turned; now it’s a question of persistence.

Create your live VT Markets account and start trading now.
In March, Canada’s investment in foreign securities fell to $15.63 billion from $27.15 billion

In March, Canadian portfolio investment in foreign securities decreased to $15.63 billion. This amount is down from the previous level of $27.15 billion.

Forward-looking statements can contain risks and uncertainties. Ensuring thorough research before making investment decisions is essential to mitigate these risks.

Accuracy Of Information

No guarantees are provided regarding the accuracy or timeliness of this information. The possibility of errors, mistakes, or omissions in the data exists.

Investing in open markets carries the risk of emotional distress and potential total loss of the principal amount. All associated risks, losses, and costs are the responsibility of the individual making the investment.

This information is not personalised investment advice. The accuracy, completeness, or suitability of the invested amount or securities cannot be assured by the author.

The decline in Canadian portfolio investment abroad from $27.15 billion in February to $15.63 billion in March points to a change in capital allocation. It may reflect a wider reassessment by domestic investors concerning valuations, global yields or currency expectations. Whether this is a one-off contraction or the start of a slower flow will depend on multiple coming events, particularly data releases in the US and Canada.

Influence On Market Conditions

Lower outbound investment can influence short-term flows in the FX and derivatives markets. Reduced demand for foreign assets by Canadian entities could affect the Canadian dollar, indirectly modifying carry trade considerations. Should the loonie gain relative support as a result, previously assumed volatilities or spreads in well-used FX pairs may widen or contract differently.

Traders leaning on historical price action without adjusting for this change in cash movement could be exposed. Biases formed during the period of high outbound investment will need to be re-evaluated. Flows into specific foreign equity sectors, particularly US tech or European energy—which previously benefited from Canadian allocations—might soften if trends persist. This cannot be discounted when positioning over multi-week or quarterly cycles.

Delisle’s comments earlier this month alluded to the increased sensitivity of capital movement to interest rate differentials. With that in mind, a momentary halt or slowdown in outward investment may represent more than just seasonal variance; it may reflect investor positioning ahead of central bank announcements. At the very least, it adds weight to monitoring Bank of Canada forward guidance more carefully.

Taylor stressed the impact of overseas monetary tightening on risk appetite, and the recent figures seem to fall in line with that. For those holding volatility exposures, this turning point could offer renewed premium advantage. However, implied vol surfaces may not yet reflect the real hesitancy in global exposure shown by Canadian investors, which creates opportunities as well as trapdoors.

From a systematic perspective, those modelling momentum or volatility should recalibrate their inputs over shorter windows. Carry assumptions based on portfolio flows may now carry more tracking error. Equally, the pace at which derivative pricing adjusts to shifts in fixed income sentiment—especially relating to foreign debt—could widen basis risk in previously tight spreads.

We should also consider that sudden shifts in investment appetite may impact liquidity provision on major trading desks. If flows remain depressed, depth could falter in short-duration instruments. This might alter hedging strategies, especially for those using swaps or synthetic securities.

Because data corrections and delayed revisions happen, anchoring positions to a single month’s release is a hazard. Rebalancing into lighter foreign exposure temporarily doesn’t mean a trend has firmly taken root. But risk needs to be priced as if that shift holds, until the data contradicts it.

We’re watching how counterparty margining responds. If brokers begin to recalibrate haircut models due to overseas exposure risks, that will filter back into short-term derivatives pricing more swiftly than anticipated. Timing the spread between these indicators and pricing actions will be key.

If historical patterns following drawdowns in outbound flows hold up, this might precede a flattening of risk-on sentiment. Yet, any resulting quiet in futures volumes could be misleading if interpreted as a broader sentiment collapse. We must remain reactive and marry portfolio positioning updates with intraday feedback loops, particularly in index options.

Create your live VT Markets account and start trading now.

South Korea anticipates a potential trade agreement following the deadline, focusing on auto and steel sectors

South Korea has indicated the potential for a trade deal post the 8 July deadline, according to trade chief Ahn Duk-geun. Key discussion areas with the US include the auto and steel sectors.

A formal negotiation framework is currently in place, with a ministerial-level meeting planned for mid-June. However, trade discussions might be postponed due to South Korea’s presidential election on 3 June.

Election Impact on Negotiations

Major trade talks are therefore expected to proceed following the election period.

That South Korea has left the door open to a possible agreement beyond the 8 July deadline tells us one thing clearly: final timelines remain flexible if strategic gains appear within reach. Ahn’s remarks suggest a willingness to adapt, especially if key sectors—such as automobiles and steel—are treated with the right level of attention by their counterparts across the Pacific. These industries carry outsized political and fiscal weight in domestic discussions.

With a formal setup for talks already arranged and a high-level ministerial meeting laid out for mid-June, the road to material decisions seems marked out. Yet we can’t ignore the looming election set for 3 June. It’s likely to introduce a brief pause or at least create added caution. New leadership, or even the rumour of it, often brings in revised policy posture. At the very least, it will introduce a temporary administrative recalibration. Timing, in other words, is drifting sideways.

Analysts we’d trust would say that momentum is unlikely to build until the political process concludes, and we would agree. Most of the deal-making energy—initiatives that move negotiations forward—should return once the electoral dust settles. There’s a reason capital waits for vote-counts before pressing ‘go.’

Interim Strategies and Key Players

For us, this paints a near-term set-up where directional shifts are limited. Thin participation can exaggerate moves, however. Contract rollovers or position closures could bring pressure points, especially around the mid-June meeting and the early July deadline.

Choi, who has previously handled steel clauses in similar trade formats, may reappear in post-election rounds. If he does, prior outcomes from last year’s reviews may be reintroduced. Not as new topics, but as previously parked issues returning with added urgency.

Lee, who has remained quiet during the latest cycle, is also someone to watch if talks resume past the deadline. Typically pragmatic, he values framing over speed—expect detailed procedural requests if he steps back into view. Market participants could find clarity in his involvement, especially if existing frictions are to be addressed in subsequent sessions.

In the meantime, hedging against inaction, rather than volatility, may be the keener approach. The likelihood isn’t waves of new information, but rather a slow return to the table. We should brace for flat volatility curves that may invert briefly if political statements are misinterpreted after the vote.

Naturally, most flows stay minimal during such gaps. So the edge could lie not in predicting outcomes, but in mapping when liquidity returns. Watch for statements from legislative aides and minor changes in industry language in the next fortnight—they may tell us more than the ministers themselves in this period.

Ultimately, we’re still in a zone where price reacts more to expectations than policy itself. That won’t change until calendars align, and officials can speak without mandatory neutrality.

Create your live VT Markets account and start trading now.

In April, the change in US building permits fell from 1.6% to -4.7%

In April, the change in United States building permits decreased from 1.6% to -4.7%. The data points towards reduced construction activity during this period.

The EUR/USD currency pair fell to new three-day lows around 1.1130, influenced by the US Dollar’s strength as inflation expectations rose. GBP/USD also decreased to 1.3250 due to a stronger US Dollar prompted by growing consumer inflation expectations.

Gold Price Movement

Gold prices dropped below $3,200, reversing earlier gains, as the US Dollar regained strength and geopolitical tensions eased. This led to gold facing its biggest weekly loss of the year.

Ethereum climbed above $2,500 after increasing by nearly 100% since early April. The recent ETH Pectra upgrade resulted in over 11,000 EIP-7702 authorizations, boosting its uptake.

Meanwhile, President Trump’s May 2025 visit to the Middle East resulted in major deals aimed at strengthening US trade ties and technology exports. These initiatives are seen as measures to address trade imbalances and reinforce US leadership.

What we saw in April was fairly telling across a spread of key economic indicators, most of which point to a tilt in sentiment. A sharp drop in building permits, from a 1.6% rise to a -4.7% contraction, clearly signals a pullback in construction activity inside the US. This isn’t a minor fluctuation—it suggests decision-makers are hesitant to commit to longer-horizon projects, possibly due to the rising cost of capital or concerns around future demand. For us, this signals a shift in where capital might prefer to be deployed short term.

With that backdrop, pair reactions in the FX market were understandable. EUR/USD falling to 1.1130 and GBP/USD sliding to 1.3250 reflect a broader move back into the Dollar. It wasn’t just strength for strength’s sake—the uplift came after an increase in consumer inflation expectations. When US inflation expectations edge higher, participants often recalibrate positioning, anticipating that the Federal Reserve may keep rates elevated for longer. This naturally draws flows into the Greenback, and that’s exactly what played out.

For us, expectations about what the Fed might do next become more anchored to domestic signals. Keeping a tighter lens on stateside inflation print and employment dynamics may offer a tactical edge here. Dollar strength affects multiple channels, so you can assume this will continue to affect asset re-pricing well into the short term.

Commodity Market Dynamics

Commodities moved as well. With gold falling sharply below the $3,200 level, it’s clear that risk-on appetite made its return, particularly as some of the hotter geopolitical tensions became less pressing. Strength in the Dollar contributed to the sell-off in gold, making it relatively more expensive in other currencies. That weekly loss? The worst we’ve seen this year. When you compare that movement with previous volatility cycles, the setup suggests metal markets might lean more reactive than directional for now.

While traditional assets offered a dose of volatility, the digital space showed very different behaviour. Ethereum’s climb over the $2,500 mark, doubling since early April, was not just the product of market momentum. The Pectra upgrade brought real activity—over 11,000 EIP-7702 authorisations indicate that developers and users are actively integrating the new protocol changes. That sort of traction doesn’t happen without confidence in the system’s utility. In this context, ETH isn’t just moving on speculation; it’s reflecting active adoption.

As policy actions off the trading floor go, the May 2025 Middle East visit resulted in several long-term commercial deals. Enhancements in trade and technology ties were central themes, and from our perspective, these are long-duration bets aimed at shifting the balance in US favour. The projects appear geared toward stabilising existing imbalances and extending domestic influence via economic rather than military means. They may take time to filter into markets tangibly, but the agreements signal that forward intentions are being laid down well in advance.

So what does all this mean for positioning? Traders should not expect a one-directional narrative. The tug between inflation-led Dollar strength and scattered easing in geopolitical tensions creates potential for dislocations. In turn, these may present well-timed entries or short-covering rallies, depending on how positioning gets clogged. Tech still shows momentum, particularly where functionality upgrades deliver. Rate-sensitive assets are recalibrating to inflation data almost instantly. This quickened pace calls for sharper adjustment, not a wait-and-see approach.

We think the best approach near term is to watch how real economic data matches policy narrative. And price in the gaps before broad consensus does. It may not stay quiet for long.

Create your live VT Markets account and start trading now.

In March, the Eurozone’s trade balance rose to €36.8 billion, driven by increased exports and modest imports

In March, the Eurozone’s trade balance reached €36.8 billion, an increase from the previous €24.0 billion. This data was released by Eurostat on 16 May 2025.

When adjusted for seasonality, the trade balance stood at €27.9 billion for the month. Exports saw an increase of 2.9%, whereas imports rose by 1.0% from the previous month.

External Sector Improvement

These figures point to a marked improvement in the external sector over the March period. A wider trade surplus typically reflects either rising competitiveness abroad or a moderation in domestic demand, and in this case, the larger move in exports relative to imports suggests the former is more likely. Compared with February, outbound flows rose at nearly three times the pace of incoming goods, which is an encouraging signal for those watching external demand trends.

We observe that the monthly 2.9% climb in exports comfortably outpaced the 1.0% increase in import activity. This sort of gap, while not always long-lasting, often aligns with either euro weakness making goods more attractive or improved global conditions lifting appetite for European products. Either way, such numbers speak to resilience in trade-driven sectors.

The seasonally adjusted trade balance – slightly lower than the unadjusted figure – removes distortions such as investment spike months and volatile commodity-related imports. Therefore, that €27.9 billion figure paints a clearer picture of underlying momentum and it tells us that demand from outside the bloc remains solid and uninterrupted by short-term jolts.

In context, this jump follows a pattern of gradual improvement over recent quarters. It’s not a one-off. With the European Central Bank closely tracking these trends, particularly when looking for hints on inflationary pressures and forward guidance, this stronger trade data will have some bearing on their next steps.

Influence Of External Demand

From our perspective, attention turns to how external demand – such as that from key partners in Asia and North America – might shift as interest rate paths diverge across regions. Any deviation in global manufacturing orders or commodity prices can start to erode this surplus or shift its drivers, and that has knock-on effects.

We will therefore be watching incoming PMI data and any forward-looking shipment trends closely. Shorter-term exposures should be adjusted with this in mind – particularly in instruments sensitive to net export conditions. Recent data also suggests a tilt towards industrial goods and machinery in the export mix, which tend to carry higher margins and a longer production cycle.

For us, opportunities will lie where volatility aligns with forward-looking sentiment. By positioning around these strengths but staying alert to transportation bottlenecks or sudden policy surprises elsewhere, one can best capture value from short-term spreads or mid-curve adjustments. Traders should view these numbers as a reflection of divergence risks and possible macro asymmetries now affecting European financial instruments more visibly than before.

Stay sharp on expanding trade gaps that don’t align with currency movements – this often precedes price action in correlated asset classes.

Create your live VT Markets account and start trading now.

Currently, USD/CAD trades around 1.3960, demonstrating limited movement within a tight weekly range

USD/CAD is trading around 1.3960, showing no clear direction and remains within a narrow weekly range. The Canadian Dollar recently lost momentum after peaking at 1.3750, with the pair staying above the 21-day EMA, while the 50-day EMA around 1.4024 limits upward movement.

In March, Canadian Manufacturing Sales decreased by 1.4% MoM, less than the originally estimated 1.9% drop. The reduction was mainly due to weaker activities in primary metals and petroleum sectors, although the smaller contraction did not provide much support to the Canadian Dollar.

Weakening Market Sentiment

Market sentiment is weakening as potential interest-rate cuts by the Bank of Canada are being considered after disappointing job data in April, which revealed unemployment rising to 6.9%. There is now over a 50% chance of a rate cut in June, further affecting the Loonie.

CAD’s mid-term direction is closely linked to US-Canada trade developments. The Bank of Canada’s recent report singled out trade tensions as the largest threat to the economy, warning that increased global protectionism could increase risks.

Despite mixed data, the US Dollar Index remains above 100.00. Traders await key US economic data, including the University of Michigan’s Consumer Sentiment survey, to gauge consumer mood. Next Tuesday, Canada’s GDP report will be watched for domestic growth insights.

Currently, the USD/CAD holds close to 1.3960 without presenting any clear trend, tracing a rather tight range within the week. Earlier strength in the Canadian Dollar faded after reaching 1.3750. Since then, price action has remained above the 21-day Exponential Moving Average (EMA), which points to some underlying support. However, upwards movements are struggling to break through the resistance around the 50-day EMA near 1.4024, placing a lid on bullish momentum for now.

From a macroeconomic angle, March’s Canadian Manufacturing Sales came in with a 1.4% monthly decline. Although this was somewhat better than the anticipated 1.9% drop, the data didn’t carry enough weight to shift appetite back toward the Loonie. Most of the drag stemmed from areas such as primary metals and petroleum, sectors often sensitive to external demand and commodity pricing.

There’s been a marked shift in sentiment since April’s employment figures showed the jobless rate rising to 6.9%. That release did more than just dent consumer and institutional confidence; it pushed market participants to raise the odds of a June rate cut by the Bank of Canada to over 50%. As such, any potential dovish move now feels more like a matter of timing than possibility. That growing conviction leaves the Canadian Dollar on the defensive, especially when paired against a US Dollar that is holding firm above the 100.00 handle on the Dollar Index.

Trade Relations and Policy Shifts

From a policy perspective, the most recent communication from the central bank included an explicit caution on trade relations. The report underlined the risks linked to widening protectionist policies, particularly how these could restrict export opportunities and complicate supply chain access. If tensions intensify, we may see added pressure on economic activity north of the border, and with it, reduced support for the currency.

Meanwhile, over in the US, the Dollar remains anchored by strong domestic indicators and moderating inflation pressures. Focus now shifts to upcoming consumer sentiment figures out of Michigan. This particular dataset often reflects a forward-looking view of spending behaviour, and given the consumer-heavy nature of the American economy, it could sway rate expectations in a persistent way if it moves sharply in either direction.

Attention will also turn next Tuesday to Canada’s GDP report. That print will likely act as a short-term directional catalyst. If momentum on the growth side turns sluggish, then it would only reinforce the current bias toward policy easing. In contrast, any surprise resilience in output may recalibrate expectations slightly.

For traders working with derivative structures tied to USD/CAD, this phase of technical indecision layered with divergent policy leanings calls for tighter risk parameters. The current stalling around EMAs forms a compressed setup with decent potential energy. Our focus in the coming days will remain on how price reacts at those two anchored averages and whether macro prints tilt positioning in a more assertive direction.

Create your live VT Markets account and start trading now.

With risk appetite increasing, tech stocks are outperforming luxury brands like LVMH amidst market recovery

The focus is on whether US stocks can catch up with European indices, as European stocks have had a strong start this year. Despite this, LVMH is lagging due to weak sales in its drinks division in the US and China.

LVMH, previously Europe’s highest valued company, has slipped behind Hermes, showing weak performance since March. Luxury is a crucial segment, as seen with Hermes’ continued success, but the sector in Europe shows signs of fragmentation.

lvmh stock performance

LVMH’s stock has dropped 20% in 2025, with limited prospects for recovery as earnings estimates are not optimistic. In contrast, Nvidia shows positive growth expectations, although estimates have been slightly lowered.

The luxury 10 index has gained 5% this year, with a 120% return over five years. However, issues at LVMH could impact the ability of European stocks to outperform US stocks, especially as US tech recovers.

Overall, the outlook for Europe’s luxury sector seems uncertain due to LVMH’s struggles, affecting European market support. Meanwhile, growth in US tech challenges European stock market performance in the ongoing quarter.

economic balance between regions

What we’re witnessing is a moment where the balance between regions is shifting. European equities started the year ahead, outpacing the US, yet now their continued lead hinges on select pillars that are showing cracks. One in particular—LVMH—has been losing momentum, primarily due to underwhelming results in its drinks segment across both the American and Chinese markets. It’s not just a company slipping; it’s a once-reliable heavyweight suddenly lacking forward thrust.

Since March, Arnault’s firm, long seen as a bellwether for European strength, has decelerated markedly. The crown of Europe’s top-valued firm no longer rests with it. Hermes has taken that place, and that shift speaks volumes about internal divergence within luxury. Not all players are under pressure, but the fragmentation is clear. Some names power ahead, others quietly slip.

As traders, we must pay close attention to where the pressure points are forming. The 20% fall in valuation for LVMH this year is no minor adjustment—it reflects a material change in sentiment. Forward earnings expectations remain muted as well, suggesting that relief will not arrive soon. That matters because luxury had been a source of steady outperformance for European equities. With one of its largest anchors weakened, that support could falter.

Meanwhile, across the Atlantic, tech resumes its push. Traders should note the resilience in names like Nvidia. Yes, forward estimates have been nudged lower, but the broader mood around US growth equities remains intact. This stands in stark contrast to the cautious tone encircling parts of Europe’s luxury segment.

The Luxury 10 index still shows a moderate yearly gain of 5%, and five-year returns remain robust. But those numbers mask questions inside the sector. What was once a clean, transparent play on affluence and consumer pricing power now calls for greater selectivity. One cannot treat European luxury as a uniform trade anymore. Knowing which names are driving performance—and which are not—is essential in structuring positions.

In the weeks ahead, this divergence matters. It’s not just about east versus west, or luxury versus growth. We’re seeing a test of sectors that traditionally offered high conviction. Some are holding up, while others unravel quietly under pressure. This is when strategy comes into tighter focus. How we rotate exposure, how we manage risk tied to broader estimates, and how earnings surprises are interpreted all need review.

Maintaining exposure to growth-heavy names with stable-to-rising sentiment could continue paying off. If the pressure on certain European brands persists, relative performance will continue to lean in favour of US counterparts. What once felt balanced isn’t right now. The tables do shift, and we must move with them.

Create your live VT Markets account and start trading now.

Around 1.12, EUR/USD remains stable, with limited support observed during the North American session

Currency And Commodity Update

EUR/USD is maintaining a quiet position around 1.12, showing modest support as Friday’s North American session progresses. The recent decrease in Federal Reserve expectations is impacting the outlook for central bank policies, with the European Central Bank remaining generally dovish and considering further rate cuts.

The recent U.S. data indicated a decline in the University of Michigan Consumer Sentiment Index for May, while the one-year inflation expectation rose to 7.3%. This development has helped the U.S. Dollar hold steady, keeping EUR/USD near 1.1200 during the American session on Friday.

In other currency news, GBP/USD has dropped below 1.3300 due to a modest recovery by the U.S. Dollar, influenced by increasing one-year consumer inflation expectations in the U.S. Meanwhile, gold has slipped below $3,200 following a strong performance on Thursday, influenced by a strengthened U.S. Dollar.

Ethereum’s price stands above $2,500, having surged nearly 100% since April. The recent upgrade has resulted in over 11,000 EIP-7702 authorisations, signalling a positive adoption by wallets and dApps.

Trading foreign exchange on margin involves significant risk, and the high degree of leverage can work for or against traders. Consider your investment objectives and risk tolerance before engaging in forex trading.

Market Observations And Insights

We’ve seen EUR/USD remain relatively still around the 1.12 mark, holding closely to where it’s been for several sessions now. The currency pair isn’t pushing strongly in either direction, and there’s little volatility. That tells us traders are holding back, possibly waiting for clearer signals from economic data or central bank guidance.

The recent softening in expectations for the U.S. Federal Reserve has tilted sentiment. It’s not a matter of traders believing cuts are around the corner, but rather that aggressive hikes are off the table for now. On the other side, the European Central Bank has leaned towards being more accommodative, hinting at the possibility of lowering rates further. When one bank is backing off and the other may ease, we often see the currency spread narrow, which explains why there’s been limited movement despite broader shifts elsewhere.

The preliminary University of Michigan Consumer Sentiment numbers showed softness. People feel less confident about the economy’s near-term future—that’s typically not great for the dollar. And yet, inflation expectations ticked up, with one-year expectations jumping to 7.3%. That kind of cautious consumer outlook matched with sticky inflation tells policymakers that while people may be worried, they still expect prices to climb. It adds complexity to rate decisions, and price action almost immediately reflected that. The dollar didn’t fall—it held firm. That in turn stalled any EUR/USD gains for the time being.

In the sterling space, GBP/USD dipped below the 1.33 level. It wasn’t a sudden drop but enough to notice. The dollar’s modest bounce seems to have pushed it lower. Unlike the euro, which is static at the moment, the pound’s movement tends to be more sensitive to external cues, particularly from the U.S.

Gold—often tied inversely to dollar strength—slipped under $3,200 despite a strong run the day prior. Traders had likely taken some profit after Thursday’s surge, and with risk appetite bouncing back due to Friday’s data, gold lost a bit of its shine. It wasn’t a big drop, more of a soft recalibration to short-term reactions in bond yields and a slightly stronger dollar.

Ethereum is hanging above $2,500, after rallying almost 100% since April. A recent software upgrade drove this performance. The uptake has been strong, with over 11,000 EIP-7702 transactions going through—more wallet activity, higher dApp engagement. That’s a technical thumbs-up from the community, indicating confidence in network improvements rather than just market speculation.

For those of us trading derivatives, all of this matters. The narrow range in EUR/USD means shorter-term setups need tighter risk management—there’s not much space for momentum trades unless macro developments jolt the pair. Watch for moves in bond yields, particularly U.S. Treasuries, to get clues about next week’s positioning. In contrast, GBP/USD may offer more intraday trade ideas given its current responsiveness.

Be aware that broader market sentiment can shift abruptly if inflation expectations continue climbing. If they do, markets may begin re-pricing central bank expectations quickly. That in turn could spike volatility across all FX pairs, particularly those with tighter spreads like EUR/USD.

Traders should probably stick to shorter-dated contracts for now in the euro pairs, at least until clearer policy direction arrives from either central bank. In the crypto space, gains have been strong but fast—so use caution when looking to chase any further highs in Ethereum without confirmation from volume and open interest.

We’ve learned from past moves that when consumer sentiment and inflation diverge, it creates unease—because no one’s quite sure whether growth or price control will take precedence. This tension holds the dollar firm and keeps pressure on central banks to explain their path forward in far more detail.

It’s a market now driven less by conviction and more by reaction.

Create your live VT Markets account and start trading now.

Back To Top
server

Hello there 👋

How can I help you?

Chat with our team instantly

Live Chat

Start a live conversation through...

  • Telegram
    hold On hold
  • Coming Soon...

Hello there 👋

How can I help you?

telegram

Scan the QR code with your smartphone to start a chat with us, or click here.

Don’t have the Telegram App or Desktop installed? Use Web Telegram instead.

QR code