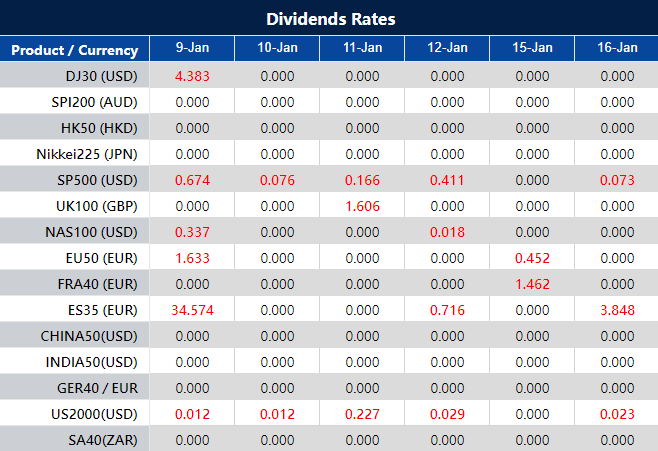
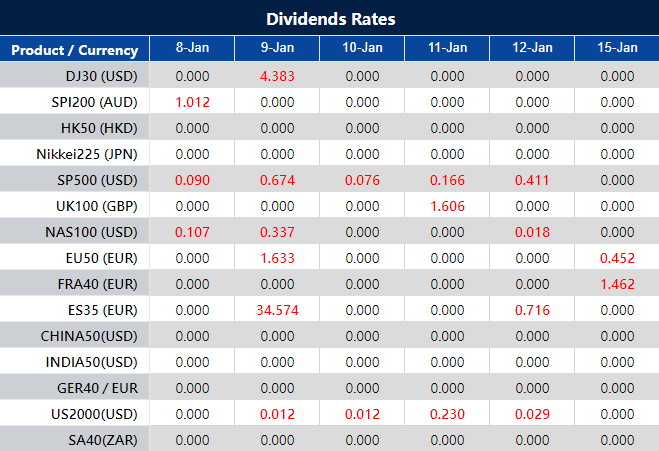
Please note that the dividends of the following products will be adjusted accordingly. Index dividends will be executed separately through a balance statement directly to your trading account, and the comment will be in the following format “Div & Product Name & Net Volume ”.
Please refer to the table below for more details:
The above data is for reference only, please refer to the MT4/MT5 software for specific data.
If you’d like more information, please don’t hesitate to contact info@vtmarkets.com.
The Role of Gold Price Trends in Investment Strategies
Discover the significance of gold price forecasts, including the next week’s and tomorrow’s predictions. Learn how these forecasts impact your investments and make informed decisions. Explore examples, expert insights, and a practical step to start trading.
In the world of finance and investments, staying ahead of the game is essential. This is where understanding the gold price forecast becomes crucial for investors. In this blog post, we’ll delve into why gold price forecasts, particularly for the next week and tomorrow, matter, and how they can influence your investment decisions.
Gold’s market presence is global, offering high liquidity and diverse trading opportunities, from physical gold to ETFs and digital options. For beginners and seasoned investors alike, platforms like VT Markets provide accessible resources, making it easy to start. Whether aiming for portfolio diversification, hedging, or capitalizing on market trends, gold trading offers a unique blend of security and growth potential.
Why Gold Price Forecasting Matters
To grasp the importance of gold price forecasts, let’s break it down into two critical timeframes: the next week and tomorrow.
Gold Price Forecast Next Week
Imagine you’re considering investing in gold, either for the long term or the short term. Knowing the gold price forecast for the next week can be a game-changer.
If the forecast predicts a bullish trend, it might be an opportune moment to buy and profit from the expected price rise.
Conversely, if the forecast is bearish, you might choose to hold off or even consider selling if you already hold gold assets.
For instance, let’s say the next week’s gold price forecast indicates a rise due to geopolitical tensions. Investors can take advantage of this by buying gold today and selling it when the price peaks next week, thereby maximizing their returns.
Gold Price Forecast Tomorrow
Now, let’s zoom in on the importance of knowing the gold price forecast for tomorrow. This short-term forecast is particularly valuable for day traders and those looking to make quick profits.
If the forecast suggests a significant price drop for tomorrow, a day trader might opt to sell their gold holdings today and buy them back at a lower price, effectively making a profit in a single day.
On the other hand, if the forecast predicts a price surge tomorrow, traders may decide to buy now and sell tomorrow at a higher price. These microtransactions can add up, providing consistent gains for skilled traders.
Gold Price Forecasting in Risk Management
Beyond profit potential, gold price forecasts also play a vital role in risk management. Suppose you have a diversified investment portfolio that includes gold. In this case, knowing the expected price movement can help you balance your portfolio effectively.
For example, if the gold price forecast for the next week is uncertain, you might decide to allocate more funds to other assets or hedging strategies to mitigate potential losses.
References and Reliable Sources
It’s essential to rely on accurate and trustworthy sources for gold price forecasts. Several financial news websites, such as Bloomberg, CNBC, and Reuters, provide up-to-date and credible information on precious metal prices.
Additionally, you can explore specialized financial platforms that offer in-depth analysis and forecasts.
Start Your Gold Trading Journey with VT Markets
Now that you understand why gold price forecasts matter, it’s time to take action. If you’re new to trading or want to hone your skills, consider opening a demo account with a reputable trading platform.
VT Markets is the Forex broker to consider, our demo account allows you to practice trading without risking any real money. It’s an excellent way to familiarize yourself with the dynamics of the gold market and test your strategies.
Understanding gold price forecasts is crucial in navigating the dynamic world of investments. With VT Markets, you not only gain access to comprehensive market insights but also a user-friendly platform perfect for both new and seasoned traders. Our demo account offers a risk-free environment to apply your knowledge and refine your strategies.
Explore gold trading with VT Markets, where advanced tools, expert guidance, and a supportive trading community await to enhance your investment journey. Embark on your path to success in gold trading – start with VT Markets today.
The stock market rallied strongly, particularly in the tech sector, with the S&P 500 rising by 1.41% and the Nasdaq Composite surging 2.2%, rebounding from a challenging prior week. Notable tech giants like Nvidia, Amazon, Alphabet, and Apple experienced gains, fueling investor confidence. However, Boeing’s 8% stumble due to 737 Max 9 inspections impacted the Dow Jones Industrial Average. As traders anticipate crucial data releases, including CPI and PPI, this week, the focus shifts to the Fed’s inflation control measures and their influence on market sentiment. The currency market saw varied movements, with the USD index declining slightly, affecting currency pairs differently, as the EUR/USD and GBP/USD surged, while USD/JPY and USD/CAD faced challenges. Precious metals like Gold dipped amid a reassessment of Fed policies, contrasting with Silver’s rebound.
Stock Market Updates
The stock market witnessed a significant rebound on Monday as major indices surged, led by a robust performance in the technology sector. The S&P 500 rallied by 1.41% to close at 4,763.54, and the Nasdaq Composite surged by 2.2%, reaching 14,843.77, marking its most impressive day since mid-November. Investors displayed renewed confidence in tech companies after a challenging prior week that saw a 4% decline in the sector, primarily driven by falling yields. Notable tech giants like Nvidia, Amazon, Alphabet, and Apple experienced notable gains, with Nvidia hitting an all-time high, Amazon climbing nearly 2.7%, Alphabet advancing 2.3%, and Apple rising by 2.4% post an Evercore ISI recommendation to buy the recent dip. The VanEck Semiconductor ETF (SMH) also surged by 3.5%, its most robust performance since November, further indicating a broader tech resurgence. However, Boeing’s shares tumbled by 8% due to the temporary grounding of Boeing 737 Max 9 planes for inspections after an Alaska Airlines fuselage incident, impacting the Dow Jones Industrial Average, which managed a 0.58% increase at the close.
Last week marked the market’s first downturn in ten weeks, primarily influenced by underperforming mega-cap tech stocks like Apple and rising Treasury yields, resulting in a 0.59% slide in the Dow, a 1.52% drop in the S&P 500, and the Nasdaq Composite witnessing its worst weekly performance since September with a 3.25% decline. As the new week progresses, traders are eagerly anticipating upcoming data releases, particularly the December consumer price index and the producer price index scheduled for Thursday and Friday, respectively. These crucial figures are expected to shed light on the Federal Reserve’s potential moves regarding interest rates, offering insights into the efficacy of their measures in reining in inflation towards the 2% target. This information could significantly influence market sentiment and trading strategies in the days ahead.
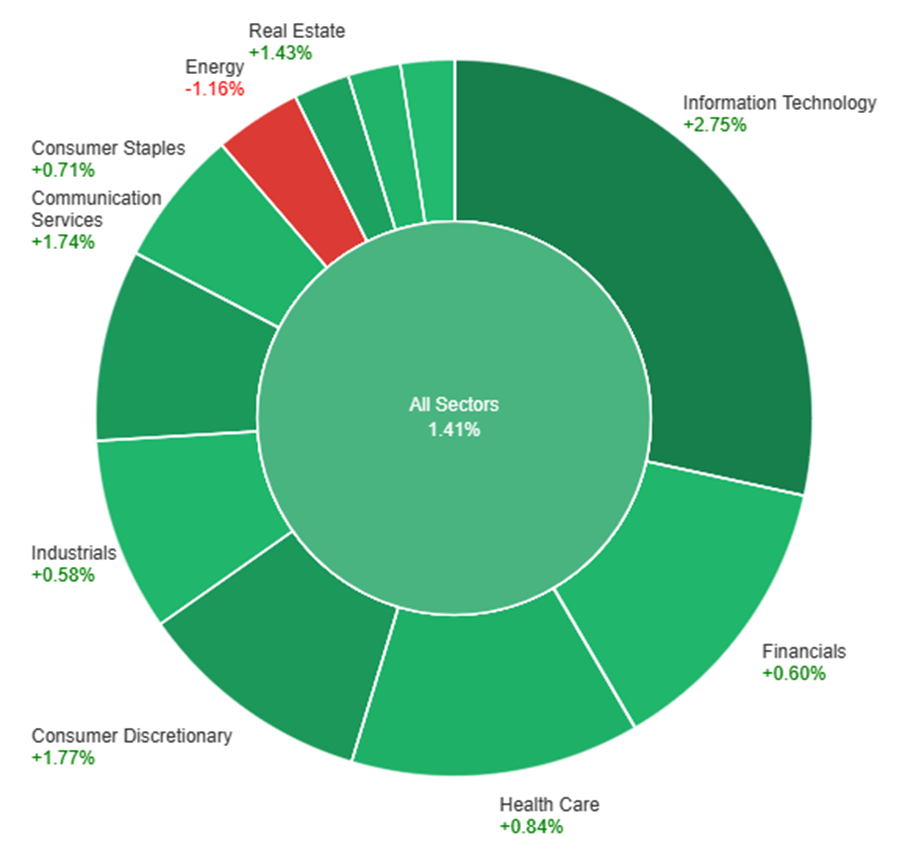
On Monday, the market saw an overall positive trend across various sectors, with a 1.41% increase across all sectors. Information Technology experienced the most significant surge at 2.75%, followed by Consumer Discretionary and Communication Services with gains of 1.77% and 1.74%, respectively. Real Estate and Health Care also showed notable growth, rising by 1.43% and 0.84%, respectively. However, Energy exhibited a decline of 1.16%, while Utilities, Consumer Staples, Financials, Industrials, and Materials sectors saw more modest increases ranging from 0.41% to 0.72%.
Currency Market Updates
The currency market exhibited varied movements amidst a shifting landscape of global economic sentiments. The US Dollar Index (DXY) saw a modest decline, hovering just above the 102.00 threshold as investors favored riskier assets and US yields underwent a corrective downturn. This decline in the dollar bolstered the performance of several currency pairs, notably the EUR/USD, which made significant gains reaching around 1.0980. Factors contributing to this uptick included a marginal increase in Investor Confidence tracked by the Sentix Index and better-than-expected Retail Sales figures in the eurozone. Similarly, GBP/USD continued its bullish trajectory for the fourth consecutive session, surging past the 1.2700 mark, largely supported by positive risk sentiment.
Conversely, the USD/JPY pair experienced a daily pullback to the 143.60 region due to declining US yields and a temporary weakening of the greenback, yet it managed to recover and surpass the 144.00 hurdle by the end of the North American session. AUD/USD showcased resilience by regaining the 0.6700 level, despite the broader bearish performance in the commodity market. However, USD/CAD faced challenges to maintain momentum beyond 1.3400, eventually retreating to the mid-1.3300s amidst a consolidative market environment. Amidst these currency fluctuations, precious metals like Gold saw a retreat to three-week lows, approximately $2015 per troy ounce, influenced by traders reassessing the potential for a prolonged restrictive stance by the Fed, especially in light of December’s Non-Farm Payrolls (NFP) data. In a similar vein, Silver rebounded from two consecutive sessions of losses, yet remained below the $23.00 mark.
Picks of the Day Analysis
EUR/USD (4 Hours)
EUR/USD Gains Ground Amidst USD Index Decline and Fed Rate Cut Speculation
EUR/USD saw a promising rise early in the week, reaching around 1.0975/80 against a weakening USD Index (DXY), sparked by uncertainties despite strong December Payrolls. Investor demand for bonds drove yields down on both sides of the Atlantic, slightly dimming the optimistic start to the trading year. The market’s focus remains on the Federal Reserve’s potential rate cuts versus the more restrained stance of the ECB, with consensus leaning towards a later rate cut by the ECB. Factors contributing to the euro’s strength included an uptick in Investor Confidence and stable Consumer Confidence, while Retail Sales in the bloc showed a slight contraction.
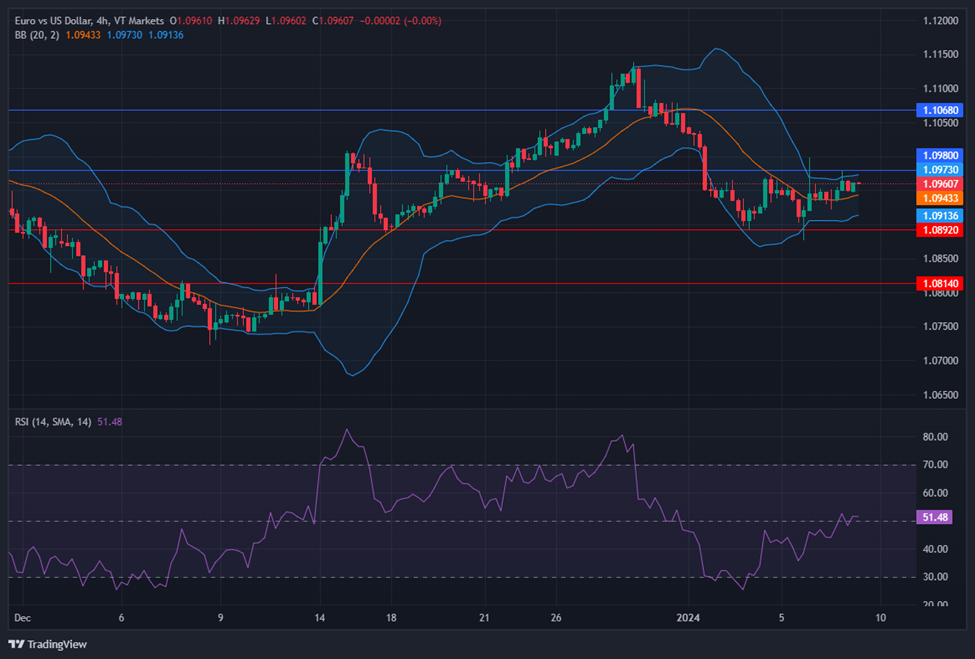
On Monday, the EUR/USD moved slightly higher and reached the upper band of the Bollinger Bands. Currently, the price moving just below the upper band, suggesting a potential downward movement. Notably, the Relative Strength Index (RSI) maintains its position at 51, signaling a neutral outlook for this currency pair.
Resistance: 1.0980, 1.1068
Support: 1.0892, 1.0814
XAU/USD (4 Hours)
XAU/USD Finds Support Amid Dollar Weakness and Fed Speculation
During American trading, XAU/USD managed to recover from early losses, hovering around $2,030 per ounce after hitting a mid-December low of $2,016.61. The weakening US Dollar spurred this turnaround, fueled by market optimism driven by expectations of a potential Federal Reserve rate cut in March. Additionally, Bank of America analysts’ predictions of a tapering in Treasury holdings by the Fed further influenced the market sentiment. As government bond yields dipped and stock indexes fluctuated, attention turned to the upcoming US inflation update, with the December Consumer Price Index anticipated to show a 3.2% YoY increase, potentially impacting the future trajectory of gold prices.
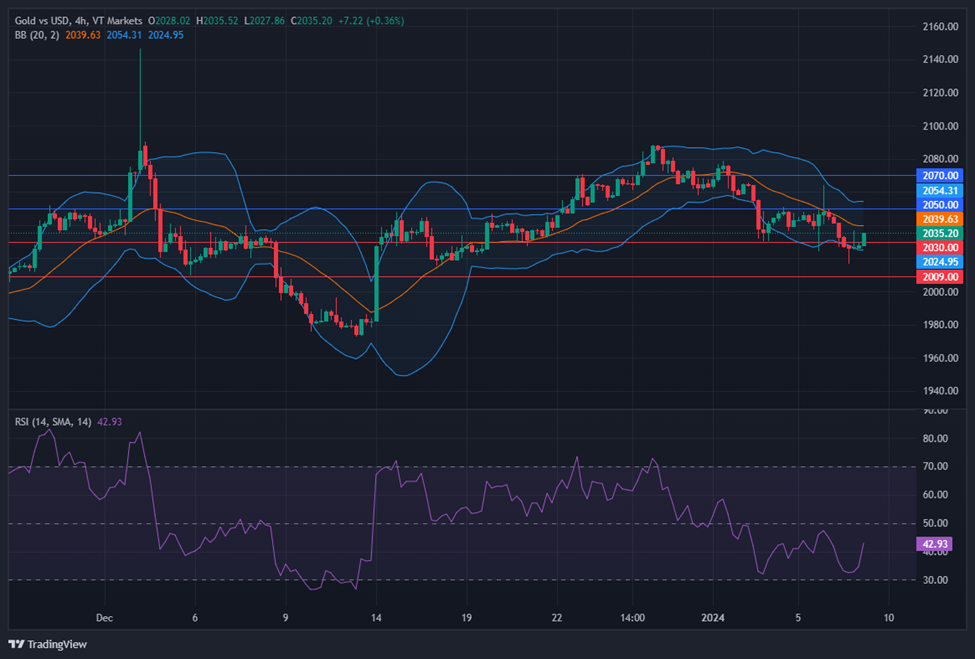
On Monday, XAU/USD moved lower and reached the lower band of the Bollinger Bands. Currently, the price moving higher and trying to reach the middle band. The Relative Strength Index (RSI) stands at 42, signaling a neutral but bearish outlook for this pair.
The Winning Strategy for Effective Position Sizing
Renowned investor Warren Buffett, ranked as the fourth wealthiest person globally, boasts a net worth of approximately $120 billion.
His strategic prowess lies in his distinctive position sizing approach, emphasising concentration within a margin of safety.
Unlike conventional diversification, Buffett’s strategy involves substantial investments in a select few stocks with robust fundamentals—a testament to his confidence in their quality.
While this approach thrives in stable markets, the dynamics shift when engaging in faster-moving arenas like day trading or currency trading. For investors navigating these volatile markets, the question becomes: What position sizing strategy best aligns with the rapid pace and unpredictability of dynamic trading?
In this article, we’ll unravel the intricacies of position sizing tailored for such scenarios, offering practical insights to empower traders in the dynamic world of Forex.
What is Position Sizing?
Think of position sizing as deciding how much of your money to put into a single trade. It’s like choosing the right portion size for your meal – not too much that it overwhelms you, but enough to satisfy your appetite. In trading, it’s about finding the sweet spot that balances making gains and avoiding big losses, all based on your comfort level with risk.
Now, let’s clear up a common mix-up between position sizing and leverage. Position sizing is about determining how much of a particular asset you’re buying or selling, usually as a percentage of your total funds.
On the other hand, leverage involves borrowing money to increase the size of your trade. They’re related but different – it’s like deciding how much dessert (position sizing) you want, versus sharing it with a friend (leverage).
How position sizing shapes your strategy?
1. Risk Control: Position sizing helps you control how much you’re willing to risk on each trade. It’s like setting a limit on your spending to avoid blowing your budget.
2. Portfolio Management: Just like you diversify your meals for a balanced diet, position sizing lets you spread your money across different trades, reducing the impact of a bad outcome on your overall portfolio.
3. Psychological Impact: Imagine if your plate is too full – overwhelming, right? Well-sized positions relieve stress, helping you stay cool-headed and stick to your plan, avoiding impulsive decisions.
In a nutshell, understanding position sizing is like being a smart eater in the trading world. It’s about choosing your portions wisely, avoiding unnecessary risks, and making sure your overall trading strategy stays healthy and satisfying.
Calculating Position Size
Understanding how to calculate the right position size involves a straightforward formula that considers two crucial factors:
Risk per Trade: This is like deciding how much you’re willing to spend on a single item during your shopping spree. It sets a limit on how much you’re willing to lose in a single trade.
Stop-Loss Placement: Think of this as a safety net. Just like placing fragile items securely in your shopping cart, setting a stop-loss helps protect your investment by defining the point at which you’ll exit a trade to limit losses.
Let’s delve into a real-world scenario to bring the position sizing formula to life. Suppose you have $1,000 as your trading capital, and you’ve decided to risk 2% of that on a single trade.
1. Risk per Trade Calculation: 2% of $1,000 is $20. This means you’re willing to risk $20 on this particular trade.
2. Stop-Loss Placement: With your $20 risk in mind, you set a stop-loss order at a level that, if reached, would result in a $20 loss.
3. Optimal Position Size Calculation: Now, considering the risk and your stop-loss, you can calculate the optimal position size. Let’s say your chosen currency pair has a pip value of $0.10. With a $20 risk and a $0.10 pip value, your optimal position size would be $20 / $0.10 = 200 pips.
This practical example demonstrates how the formula translates into actionable steps. By aligning your risk tolerance (2% of your capital) with a well-placed stop-loss, you can precisely determine the position size (200 pips) that ensures your trade aligns with your overall strategy.
Much like adjusting your shopping budget based on your available funds, adapting your position size to your account size is key. As your account balance fluctuates, so should your position size. This dynamic approach ensures that you’re not overcommitting when funds are limited or missing out on opportunities when your account size grows.
Risk Tolerance and Position Sizing
Forex trading requires a clear understanding of your individual comfort level with risk. Similar to gauging the thrill you seek during an adventurous activity, assessing your personal risk tolerance is about evaluating the financial excitement you can comfortably navigate without losing sleep at night.
It involves a thoughtful examination of your willingness to embrace risk, ensuring that your trading endeavours align with your financial and emotional well-being.
Once you’ve gauged your risk tolerance, the next step is to align your position size with it. Well-calibrated position sizes help you maintain composure, make rational decisions, and avoid emotional reactions to market fluctuations.
Utilising the 1-2% Rule
Exploring the dynamics of Forex trading requires implementing robust risk management strategies. Among these strategies, the 1-2% rule stands out as a widely acknowledged approach designed to safeguard your capital amidst market uncertainties. Understanding the 1-2% rule is fundamental for traders seeking stability in their financial endeavours.
Once introduced to the 1-2% rule, the logical next step is applying it to position sizing. Imagine it as incorporating safety protocols into your adventure gear – ensuring your equipment is in sync with the demands of your journey.
In Forex trading, aligning your position size with the 1-2% rule becomes a fundamental practice, allowing you to control risk while positioning yourself for potential growth.
Let’s put theory into practice with real-world examples to illustrate the impact of the 1-2% rule. Consider a scenario where your trading capital is $5,000. Following the rule, you’d limit your risk to 1-2%, translating to a risk of $50 to $100 per trade. These examples provide tangible insights into how the 1-2% rule can be applied, demonstrating its practicality in preserving capital and fostering a disciplined trading approach.
Practical Tips for Effective Position Sizing
Regularly Reassess Your Risk Tolerance: Keep your trading strategy in sync with your risk tolerance by regularly reassessing it. Think of it as checking your financial health before diving into the market – a crucial step to align your positions with your comfort level.
Stay Informed About Market Conditions: Position sizing isn’t static; it adapts to market shifts. Stay informed about market dynamics, just like checking the weather before planning an event. This awareness allows you to adjust your positions, ensuring they match the evolving market landscape.
Harness Risk Management Tools: Trading platforms offer tools for a reason. Use them as your safety net in the unpredictable trading world. These tools provide insights, help control risk, and maintain discipline. Integrating them into your strategy enhances your risk management capabilities, ensuring a resilient and controlled trading experience.
In conclusion, mastering position sizing is essential for success in Forex trading. Understanding its principles, aligning with risk tolerance, and implementing practical strategies empowers investors to confidently navigate the dynamic Forex market. Consider it your indispensable guide to manoeuvring the complexities and achieving success in your trading journey.
Please note that the dividends of the following products will be adjusted accordingly. Index dividends will be executed separately through a balance statement directly to your trading account, and the comment will be in the following format “Div & Product Name & Net Volume ”.
Please refer to the table below for more details:
The above data is for reference only, please refer to the MT4/MT5 software for specific data.
If you’d like more information, please don’t hesitate to contact info@vtmarkets.com.
Following a turbulent start to 2024, the upcoming week is poised for potential high volatility. Key drivers include the release of inflation data, taking in CPI figures from Australia, the US, and alongside PPI data. The UK GDP release also holds considerable significance, contributing to potential market impacts. Traders are advised to focus on monitoring this week’s CPI data, acknowledging its role as a primary market influencer for a successful trading week.
Australia Consumer Price Index (10 January 2024)
Registering a 4.9% increase in October 2023 (slightly down from September’s 5.6%), the Australian CPI is expected to further decrease to 4.4% in November 2023. Watch for the release on January 10, 2024.
US Consumer Price Index (11 January 2024)
In November 2023, US consumer prices edged up by 0.1% compared to the previous month, with an anticipated uptick of 0.2% expected in the December 2023 data. Keep an eye out for the release on January 11, 2024.
UK Gross Domestic Product (12 January 2024)
After contracting by 0.3% in October 2023, the UK GDP is anticipated to show growth of 0.2% in November 2023. Data is scheduled for release on January 12, 2024, following two months of consecutive growth.
US Producer Price Index (12 January 2024)
US producer prices remained unchanged in November 2023 after a 0.4% decline in the prior period. Anticipations for the December 2023 data, set to release on 12 January 2024, suggest a 0.1% increase.
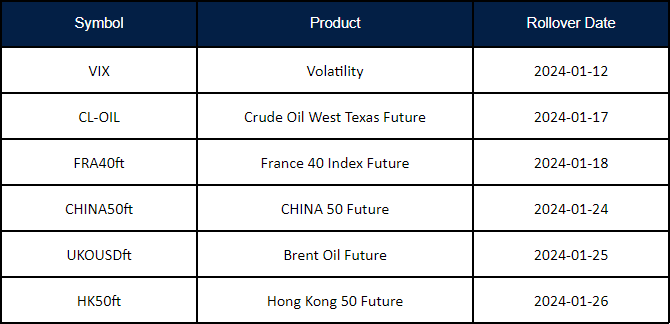
New contracts will automatically be rolled over as follows:
Please note:
• The rollover will be automatic, and any existing open positions will remain open.
• Positions that are open on the expiration date will be adjusted via a rollover charge or credit to reflect the price difference between the expiring and new contracts.
• To avoid CFD rollovers, clients can choose to close any open CFD positions prior to the expiration date.
• Please ensure that all take-profit and stop-loss settings are adjusted before the rollover occurs.
• All internal transfers for accounts under the same name will be prohibited during the first and last 30 minutes of the trading hours on the rollover dates.
If you’d like more information, please don’t hesitate to contact info@vtmarkets.com.
Embarking on the exhilarating journey of Forex trading is like riding a rollercoaster, with its ups and downs, twists, and turns. Just like a rollercoaster ride, the financial markets can be thrilling, and sometimes, unpredictable.
In the last Bull market, spanning from March 2009 to February 2020, the S&P 500 surged an astonishing 339%, transforming a $10,000 investment into a remarkable $43,900. It was a period of exuberance and optimism, where the financial landscape seemed boundless.
However, as we’ve witnessed, the financial markets are not all highs and cheers. The Bear market that swiftly followed in March 2020, triggered by the unforeseen COVID-19 pandemic, illustrated the capricious nature of financial markets. In just over a month, the S&P 500 plummeted by 33.9%, showcasing the rapid shift from exuberance to caution.
These events underscore the importance of understanding bull and bear markets for Forex traders, as navigating these fluctuations can be both challenging and rewarding.
In this article, we’ll delve into the meaning and characteristics of bull and bear markets, explore the reasons behind their occurrences, and equip you with strategies to thrive in both market conditions.
What is a Bull Market?
The term “Bull Market” finds its roots in the behaviour of the formidable bull. When a bull charges, it thrusts its horns upward, symbolising a rising market. This metaphor encapsulates the essence of a Bull Market, where the financial landscape experiences an upward surge, mirroring the powerful and optimistic momentum witnessed when a bull charges forward.
A Bull Market, as the name suggests, denotes a period of optimism, growth, and ascending asset prices. During this phase, investor confidence is on the rise, fostering a positive outlook and a readiness to embrace risk-taking activities.
Numerous factors contribute to the emergence of a Bull Market, including favorable economic indicators such as robust GDP growth, low unemployment rates, and stellar corporate earnings. Accommodative government policies, favorable monetary measures, and overall confidence in the financial system work in tandem to propel asset prices upward during these bullish phases.
Bull markets exhibit varying durations, ranging from a few months to several years. Notably, they tend to outlast bear markets and have occurred for an impressive 78% of the past 91 years. On average, a bull market persists for approximately 973 days, equivalent to 2.7 years.
What is a Bear Market?
The term “Bear Market” finds its origin in the actions of a bear. When a bear attacks, it swipes its paws downward, symbolising a declining market. This imagery captures the essence of a Bear Market, where financial conditions take a downturn, akin to the motion of a bear moving its paws downward.
A Bear Market, as the name suggests, represents a period of pessimism, decline, and falling asset prices. During this phase, investor confidence diminishes, leading to a negative outlook and a reluctance to engage in risk-taking activities.
Several factors contribute to the emergence of a Bear Market, including unfavourable economic indicators such as economic contractions, rising unemployment rates, and weakened corporate earnings. Unfavourable government policies, restrictive monetary measures, and a general lack of confidence in the financial system collectively contribute to driving asset prices downward during these challenging market phases.
Historically, bear markets tend to be shorter than bull markets. On average, a bear market lasts just 289 days, or just under 10 months. While some bear markets have extended over years, the longest recorded bear market occurred during the Great Depression from March 1937 to April 1942, lasting for 61 months.
In recent decades, bear markets have generally become shorter in length. For instance, in 1990, a bear market lasted for just three months. Recovery periods after bear markets vary; since World War II, it has taken about two years, on average, for the stock market to recover or reach its previous high.
It’s crucial to note that even during bear markets, the stock market can witness significant gains. Over the last two decades, over half of the S&P 500’s strongest days occurred during bear markets, emphasising the unpredictable nature of market movements.
Lucia Heffernan, Wall Street Gothic source: Rehs Contemporary Galleries, Inc., New York City
What Should a Trader Do in a Bull or a Bear Market?
Navigating the waters of financial markets requires traders to be versatile, adapting their strategies to the prevailing conditions – be it the soaring heights of a bull market or the challenging terrain of a bear market.
Strategies for Traders During a Bull Market:
1. Trend-Following: In the upbeat atmosphere of a bull market, traders can align with the prevailing trend, known as trend-following. This involves capitalising on the upward momentum of assets, riding the wave of optimism among investors.
2. Momentum Trading: Another effective strategy during a bull market is momentum trading. Traders identify assets with strong recent performance, anticipating that the upward momentum will continue. This approach leverages the positive sentiment that characterises bull markets.
3. Strategic Investments: Bull markets provide an ideal environment for strategic investments. Traders may consider allocating resources to growth-oriented assets and industries, capitalising on the prevailing optimism and economic expansion.
Strategies for Traders During a Bear Market:
1. Hedging: As the market takes a downturn, traders may employ hedging strategies to protect their portfolios from significant losses. Techniques such as options or inverse exchange-traded funds (ETFs) can act as a financial shield against the falling prices prevalent in a bear market.
2. Contrarian Approaches: Adopting a contrarian mindset in a bear market involves going against the prevailing sentiment. Traders may seek opportunities in oversold assets, expecting a potential rebound despite the overall negative outlook.
3. Defensive Investments: Shifting towards defensive assets like bonds, gold, or stable dividend-paying stocks helps mitigate risk during a bear market. These defensive investments act as a protective buffer against the downward pressures on asset prices.
Effective risk management is crucial for successful trading, no matter the market conditions. Traders must establish clear risk tolerance levels, ensuring they are comfortable with potential losses. Diversifying portfolios by spreading investments across different assets and industries helps mitigate the impact of poor performance in specific sectors.
Additionally, implementing stop-loss orders is vital in both bull and bear markets, automatically selling a security when it reaches a predetermined price to help traders minimise losses and protect gains.
Successfully navigating financial markets requires not only strategic acumen but also emotional resilience. In the optimism of a bull market, where euphoria can take hold, maintaining discipline is paramount to avoid impulsive decisions driven by overconfidence or greed.
Conversely, in the challenges of a bear market, characterised by fear and panic, traders must adhere to their strategies, steering clear of emotional reactions to market fluctuations.
Regardless of the market conditions, adaptability remains a psychological asset. Continuous learning about market conditions, economic indicators, and evolving strategies is essential for traders to thrive.
Navigating Bull and Bear Markets with VT Markets
Unlock the optimal approach to profit from both bullish and bearish market trends through CFD trading with VT Markets. Tailored to empower traders in diverse conditions, CFDs offer the flexibility to capitalise on market rises and falls seamlessly.
Whether going long to ride the upward momentum or going short to benefit from downturns, VT Markets provides a dynamic platform that allows swift trading across various asset classes. Diversify your portfolio effortlessly with currencies, indices, energies, metals, commodities, shares and bonds.
With user-friendly platforms and educational resources, VT Markets makes CFD trading accessible and effective. Open your live trading account in just 5 minutes and experience a landscape where adaptability converges with opportunity in the ever-changing dynamics of financial markets.
In conclusion, navigating the Forex rollercoaster demands a keen understanding of both bull and bear markets. The euphoria of bull markets, exemplified by the remarkable S&P 500 surge from 2009 to 2020, must be balanced with an awareness of downturns like the swift bear market triggered by the COVID-19 pandemic in 2020.
Traders must adapt strategies to both bullish and challenging bear markets, employing techniques such as trend-following, momentum trading, hedging, and contrarian approaches. Effective risk management and a resilient mindset are crucial, emphasising continuous learning and adaptability. In this landscape, traders can find success by employing versatile strategies and maintaining a disciplined and adaptable approach to market dynamics.
Whether you’re a seasoned trader or just starting out, understanding the power of technical analysis can make a significant difference in your success.
We’ll delve deep into the intricacies of technical analysis and how you can apply various tools and chart patterns to enhance your gold trading strategies. So, grab your notepad, and let’s get started!
The Foundation of Technical Analysis
Before we dive into the specifics of gold trading, let’s establish a solid foundation in technical analysis. At its core, technical analysis involves examining historical price data and trading volumes to predict future price movements.
It’s based on the belief that historical price movements tend to repeat themselves and that patterns can be identified and analyzed to make informed trading decisions.
Key Tools for Technical Analysis
#1. Candlestick Charts
Candlestick charts are a trader’s best friend in technical analysis. These charts visually represent price movements over a specified time period.
Each candlestick consists of a body and wicks, and the color and shape of the candlesticks can convey valuable information.
For instance, a green (or white) candlestick indicates a bullish trend, suggesting that the price closed higher than it opened.
Conversely, a red (or black) candlestick represents a bearish trend, signifying that the price closed lower than it opened.
#2. Moving Averages
Moving averages smooth out price data over a specific period, allowing traders to identify trends more easily.
The two most commonly used moving averages are the simple moving average (SMA) and the exponential moving average (EMA).
For example, if the 50-day SMA crosses above the 200-day SMA, it’s often considered a “golden cross,” signaling a potential uptrend.
On the other hand, a “death cross” occurs when the 50-day SMA crosses below the 200-day SMA, indicating a potential downtrend.
#3. Relative Strength Index (RSI)
The RSI is a momentum oscillator that measures the speed and change of price movements. It ranges from 0 to 100 and is used to identify overbought and oversold conditions.
When the RSI crosses above 70, it suggests that an asset may be overbought and due for a correction. Conversely, when it drops below 30, it indicates an oversold condition.
Applying Technical Analysis to Gold Trading
Now that we’ve covered the fundamental tools, let’s apply them to gold trading. Gold, often called the “safe-haven” asset, exhibits unique behavior that can be analyzed through technical analysis.
Example 1: Support and Resistance Levels
One common strategy is to identify key support and resistance levels on a gold price chart. These levels represent points where the price is likely to reverse or continue its current trend.
Suppose you notice that gold consistently bounces off a support level of around $1,750 per ounce. When the price approaches this level, you might consider it an opportunity to buy, anticipating a bounce back upward.
Conversely, if gold approaches a resistance level, such as $1,850, you might consider it a good time to sell, expecting a pullback.
Example 2: Bullish and Bearish Candlestick Patterns
Candlestick patterns provide valuable insights into market sentiment. The “bullish engulfing” and “bearish engulfing” patterns are two common patterns to watch for in gold trading.
A bullish engulfing pattern occurs when a small red candlestick is followed by a larger green candlestick, suggesting a potential bullish reversal.
Conversely, a bearish engulfing pattern involves a small green candlestick followed by a larger red candlestick, indicating a potential bearish reversal.
Securing Gold Profits with Technical Analysis
In conclusion, technical analysis serves as a formidable ally in refining your gold trading strategies. With a grasp on candlestick charts, moving averages, and indicators like the RSI, you’re well-equipped to navigate the ebbs and flows of the gold market with VT Markets.
Start Your Gold Trading Journey Safely with VT Markets
Are you eager to translate theory into action? Consider opening a demo account with VT Markets, a trusted trading platform. This practical step invites you to test your technical analysis prowess without financial risk. Embark on your trading journey today with VT Markets, and you may well be on your way to discovering a goldmine of opportunities! Remember, continuous learning and leveraging the resources at VT Markets can further sharpen your technical analysis acumen for gold trading.
Your adventure in trading is just getting started with VT Markets by your side.