In a bullish session, stocks closed higher with the S&P 500, Dow Jones, and Nasdaq posting gains fueled by positive earnings reports, particularly from Intuitive Surgical and Lennar. Investor attention is now focused on the eagerly awaited consumer price index (CPI) report and producer price index, with expectations influencing speculation about potential shifts in Federal Reserve interest rate policies. The dollar index declined slightly due to gains against the yen and losses versus the euro, influenced by yield spreads and economic indicators. Meanwhile, the Bank of Japan maintains caution in unwinding monetary policies, while the eurozone faces economic concerns. Sterling rose, supported by higher gilts-Treasury yield spreads, despite BoE rate cuts pricing lower than the Fed’s.
Stock Market Updates
Stocks closed higher on Wednesday, driven by anticipation surrounding the upcoming release of fresh U.S. inflation data and corporate earnings reports. The S&P 500 rose by 0.57% to close at 4,783.45, the Dow Jones Industrial Average added 170.57 points (0.45%) to reach 37,695.73, and the Nasdaq Composite advanced 0.75% to settle at 14,969.65. Intuitive Surgical and Lennar played pivotal roles in lifting the market, with both companies experiencing notable stock increases of 10.3% and 3.5%, respectively. Intuitive Surgical raised its procedure growth outlook for fiscal year 2024, while Lennar announced an increase in its annual dividend.
Investor focus is now shifting towards the awaited consumer price index (CPI) report scheduled for release on Thursday, with expectations of a 3.2% year-over-year increase in December. Additionally, the producer price index is set for release on Friday. Investors are closely monitoring these reports for insights into potential shifts in the Federal Reserve’s interest rate policies, with current expectations hovering around a 64% likelihood of rate cuts, according to the CME Group FedWatch tool. The upcoming earnings season adds to the market’s dynamics, with major financial heavyweights like JPMorgan Chase, Bank of America, UnitedHealth, and Delta Air Lines set to reveal their results on Friday. Despite a mixed session on Tuesday, stocks exhibited positive momentum on Wednesday.
Data by Bloomberg
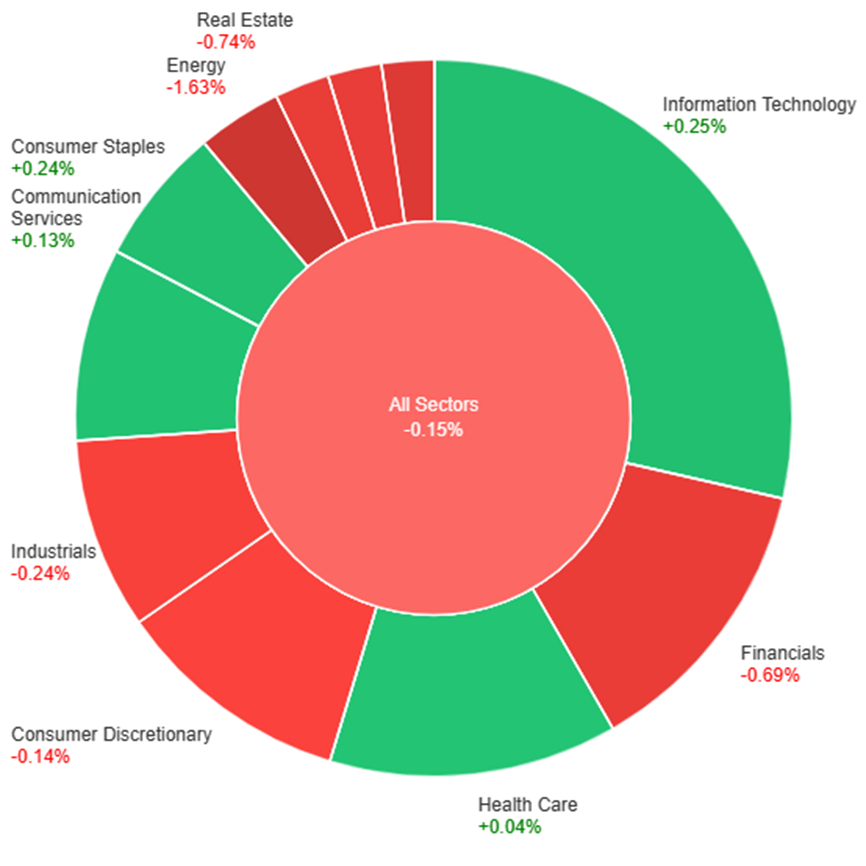
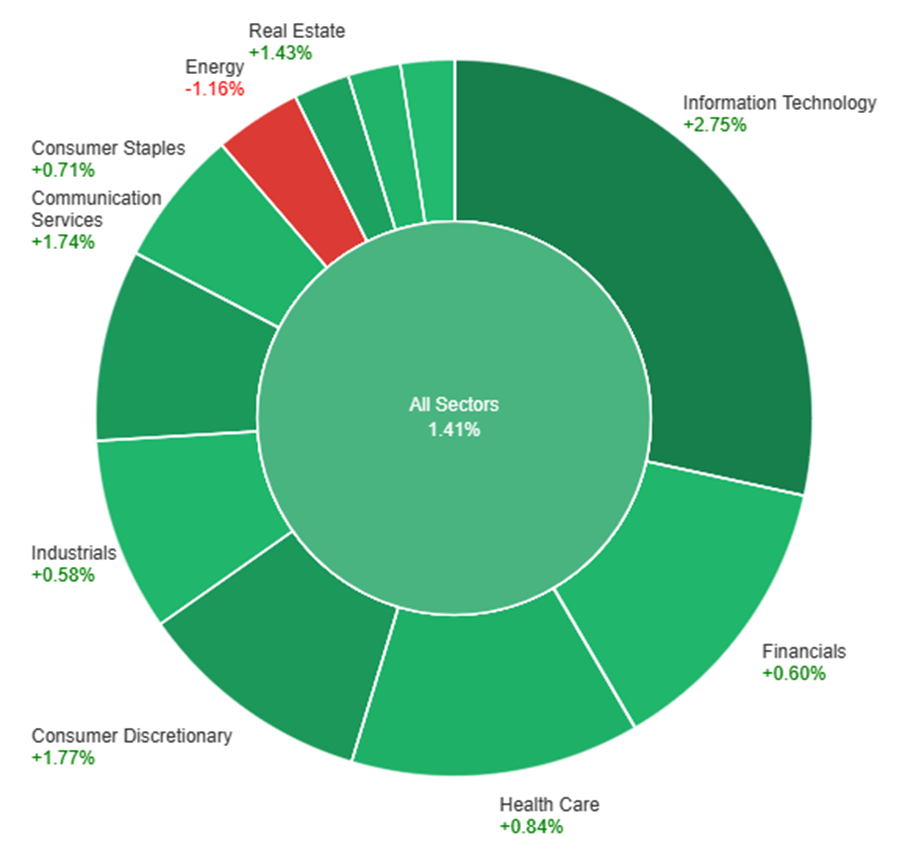
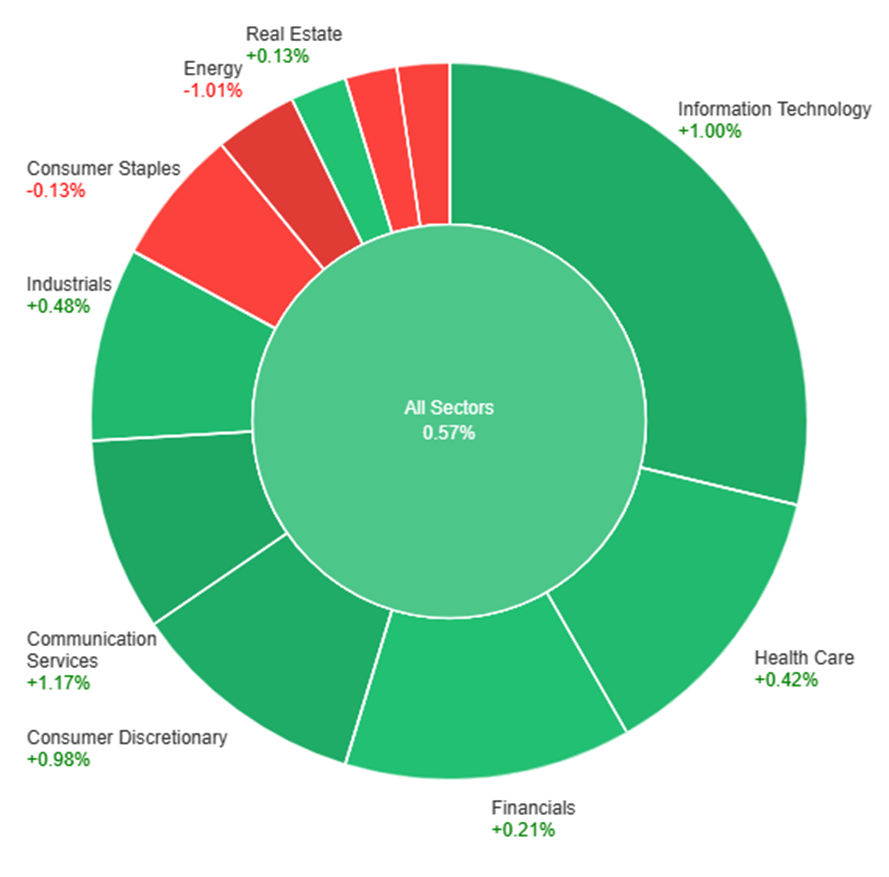
On Wednesday, the overall market exhibited a positive trend with a gain of 0.57%. Notable sector performances include Communication Services and Information Technology, both experiencing substantial increases at +1.17% and +1.00%, respectively. Consumer Discretionary and Industrials also contributed to the positive momentum with gains of +0.98% and +0.48%. Health Care and Financials showed more modest increases at +0.42% and +0.21%. On the flip side, Energy suffered a notable decline of -1.01%, dragging down the overall performance. Utilities and Consumer Staples experienced marginal losses at -0.06% and -0.13%, while Real Estate and Materials also showed slight decreases at +0.13% and -0.17%.
Currency Market Updates
The dollar index experienced a 0.1% decline, driven by notable gains against the vulnerable yen and losses versus the euro. This shift was influenced by the widening 2-year bund-Treasury yield spreads, reaching their highest point since July. The euro’s strength was partly attributed to comments made by ECB hawk Isabel Schnabel. Meanwhile, the Japanese yen faced broad selling pressure as Japanese data revealed a mere 1.2% rise in regular wages and a 3.0% year-on-year decline in real wages for November. This decline underscores persistent inflation concerns and a lack of domestic demand-driven wage growth, aligning with the Bank of Japan’s reluctance to end negative rates.
As the Japanese household spending continued to plummet, acting as a drag on growth and reinforcing disinflation in the December Tokyo CPI report, the BoJ governor expressed a cautious approach towards unwinding ultra-loose monetary policies. In contrast, the U.S. market anticipates the CPI report, assessing the likelihood of a soft landing and potential cuts to the Fed’s 5.5% policy rate compared to the BoJ’s -0.1% rate. The accommodative BoJ policies contributed to the Nikkei 225 reaching its highest point since the 1990s bubble, fostering risk-on sentiment and positively correlating with the rise of USD/JPY towards the key resistance. Meanwhile, EUR/USD showed a 0.34% increase, approaching the 10-day moving average but staying within the range set by Friday’s U.S. jobs data. ECB policymakers highlighted a tepid economic recovery outlook in the eurozone, anticipating a recession in late 2023, driven by concerns about the German property market and supply chain risks. Sterling saw a 0.24% rise, supported by higher gilts-Treasury yield spreads, despite remaining below the November and December highs, as the BoE’s 2024 rate cuts priced roughly 30bp less than those for the Fed.
Picks of the Day Analysis
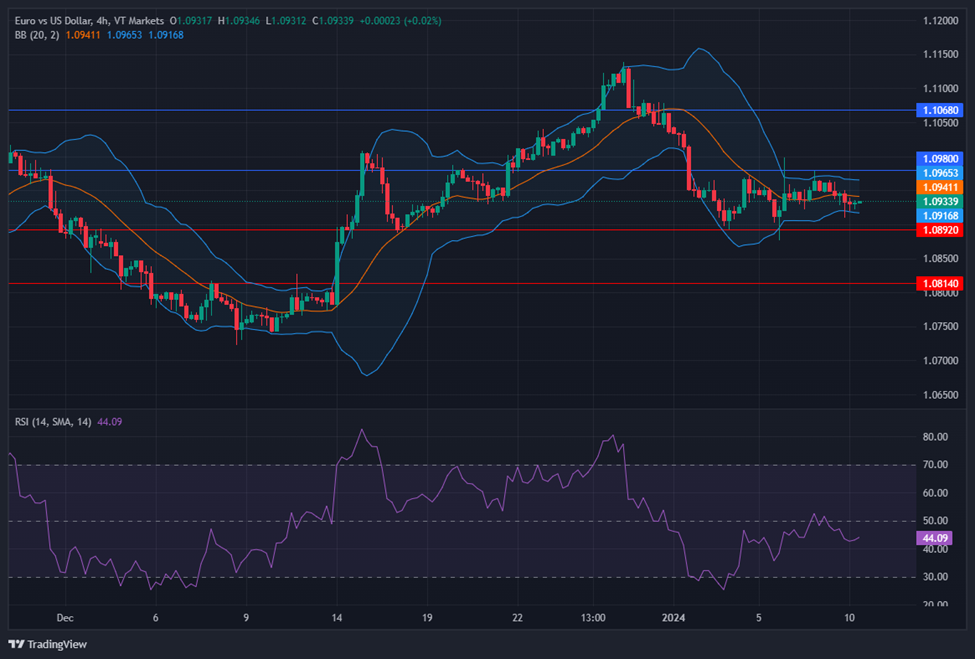
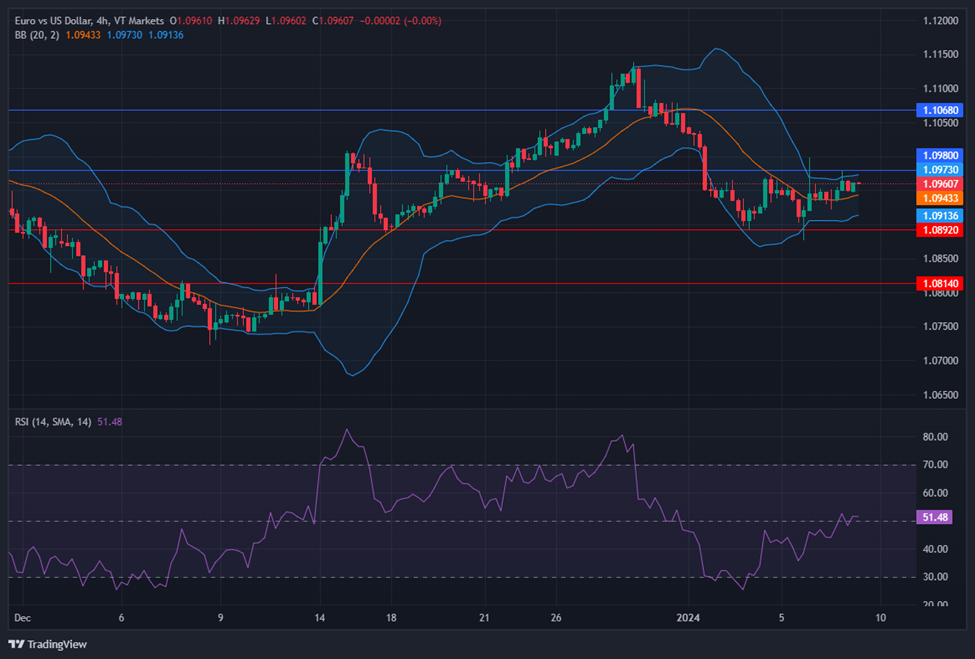
EUR/USD (4 Hours)
EUR/USD Gains Ground Amidst Greenback’s Downside Pressure and Market Optimism
In response to a renewed downside bias in the greenback, EUR/USD rebounded, reaching two-day highs in the 1.0965/70 range. The firm optimism in the risk space on Wednesday contributed to the climb, as the USD Index (DXY) faced pressure, retreating to the 102.30 region. Factors such as the absence of clear direction in US yields, an uptick in Germany’s 10-year bund yields, and prevailing risk-on sentiment influenced the pair’s daily movement. Despite a lack of clarity in US yields and rising 10-year bund yields, the focus now shifts to the upcoming US inflation readings, set to be a crucial driver for the dollar’s price action, considering the Federal Reserve’s potential interest rate reductions in the second quarter. Conversely, comments from ECB’s De Guindos and Schnabel regarding a soft landing in the Eurozone’s economy and a reachable inflation target in 2025 had limited impact on the pair. Suggestions of premature interest rate cuts by the ECB, despite speculations of potential reductions, did not significantly sway the market.
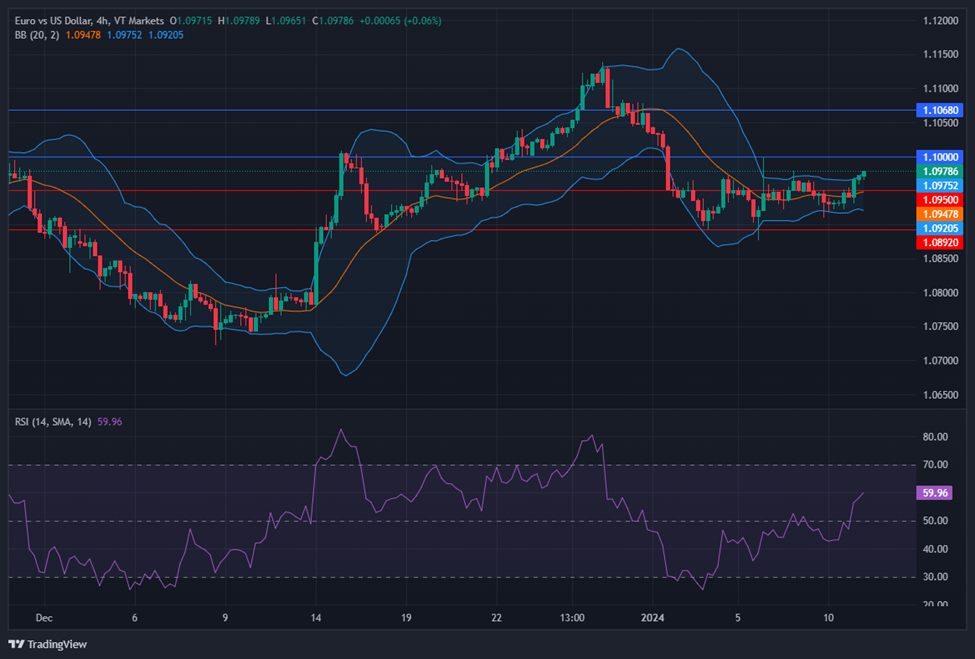
On Wednesday, the EUR/USD moved slightly higher and reached the upper band of the Bollinger Bands. Currently, the price moving just around the upper band, suggesting another potential upward movement. Notably, the Relative Strength Index (RSI) maintains its position at 59, signaling a neutral but bullish outlook for this currency pair.
Resistance: 1.1000, 1.1068
Support: 1.0950, 1.0892
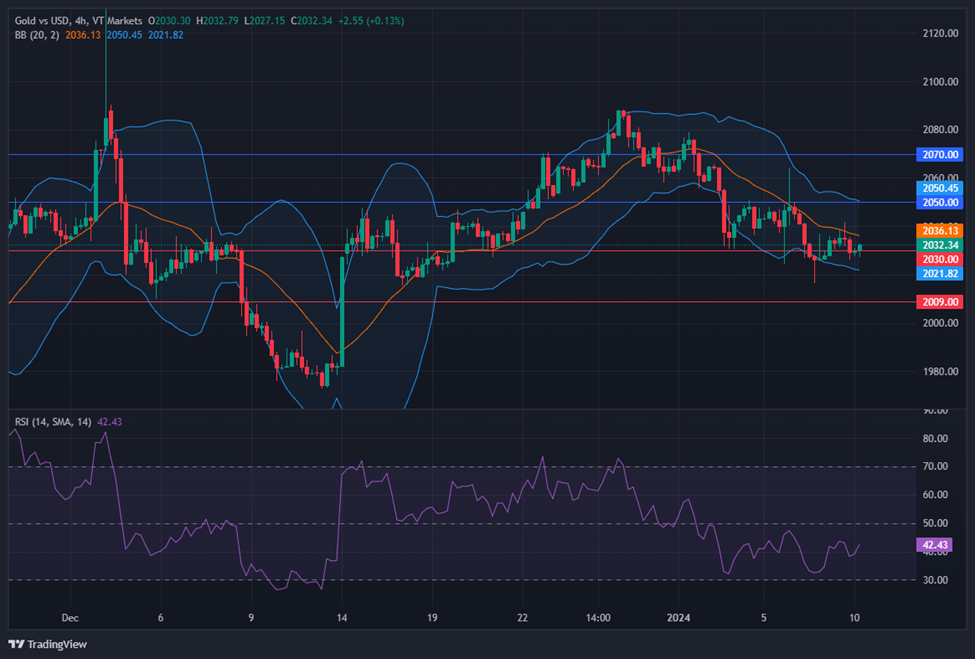
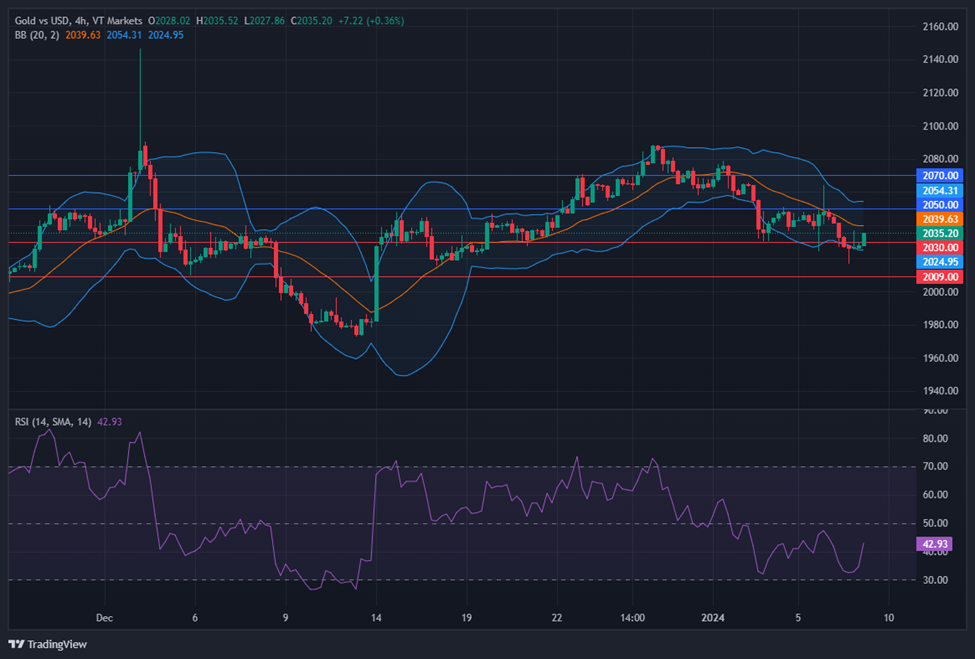
XAU/USD (4 Hours)
XAU/USD Hovers as Investors Await Key CPI Data Amidst Lethargic Trading
Gold (XAU/USD) continues to tread familiar levels, showing limited movement amid a cautious market environment marked by a sparse macroeconomic calendar. The precious metal recently touched a weekly low at $2,016.61 and faces support at various levels. As Wall Street maintains a positive but uneventful stance, anticipation builds for the upcoming release of the December Consumer Price Index (CPI) in the United States. Analysts predict a 3.2% annualized increase, with a potential impact on the US Federal Reserve’s rate-cutting decisions. The gold market remains on edge, awaiting CPI readings that could influence sentiment and guide the trajectory of the US Dollar in the coming days.
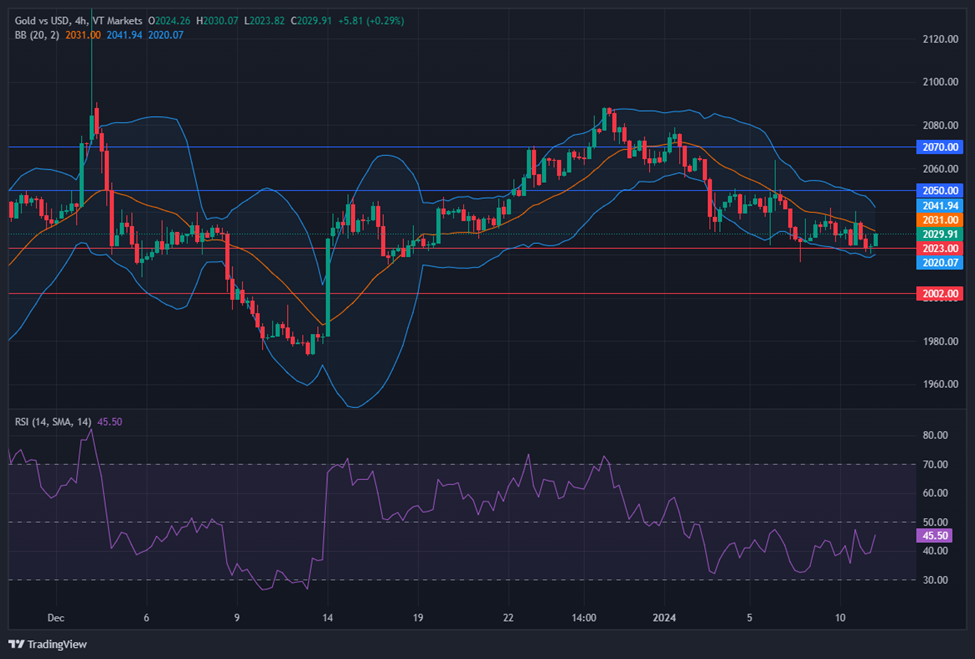
On Wednesday, XAU/USD moved lower and was able to reach the lower band of the Bollinger Bands. Currently, the price moving higher and trying to reach the middle band. The Relative Strength Index (RSI) stands at 45, signaling a neutral outlook for this pair.
Resistance: $2,050, $2,070
Support: $2,023, $2,002
Economic Data
| Currency | Data | Time (GMT + 8) | Forecast |
|---|---|---|---|
| USD | Core CPI m/m | 21:30 | 0.3% |
| USD | CPI m/m | 21:30 | 0.2% |
| USD | CPI y/y | 21:30 | 3.2% |
| USD | Unemployment Claims | 21:30 | 209K |