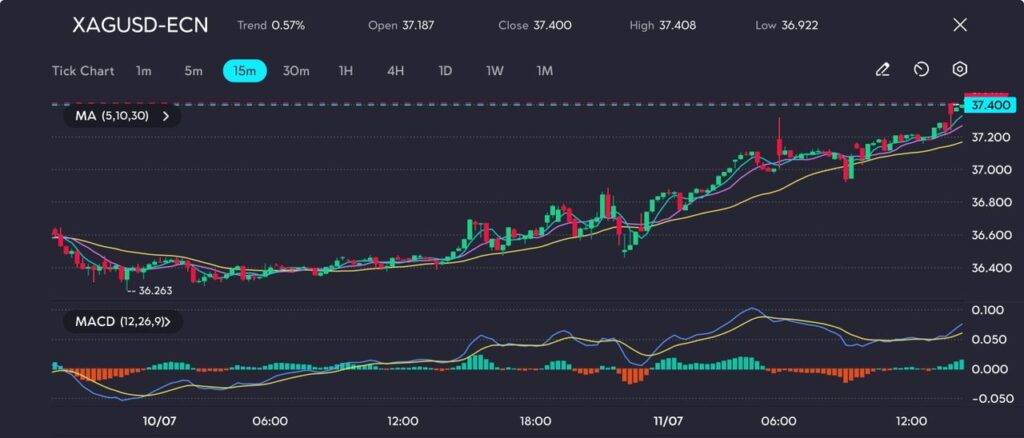
Silver is gaining renewed attention as rising trade tensions and geopolitical risks drive investors toward safe-haven assets. This analysis breaks down what’s fuelling silver’s momentum, key technical patterns, and the outlook going forward.
Silver spikes on trade fears
Silver prices surged beyond $37.40 per ounce on Friday, marking their highest level in more than 13 years, amid a rising wave of risk aversion across global markets.
The sharp uptick followed the announcement of President Donald Trump’s extensive tariff measures, which now include 35% tariffs on Canadian imports, proposed blanket tariffs of 15%–20% on most trade partners, and confirmed 50% duties on Brazilian goods and copper shipments.
In addition, the White House issued fresh tariff threats targeting Japan, South Korea, and several smaller economies this week.
These aggressive trade stances reignited concerns over a potential slowdown in global trade activity, prompting investors to shift into safe-haven assets such as silver and gold.
Technical analysis
Silver has staged a strong rebound from an intraday low of $3,311, closing at $3,319.48.
The recovery brought prices back into a congestion range between $3,320 and $3,325—considered a mid-term resistance area—after breaking above the descending 5/10 moving average channel.
Picture: Momentum building heading toward $3,360, as seen on the VT Markets app.
The moving averages are beginning to align with a bullish bias: the 5-day MA has crossed above the 10-day MA and is now approaching the 30-day MA, indicating growing upward momentum.
The MACD has also turned positive, with the histogram moving above the zero line—supporting a short-term bullish outlook.
That said, the zone just below $3,335 remains a key resistance, acting as a ceiling that could either trigger a breakout or lead to a pullback.
Momentum holds, but caution lingers
While strong safe-haven demand continues to underpin silver’s bullish run, several factors could slow its momentum.
Ongoing geopolitical uncertainty and tariff-related tensions remain supportive, but a strengthening US dollar and the Federal Reserve’s hawkish policy stance may limit further upside.
Should silver break decisively above the $37.50 level with solid volume, a move towards the $38.00 mark appears within reach.
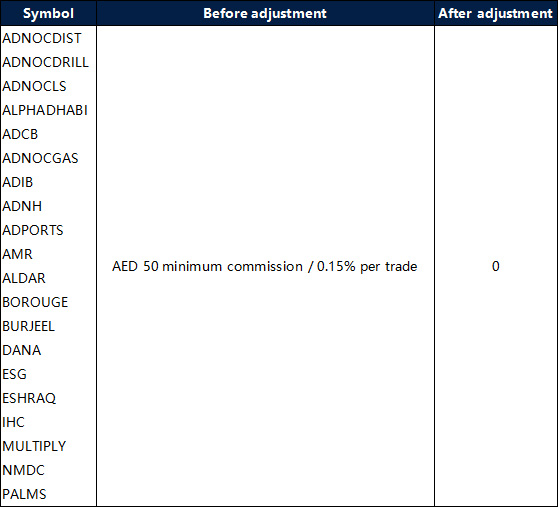
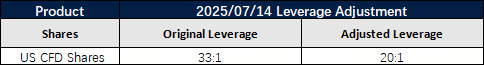
To provide a better trading environment in accordance with market conditions, VT Markets will adjust the commission structure for selected Middle East stocks effective July 14, 2025.
Please find the table below for more information:
The above data is for reference only, please refer to the MT5 software for specific data.
Friendly reminder:
1. The rest of the specifications remain original except for the commission.
If you’d like more information, please don’t hesitate to contact info@vtmarkets.com.
Getting started in trading can be both exciting and overwhelming. With countless tools, market movements, and strategies to explore, beginners often face a steep learning curve. The good news? You don’t have to risk real money while learning.
A VT Markets demo account gives you a risk-free way to practise trading with virtual funds in real market conditions. It’s the perfect environment to try strategies, understand how markets move, and build confidence.
In this article, we’ll explore five beginner-friendly trading strategies you can test directly on your VT Markets demo account – complete with simple steps and examples.
What is a VT Markets demo account and why use one?
A VT Markets demo account is a free trading account that allows you to trade using virtual funds – in real-time market conditions – without any financial risk. It’s designed for beginners who want to get comfortable with trading platforms (MT4 or MT5), test their ideas, and improve decision-making.
Key benefits include:
Real market data with no actual money involved.
Full access to technical indicators, charts, and order types.
Customisable balance from $3,000 to $5,000,000.
Valid for 90 days (MT4) or 30 days from last login (MT5).
Reset anytime via the VT Markets Client Portal.
Using a demo account helps you build good habits, understand how trades are executed, and reduce emotional pressure – all before going live.
Strategy 1. Support and resistance bounce
Support and resistance are horizontal levels where price tends to reverse. Support acts as a price floor; resistance as a ceiling.
These levels attract buy/sell orders from traders, creating natural bounce zones.
Example: EUR/USD bounces off 1.0800 support three times over several days, giving clear long trade opportunities.
How to test it on demo:
Open a chart like EUR/USD or GBP/USD.
Draw horizontal lines at recent highs and lows.
Wait for the price to approach those zones.
Enter a demo trade when price bounces off the level (use candlestick confirmation).
Place stop-loss just beyond the level; aim for 1:2 risk-reward.
Tip: Combine this strategy with RSI or MACD for stronger confirmation.
Crossovers help identify trend shifts by smoothing out price action.
Example: GBP/JPY 9 EMA crosses above 21 EMA – pair gains 60+ pips over the next session.
How to test it on demo:
Add 9 EMA and 21 EMA to your chart.
Buy when 9 EMA crosses above 21 EMA; sell when it crosses below.
Enter trade at the close of the crossover candle.
Place stop-loss below the most recent swing low/high.
Monitor the trend and exit when the EMAs cross again or price shows signs of reversal.
Pro tip: Combine this with support/resistance zones for even better entries.
Strategy 3. Breakout trading
This strategy involves trading when price breaks out of a defined range or chart pattern.
Breakouts often signal strong momentum – especially after a period of consolidation.
Example: USD/CHF trades sideways for two days, then breaks out of a rectangle pattern and rallies by 70 pips.
How to test it on demo:
Look for tight consolidation ranges or triangle patterns.
Draw support and resistance levels marking the range.
Place pending buy/sell stop orders just beyond the range.
Confirm breakout with strong volume or large candle.
Practise setting tight stop-losses just outside the opposite side of the pattern.
Tip: Avoid false breakouts by waiting for the candle to close outside the range.
Strategy 4. RSI overbought/oversold
RSI (Relative Strength Index) helps identify momentum extremes – typically over 70 (overbought) or under 30 (oversold).
When momentum becomes too stretched, prices often correct or reverse.
Example: AUD/USD hits RSI 25 → bounces upward 40 pips within the next two candles.
How to test it on demo:
Add RSI (14) to your chart.
Watch for RSI crossing below 30 (buy signal) or above 70 (sell signal).
Confirm with a price action pattern – e.g. bullish engulfing candle at support.
Enter mock trade and place stop-loss below/above recent swing.
Track success rate over 10–15 trades.
Pro tip: RSI works best in ranging markets – avoid using it in strong trends.
Strategy 5. Trading around news events
This strategy uses economic news (like interest rate decisions or jobs data) to capitalise on short-term volatility.
News events often trigger sharp price movements, especially when data surprises the market.
Example: Gold (XAU/USD) spikes $15 within minutes after the US Fed announces a rate pause.
How to test it on demo:
Check the VT Markets economic calendar for upcoming high-impact news.
Choose instruments that respond well to news (e.g. gold, GBP/USD, indices).
Observe price behaviour 5–10 minutes before and after release.
Practise placing breakout or reversal trades based on reaction.
Use tight stops and reduced position sizes – news can be volatile.
Warning: Fast moves mean fast losses. Use this strategy only after mastering basic setups.
Pro tips for demo success
Treat your demo account like it’s real money – this builds discipline.
Keep a trade journal: log the strategy, entry, reason, result, and what you learned.
Focus on one strategy at a time to improve clarity and learning.
Use proper risk management – risk no more than 1–2% per trade.
Don’t rush to go live – aim for consistent results first.
Conclusion
Now that you’ve learned five beginner-friendly trading strategies – support/resistance, moving averages, breakouts, RSI, and news trading – the next step is simple: test them for yourself.
A VT Markets demo account gives you the perfect environment to explore, practise, and grow your skills without any financial pressure.
With the global push for cleaner energy, renewable energy stocks are becoming an attractive investment. As the demand for sustainable solutions like solar, wind, and hydropower rises, leading companies in these sectors are poised for growth. In this article, we explore the 10 best renewable energy stocks to watch in 2025, providing key insights for potential investors.
What Are Renewable Energy Stocks?
Renewable energy stocks are shares in companies involved in generating or supporting the production of energy from renewable sources such as wind, solar, hydroelectric, and geothermal. As the world increasingly shifts towards cleaner, more sustainable energy solutions, these stocks have become attractive investment opportunities. Investors are drawn to renewable energy companies due to their growth potential, government backing, and the global push for sustainability.
These companies are not only helping to shape the future of energy but also benefiting from growing interest in sustainability. Renewable energy stocks encompass a broad range of opportunities, from large multinational energy providers to smaller, innovative companies specializing in specific renewable technologies.
Types of Renewable Energy
Renewable energy comes in many forms, each with its own benefits and investment potential. Here are the main types of renewable energy that dominate the stock market:
Solar Energy: Solar power is the most widely used renewable energy source. Solar energy stocks involve companies that manufacture solar panels, provide solar energy solutions, and even offer solar grid technology.
Wind Energy: Wind energy companies are at the forefront of generating power from wind turbines, both onshore and offshore. This rapidly growing sector presents promising opportunities for investors.
Hydropower: Hydropower companies generate energy through water flow. While it’s a mature industry, investments in hydropower stocks can still yield steady returns, especially with new innovations in small-scale hydro systems.
Geothermal: Geothermal energy uses the Earth’s heat to generate electricity. Though less common, geothermal companies are growing in number, providing innovative energy solutions.
Biomass: Biomass energy is derived from organic materials. Biomass companies create renewable energy from agricultural and waste products, providing environmentally friendly alternatives to fossil fuels.
10 Best Renewable Energy Stocks to Watch in 2025
Renewable energy stocks offer strong growth potential, but like all investments, they come with inherent risks. While the best renewable energy companies listed here have shown positive performance in recent years, it’s important to note that past performance does not guarantee future results. These stocks may experience price fluctuations based on market conditions, technological advancements, or regulatory changes.
Ticker
Company
Market Capitalization (approx.)
Price
NEE
NextEra Energy
$151.61 Billion
$73.65
TSLA
Tesla
$951.70 Billion
$295.88
BEP
Brookfield Renewable Partners
$7.39 Billion
$26.01
ENPH
Enphase Energy
$5.62 Billion
$42.85
FSLR
First Solar
$17.8 Billion
$165.99
IBDRY
Iberdrola
$112.89 Billion
$73.59
ORA
Ormat Technologies
$5.35 Billion
$88.14
PLUG
Plug Power
$2.04 Billion
$1.78
VWDRY
Vestas Wind Systems
$16.66 Billion
$5.58
RUN
Sunrun
$2.4 Billion
$10.51
Here are the 10 best renewable energy stocks to consider for 2025, showcasing their potential growth factors, market performance, and recent price trends. Keep in mind that renewable energy stocks are subject to market volatility and economic conditions, but the long-term growth potential in the clean energy sector remains strong.
1. NextEra Energy (NEE) – Leader in Clean Energy Innovation
NextEra Energy is one of the largest and most prominent renewable energy companies in the United States. It operates through its subsidiaries, focusing on wind, solar, and energy storage solutions. As a leader in clean energy, NextEra has been instrumental in expanding the use of renewable resources, with a robust portfolio of renewable energy projects and a significant presence in both the U.S. and global energy markets.
NextEra Energy’s share price has remained strong, reflecting its growth in renewable energy production and significant investment in wind and solar projects. The company’s market leadership and its commitment to sustainability make it an appealing option for investors looking for long-term growth in the green energy sector.
Potential Growth Factors:
Extensive investment in solar and wind energy projects.
Significant growth in energy storage solutions.
Government policies favoring clean energy could drive demand.
Strong market leadership in renewable energy infrastructure.
2. Tesla (TSLA) – Revolutionizing Clean Energy and Electric Vehicles
Tesla, although primarily known for its electric vehicles, is also a major player in the renewable energy sector. The company’s energy division produces solar products and energy storage solutions, including solar panels, solar roofs, and the Powerwall energy storage system. Tesla’s innovative approach to integrating renewable energy with electric vehicles offers a unique opportunity for investors to tap into both the clean energy and electric vehicle markets.
Tesla’s share price has been highly volatile but remains a top performer, with its renewable energy initiatives contributing significantly to its market valuation. The company’s growth in the renewable energy sector has been enhanced by its efforts to integrate solar and battery technologies to create comprehensive energy solutions.
Potential Growth Factors:
Integration of solar technology and electric vehicles.
Increasing global adoption of clean energy solutions.
Continuous innovation in solar and energy storage products.
Growth in the electric vehicle market complements energy initiatives.
3. Brookfield Renewable Partners (BEP) – A Global Leader in Renewable Power Generation
Brookfield Renewable Partners operates one of the largest renewable energy portfolios worldwide, with assets in hydroelectric, wind, and solar power. The company has a global presence, including North America, Europe, and Latin America, and is a key player in providing renewable energy solutions across various markets. Brookfield’s strong track record in renewable energy generation has earned it a reputation as a reliable and stable investment.
Despite its smaller market capitalization compared to giants like NextEra Energy, Brookfield Renewable Partners has seen steady growth in its stock price, driven by its diversified renewable energy assets and long-term contracts with customers. The company’s focus on sustainable power generation positions it well for continued growth.
Potential Growth Factors:
Diverse renewable energy assets across North America, Europe, and Latin America.
Long-term contracts that provide stable cash flow.
Expansion into new renewable markets and technologies.
Growing demand for clean energy and government incentives.
4. Enphase Energy (ENPH) – Innovator in Solar Technology
Enphase Energy is a leading provider of solar microinverters, which convert the energy generated by solar panels into usable electricity. The company’s products are widely used in residential and commercial solar installations, making it a crucial player in the solar energy market. Enphase has capitalized on the growing demand for solar energy solutions by providing efficient and reliable solar technology that enhances the performance of solar energy systems.
Enphase’s stock price has been on a positive trajectory, reflecting the growing demand for solar energy and the company’s innovative approach to solar power technology. As the global adoption of solar power continues to rise, Enphase Energy’s market leadership in microinverter technology positions it for future growth.
Potential Growth Factors:
High demand for solar energy systems and technology.
Leadership in microinverter technology for enhanced energy performance.
Increased adoption of solar power systems in homes and businesses.
Technological innovations supporting energy management solutions.
5. First Solar (FSLR) – Leading Provider of Solar Solutions
First Solar is a prominent player in the solar energy market, specializing in the manufacture of solar panels and providing large-scale solar power systems. The company has a strong track record in delivering utility-scale solar projects and is recognized for its advanced thin-film photovoltaic (PV) technology. First Solar is focused on reducing the cost of solar power while improving the efficiency and sustainability of its products.
First Solar’s stock price reflects its strong position in the solar industry, particularly as the demand for large-scale solar power projects continues to rise. The company’s focus on utility-scale solar installations has positioned it well for long-term success in the global transition to renewable energy.
Potential Growth Factors:
Strong position in the utility-scale solar market.
Focus on reducing the cost of solar power production.
Growing demand for large-scale solar projects.
Government incentives support solar energy development.
6. Iberdrola (IBDRY) – Global Leader in Renewable Energy
Iberdrola is one of the world’s largest energy companies, with a strong focus on renewable energy. The Spanish utility company has made significant investments in wind, solar, and hydropower, and is a leader in global renewable energy production. Iberdrola is committed to the green energy transition and has been actively increasing its share of renewables in its energy mix.
Iberdrola’s stock price has performed steadily due to the company’s robust growth in renewable energy and its position as a key player in global clean energy. Its investments in offshore wind projects, particularly in Europe and the U.S., provide strong long-term growth potential.
Potential Growth Factors:
Strong investments in offshore wind and renewable energy projects.
Expanding presence in emerging markets.
Government initiatives promoting clean energy.
Growing global demand for sustainable power sources.
7. Ormat Technologies (ORA) – Innovator in Geothermal Energy
Ormat Technologies is a leading provider of geothermal energy solutions. The company develops, builds, and operates geothermal power plants, making it a crucial player in the renewable energy market. Ormat’s technology allows it to harness the Earth’s natural heat to generate electricity, providing a clean and sustainable energy source.
Ormat Technologies’ stock price reflects its strong position in the geothermal energy sector, which is an emerging market with significant growth potential. As interest in geothermal energy increases, Ormat’s innovative solutions are set to benefit from the rising demand for renewable energy.
Potential Growth Factors:
Increasing global interest in geothermal energy as a renewable resource.
Expanding geothermal power plants and operations globally.
Strategic investments in energy storage and grid modernization.
Rising demand for renewable energy sources with a low environmental impact.
8. Plug Power (PLUG) – Leader in Hydrogen Fuel Cells
Plug Power is at the forefront of hydrogen fuel cell technology, providing clean energy solutions to a variety of industries. The company’s hydrogen-powered fuel cells offer an alternative to traditional fossil fuels, making them an essential part of the renewable energy landscape. Plug Power’s focus on developing hydrogen infrastructure and expanding its fuel cell solutions positions it as a leader in the energy transition.
Plug Power’s stock price has seen significant volatility but reflects the growing market interest in hydrogen as a sustainable energy solution. With hydrogen fuel cells becoming a critical component in decarbonizing industries like transportation and manufacturing, Plug Power is positioned for future growth.
Potential Growth Factors:
Growing demand for hydrogen fuel cells in transportation and industrial applications.
Strategic partnerships with major companies to expand hydrogen infrastructure.
Increasing focus on decarbonization and energy efficiency.
Innovation in hydrogen production and storage technology.
9. Vestas Wind Systems (VWDRY) – Pioneering Wind Power Solutions
Vestas is a global leader in wind energy technology, specializing in the design, manufacture, and installation of wind turbines. The company operates in more than 80 countries and is known for its innovative solutions in both onshore and offshore wind power. Vestas has installed over 130 GW of wind power capacity worldwide, making it a crucial player in the renewable energy industry.
Vestas’ stock price has experienced steady growth, driven by the increasing global demand for wind power and its strong position in the wind turbine manufacturing sector. As wind energy continues to be a key component in the world’s renewable energy transition, Vestas is poised for long-term growth.
Potential Growth Factors:
Strong position in the growing global wind power market.
Innovations in turbine efficiency and offshore wind solutions.
Expansion into emerging markets with increasing wind energy demand.
Support from government policies and subsidies for wind energy.
10. Sunrun (RUN) – Leading Provider of Residential Solar Solutions
Sunrun is a leading provider of residential solar energy solutions in the United States. The company focuses on making solar power accessible to homeowners by offering solar installation services with little to no upfront cost. Sunrun’s innovative business model allows homeowners to install solar systems while paying for the energy they produce, reducing energy costs and supporting the shift to renewable energy.
Sunrun’s stock price has shown consistent growth, reflecting the increasing adoption of solar power in residential markets. The company’s leadership in the residential solar space, combined with the growing interest in clean energy, positions Sunrun for continued expansion.
Potential Growth Factors:
Continued growth in residential solar adoption.
Innovative financing options are making solar more accessible.
Partnerships with utility companies to expand solar offerings.
Increasing consumer interest in sustainable energy solutions.
How to Trade or Invest in Renewable Energy Stocks
Investing in renewable energy stocks can offer profitable opportunities as the world increasingly turns toward cleaner energy. Follow these steps to help you navigate the process and make informed investment decisions:
1. Understand the Energy Market
Get familiar with renewable energy sources like solar, wind, and hydropower. Learn about the industry’s growth drivers, such as global sustainability efforts, government incentives, and technological advancements.
2. Choose and Analyze Renewable Energy Stocks
Use fundamental analysis to evaluate a company’s financial health, focusing on key metrics like revenue, profit margins, and P/E ratios. Combine this with technical analysis to study stock price movements, chart patterns, and trends, helping you spot potential buying opportunities.
Choose a reliable broker like VT Markets that offers access to renewable energy stocks. Ensure it has a user-friendly interface, competitive spreads, and access to real-time market data and analysis tools.
4. Open and Fund Your Account
Create a trading account with your chosen broker. Once verified, deposit funds into your account to begin trading. Start with an amount you are comfortable investing and ready to risk.
5. Place Your Trade
Execute your trades by choosing market or limit orders, depending on whether you want to buy at the current price or set a price threshold.
6. Implement Risk Management Strategies
Apply risk management techniques like using stop-loss orders to limit potential losses and set profit-taking points. Diversify your holdings across different renewable sectors (solar, wind, etc.) to spread risk and protect your investment.
7. Stay Informed and Updated
Regularly track market trends, news, and developments in the renewable energy sector. Stay updated on policy changes, technological advancements, and other factors that could impact stock prices.
Why Renewable Energy Stocks Are Worth Watching
Renewable energy stocks have significant long-term growth potential due to several key factors:
Environmental Shift: Governments and organizations worldwide are increasingly committed to reducing carbon emissions, driving growth in clean energy sectors.
Technological Advancements: Innovations in energy storage, grid technologies, and solar and wind turbine efficiency are driving the renewable energy market forward.
Government Support: In many countries, renewable energy stocks benefit from incentives, tax breaks, and subsidies aimed at boosting clean energy production.
Global Trends: As more industries adopt sustainable practices, renewable energy will play an ever-growing role in powering economies globally.
In Summary
Investing or trading in renewable energy stocks provides an exciting opportunity as the sector continues to grow. With the rising demand for cleaner energy sources like solar, wind, and hydropower, leading companies in the sector are well-positioned for long-term growth. By understanding key trends and the major players in the market, you can stay ahead in this evolving industry and better identify the best renewable energy stocks to buy, increasing your chances of success in this fast-growing sector.
Start Trading Renewable Energy Stocks with VT Markets Today
Renewable energy stocks are shares in companies involved in the production or support of renewable energy sources such as wind, solar, or hydroelectric power.
2. What are the best renewable energy stocks to trade or invest in?
Some of the best renewable energy companies to invest in or trade include:
NextEra Energy (NEE)
Tesla (TSLA)
Brookfield Renewable Partners (BEP)
Enphase Energy (ENPH)
First Solar (FSLR)
Iberdrola (IBDRY)
Ormat Technologies (ORA)
Plug Power (PLUG)
Vestas Wind Systems (VWDRY)
Sunrun (RUN)
3. Why are renewable energy stocks a good investment?
Renewable energy stocks are a good investment because of the growing global demand for sustainable energy, government support, and technological innovations in the sector.
4. Are renewable energy stocks risky?
Like all stocks, renewable energy stocks come with risks. These risks include market volatility, regulatory changes, and technological advancements. However, the sector’s long-term growth potential due to the global shift toward cleaner energy makes it attractive for many investors.
5. How can I identify the best renewable energy stocks to buy in 2025?
To identify the best renewable energy stocks, look for companies with strong financials, solid growth in renewable energy markets, and positive future outlooks. Use both fundamental analysis to assess financial health and technical analysis for stock trends and price movements.
6. What are the top renewable energy trends to watch in 2025?
Key trends to watch include advances in energy storage technology, the expansion of offshore wind projects, the rise of hydrogen fuel, and increased adoption of electric vehicles, all of which could significantly impact renewable energy stocks.
7. Can I trade renewable energy stocks short-term, or is it a long-term investment?
You can trade renewable energy stocks both short-term and long-term. Short-term trading may focus on market fluctuations, while long-term investment in renewable energy stocks allows you to benefit from the sector’s growth over time.
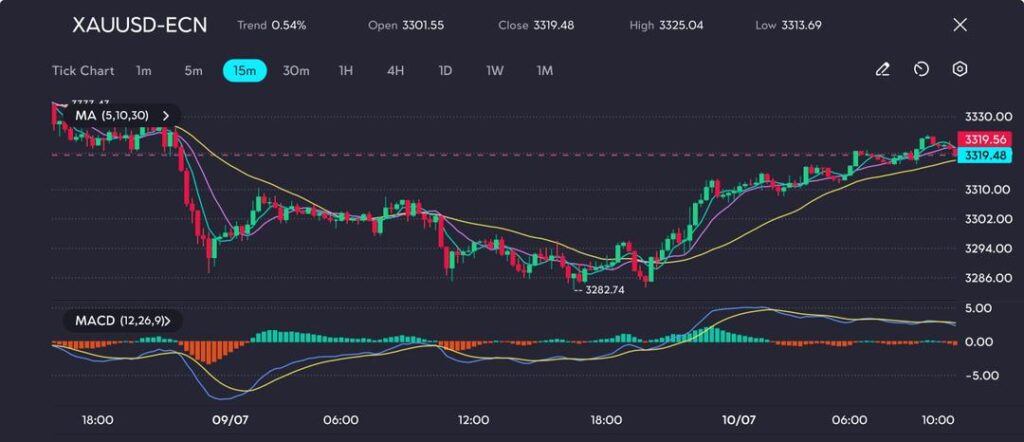
Gold is seeing a cautious rebound, supported by a softer US dollar and low Treasury yields. But with traders showing less concern over trade tensions, momentum remains limited. This analysis explores the key drivers behind gold’s recent moves.
Gold edges up as dollar eases
Gold prices edged slightly higher on Thursday, supported by a mild retreat in both the US dollar and Treasury yields.
However, gains remained limited as traders showed little reaction to the latest aggressive trade manoeuvres by former President Donald Trump.
Spot gold inched up by 0.3% to $3,322.46, while US gold futures advanced to $3,331, rebounding gradually from this week’s low of $3,282.74.
Despite ongoing geopolitical tensions, market momentum remained subdued – indicating a cautious investor stance.
Tariff headlines intensify, but market reaction dulls
Donald Trump accelerated his trade offensive, announcing fresh 50% tariffs on US copper imports and imposing new duties on Brazilian products, scheduled to take effect from 1 August.
Additionally, seven more nations were added to the growing list of tariff-targeted countries, joining the likes of Japan and South Korea.
Yet markets showed minimal response. Analysts attribute this to increasing “tariff fatigue” – a growing indifference among investors to continuous protectionist announcements, which now have a diminished influence on asset prices.
Technical analysis
Gold posted a modest rebound, closing at $3,319.48 with an intraday rise of 0.54%.
The price recovered from the session’s low of $3,282.74, and the chart pattern now shows a series of higher lows and highs, hinting at building bullish momentum.
Short-term moving averages (5-, 10-, and 30-period) are aligned in a bullish crossover, reinforcing the potential for further upside.
Picture: Gold recovers above 3315, but resistance looms near 3330, as seen on the VT Markets app.
Meanwhile, the MACD has shifted into positive territory above the zero line.
However, flattening histogram bars suggest waning momentum as prices approach a possible resistance zone near $3,325–$3,330 – a level that previously served as support and now presents a technical hurdle.
Fed minutes reveal cautious stance on rate cuts
The minutes from Wednesday’s Federal Reserve meeting revealed limited appetite for immediate rate cuts.
Only a few members supported easing as early as July, with most preferring to wait, citing inflation pressures linked to tariffs.
The upcoming FOMC meeting on 29–30 July may provide the next meaningful catalyst for the gold market.
Until then, gold is likely to trade within a narrow range, influenced more by technical signals and fluctuations in the US dollar than by headline-driven fear over escalating trade conflicts.
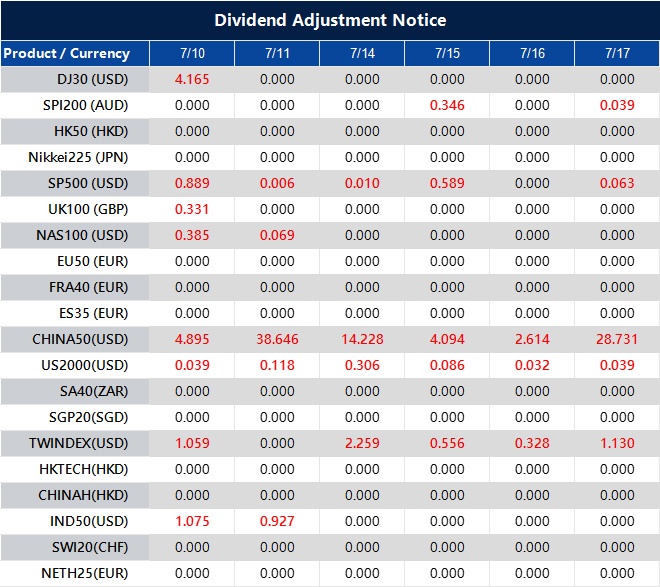
Please note that the dividends of the following products will be adjusted accordingly. Index dividends will be executed separately through a balance statement directly to your trading account, and the comment will be in the following format “Div & Product Name & Net Volume”.
Please refer to the table below for more details:
The above data is for reference only, please refer to the MT4/MT5 software for specific data.
If you’d like more information, please don’t hesitate to contact info@vtmarkets.com.
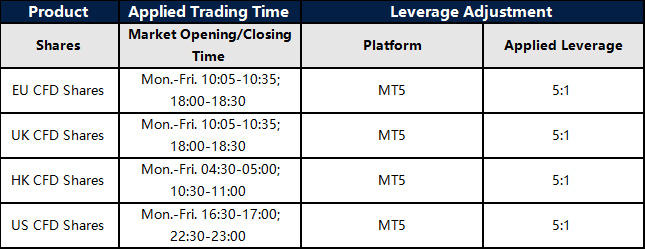
To provide a more stable trading environment for our clients and in light of the recent increase in stock market volatility, VT Markets will be adjusting the leverage settings for all Shares products.
Please refer to the details below for further information.
1. All US Shares products leverage will be adjusted to 20:1.
2. MT5 All Shares products: New positions opened within 30 minutes before market closing and after market opening will start with leverage of 5:1. After the mentioned period, the leverage will be resumed to original leverage and will not be adjusted back to 5:1.
MT4 will not be affected.
The above data is for reference only, please refer to the MT4 and MT5 software for specific data.
Friendly reminders:
1. All specifications for Shares CFD stay the same except leverage during the mentioned period.
2. The margin requirement of the trade may be affected by this adjustment. Please make sure the funds in your account are sufficient to hold the position before this adjustment.
If you’d like more information, please don’t hesitate to contact info@vtmarkets.com.
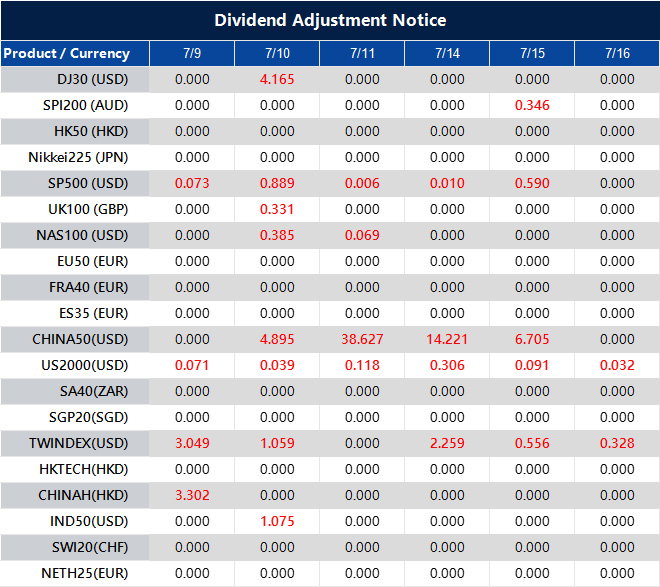
Please note that the dividends of the following products will be adjusted accordingly. Index dividends will be executed separately through a balance statement directly to your trading account, and the comment will be in the following format “Div & Product Name & Net Volume”.
Please refer to the table below for more details:
The above data is for reference only, please refer to the MT4/MT5 software for specific data.
If you’d like more information, please don’t hesitate to contact info@vtmarkets.com.
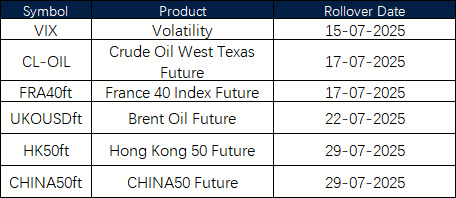
New contracts will automatically be rolled over as follows:
Please note:
• The rollover will be automatic, and any existing open positions will remain open.
• Positions that are open on the expiration date will be adjusted via a rollover charge or credit to reflect the price difference between the expiring and new contracts.
• To avoid CFD rollovers, clients can choose to close any open CFD positions prior to the expiration date.
• Please ensure that all take-profit and stop-loss settings are adjusted before the rollover occurs.
• All internal transfers for accounts under the same name will be prohibited during the first and last 30 minutes of the trading hours on the rollover dates.
If you’d like more information, please don’t hesitate to contact info@vtmarkets.com.
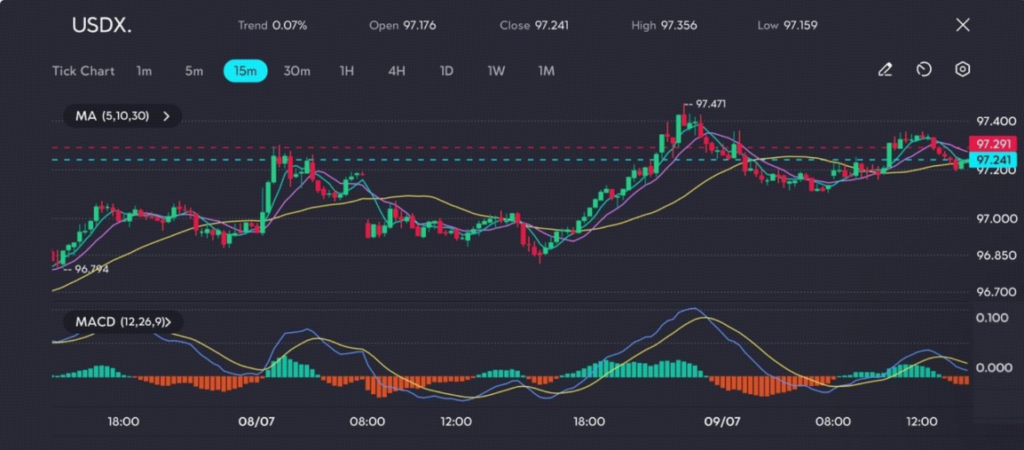
Markets remain cautious as the US ramps up trade tensions, with fresh tariffs and tough rhetoric driving sharp moves across currencies and commodities. The developments underscore how political shifts continue to influence global market dynamics and investor sentiment.
US dollar firms
The US dollar remains on a firm footing, trading at 97.241 at the time of writing, after touching an intraday high of 97.356.
The broader USD Index (USDX) rose to 97.602—its highest level since 25 June—driven by renewed trade tensions and strong language from President Trump regarding tariffs.
“The dollar has been a strong currency for the past 13 years, it’s been generally increasing or rallying, or appreciating against other currencies both in nominal terms and real terms since 2001,” Macquarie global FX & interest rates strategist Thierry Wizman says. pic.twitter.com/2uE9iGUDow
The most significant market mover came overnight, when Trump imposed a 50% tariff on copper imports. This announcement sparked a sharp 10% surge in US copper futures.
Copper, which plays a crucial role in electric vehicles, energy infrastructure, and military production, was already facing global supply constraints—adding further pressure to the market.
Meanwhile, copper prices dropped in London and Shanghai, as traders braced for potential disruptions in the supply chain and rushed shipments to the US ahead of the new tariff implementation.
The policy shift highlights how Trump’s evolving trade stance continues to impact both commodity markets and currency valuations globally.
Pharmaceuticals and semiconductors in the crosshairs
President Trump also signalled forthcoming tariffs on pharmaceutical goods and semiconductors—industries heavily reliant on East Asian exporters, particularly Japan and South Korea.
Both countries have been given a deadline of 1 August to negotiate separate trade deals or face substantial tariff increases.
On Monday, Trump referred to the deadline as “firm, but not 100% firm,” but reversed his tone on Tuesday, stating unequivocally that “no extensions will be granted.”
This hardline position rattled global markets, sending US futures slightly lower by 0.1%, while the S&P 500 spot index extended earlier losses, down 0.8% for the week.
Technical analysis: USDX at a turning point
From a technical standpoint, the US Dollar Index remains in a short-term consolidation phase, just below key resistance around 97.47, after rebounding from earlier lows near 96.79.
The price action is currently hovering around the 30-period moving average, having briefly gained momentum following a solid US jobs report (~147,000 jobs added), which temporarily boosted bullish sentiment.
Picture: Dollar finds footing above 97.20 as bulls eye breakout zone, as seen on the VT Markets app.
However, the upward move has since lost steam. The MACD histogram has flattened, and the short-term moving averages (5, 10, and 30 periods) are converging—indicating a potential slowdown in bullish momentum.
For upward continuation, a decisive break above the 97.40–97.47 range is critical.
A breakout here could set the stage for a test of 97.70, with 98.00 as the next resistance, assuming no significant macroeconomic headwinds emerge.
On the downside, a drop below key support around 97.15–97.20—which has been tested several times today—could increase the risk of a pullback toward 96.80, and potentially down to 96.50 if selling pressure persists.


 | VT Markets")

 | VT Markets")