Moving averages (MA) are essential tools in trading, helping traders identify trends and potential reversals by smoothing out price data. This article explores the different types of moving averages, including Simple Moving Average (SMA), Exponential Moving Average (EMA), and Weighted Moving Average (WMA), how to calculate them, and how they can be applied in trading strategies, along with their advantages, disadvantages, and common mistakes to avoid.
What Is a Moving Average (MA)?
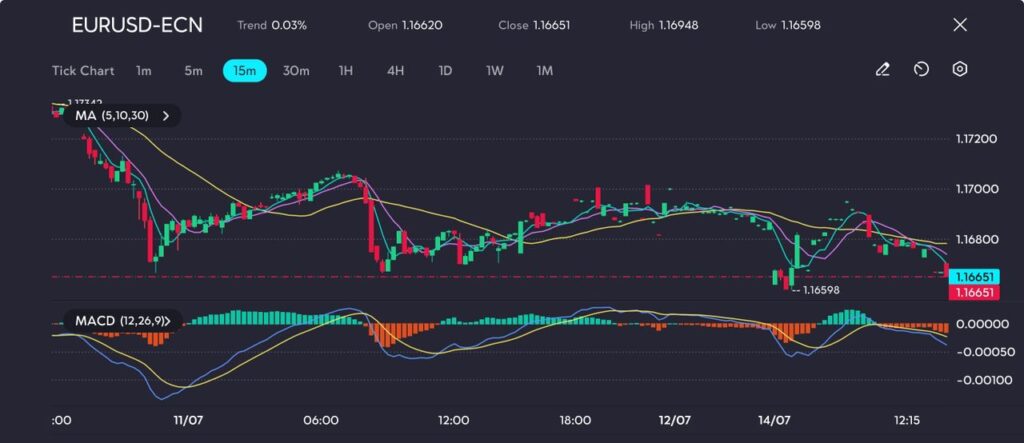
A moving average (MA) is a widely used technical analysis tool that smooths price data to create a trend-following indicator. It helps identify trend directions and potential reversal points in financial markets such as forex, stocks, and precious metals. By removing market noise, a moving average allows traders to better visualize trends in an asset’s price movement over a specified period.
A moving average is calculated by averaging the prices of an asset over a certain time frame, providing a smoother version of the price chart. This gives traders a better understanding of the prevailing trend, whether it’s upward, downward, or sideways.
Types of Moving Averages
There are several types of moving averages, each with its unique calculation method and application:
1. Simple Moving Average (SMA)
The Simple Moving Average (SMA) is the most basic type of moving average. It calculates the average of an asset’s price over a specified number of periods, making it easy to follow trends over time. The SMA provides a clear picture of an asset’s historical price movement but is less responsive to recent changes.
Example: A 5-day SMA averages the closing prices of the last 5 days. If the prices for the past 5 days are $10, $12, $14, $13, and $15, the SMA would be ($10 + $12 + $14 + $13 + $15) / 5 = $12.8. This gives a clearer view of the asset’s average price over the past five days, effectively smoothing out short-term volatility.
2. Exponential Moving Average (EMA)
The Exponential Moving Average (EMA) places greater weight on more recent prices, making it more responsive to recent market changes. This feature is especially useful for traders who want to capture price movements more quickly, such as after major news or announcements.
Example: If a stock price suddenly jumps following an earnings report, the EMA would react more quickly than the SMA, providing a more accurate signal of the change in trend.
3. Weighted Moving Average (WMA)
The Weighted Moving Average (WMA) assigns different weights to each price in the time period, with more recent prices given higher weight. This allows it to give more importance to the latest price action, making it more adaptable to quick shifts in market conditions compared to the SMA.
Example: A 5-day WMA might give a weight of 5 to the most recent closing price, 4 to the second most recent, and so on. This method places more emphasis on the current price, providing a more responsive moving average than the SMA.
How to Calculate Moving Average
Follow the steps below to calculate each type of moving average:
1. Simple Moving Average (SMA):
The Simple Moving Average (SMA) is calculated by summing the closing prices of an asset over a specific number of periods (N) and then dividing by N. This gives you the average price over that period. The SMA is widely used because of its simplicity and effectiveness in identifying trends by smoothing out daily price fluctuations.
Formula:
SMA = (Sum of Closing Prices over N periods) / N
Example:
To calculate a 5-day SMA, sum the closing prices of the last five days and divide by 5.
Let’s say the closing prices for the last 5 days are:
- Day 1: $10
- Day 2: $12
- Day 3: $14
- Day 4: $13
- Day 5: $15
SMA = (10 + 12 + 14 + 13 + 15) / 5 = 12.8
This means the average price of the asset over the last five days is $12.8.
2. Exponential Moving Average (EMA):
The Exponential Moving Average (EMA) gives more weight to recent prices, making it more responsive to price changes compared to the Simple Moving Average (SMA). The smoothing factor (α) is calculated based on the number of periods (N) and helps the EMA adjust more quickly to recent price movements.
The formula multiplies today’s price by the smoothing factor (α) and adds it to yesterday’s EMA, adjusted by (1 − α).
Formula:
EMA today = (Price today × α) + (EMA yesterday × (1 − α))
Where:
α = 2 / (N + 1)
(N is the number of periods, such as 3 days or 14 days.)
Example:
Let’s calculate a 3-day EMA with the following data:
- Day 1: Price = $10
- Day 2: Price = $12
- Day 3: Price = $14
- Day 4: Price = $13 (This is the Price today)
Step 1: First, calculate the 3-day SMA (used as the starting point for EMA):
SMA = (10 + 12 + 14) / 3 = 12
So, the SMA for Day 3 is $12, which will be used as the initial EMA yesterday.
Step 2: Calculate the smoothing factor (α):
α = 2 / (3 + 1) = 2 / 4 = 0.5
Step 3: Now, calculate the EMA for Day 4 using the formula:
EMA for Day 4 = (13 × 0.5) + (12 × (1 − 0.5)) = 6.5 + 6 = 12.5
So, the 3-day EMA for Day 4 is $12.5.
3. Weighted Moving Average (WMA):
The Weighted Moving Average (WMA) assigns different weights to each price in the time period. More recent prices receive higher weights, making it more responsive to recent market conditions compared to the SMA. This allows the WMA to give more importance to the latest price action, making it a useful tool in markets with frequent price fluctuations.
Formula:
WMA = Sum of (Price × Weight for each period) / Sum of all weights
Example:
For a 5-day WMA, use the following data with respective weights:
- Day 1: $10 (Weight = 1)
- Day 2: $12 (Weight = 2)
- Day 3: $14 (Weight = 3)
- Day 4: $13 (Weight = 4)
- Day 5: $15 (Weight = 5)
WMA = (10 × 1) + (12 × 2) + (14 × 3) + (13 × 4) + (15 × 5) / (1 + 2 + 3 + 4 + 5) = 205 / 15 = 13.53
So, the 5-day WMA is $13.53.
How Moving Averages Are Used in Trading
Moving averages are essential for traders to identify trends, entry points, and exit points. They simplify the process of spotting market directions and potential reversals. Here’s how moving averages are commonly used in trading:
1. Trend Identification
A moving average helps determine the prevailing trend by smoothing out price fluctuations over time. A rising moving average indicates an uptrend, while a falling moving average suggests a downtrend. Traders often use moving averages to confirm the direction of the market and to identify trends early on.
Example: In the stock market, the 50-day Simple Moving Average (SMA) is often used to confirm an uptrend when it’s above the 200-day SMA, signaling a bullish trend. Conversely, when the 50-day SMA falls below the 200-day SMA, it signals a bearish trend, known as a “death cross.” For instance, in 2024, Apple Inc. (AAPL) experienced a Golden Cross when the 50-day SMA crossed above the 200-day SMA, signaling a strong upward movement in the stock price, which attracted buyers. This bullish signal helped traders identify a good buying opportunity as the stock continued to climb throughout the year.
2. Support and Resistance
Moving averages can act as dynamic support or resistance levels. When the price is above the moving average, it can serve as a support level, with the price bouncing back when it drops to the moving average. Conversely, when the price is below the moving average, it can act as resistance, with the price failing to move higher when it approaches the moving average.
Example: In Forex trading, many traders use the 200-day moving average as a key indicator of support or resistance. “For example, the major currency pair, EUR/USD, often uses the 200-day moving average to determine the strength of a trend. In 2020, during a period of consolidation, the EUR/USD repeatedly tested and bounced off the 200-day moving average as support, indicating that the long-term uptrend remained intact.
3. Crossovers
A popular trading strategy uses the crossover of two moving averages. When a short-term moving average (like the 50-day) crosses above a longer-term moving average (like the 200-day), it signals a buy opportunity (bullish crossover). When the reverse occurs, and the short-term moving average crosses below the long-term moving average, it signals a sell opportunity (bearish crossover).
Example: A Golden Cross and a Death Cross are prime examples of this crossover strategy. In July 2024, Tesla (TSLA) saw a Golden Cross when its 50-day EMA crossed above the 200-day EMA. This crossover signaled a potential buying opportunity for traders, as it indicated an upcoming bullish trend.
Advantages and Disadvantages of Moving Averages
Moving averages are powerful tools in technical analysis, offering several benefits to traders, but they also come with limitations. Understanding both the advantages and disadvantages of using moving averages can help traders effectively incorporate them into their strategies while minimizing potential pitfalls.
Advantages:
- Trend-following Ability: Moving averages help traders stay aligned with the prevailing trend, potentially increasing the probability of success.
- Simplicity: They are easy to understand and implement, making them suitable for traders at all levels.
- Helps Identify Market Sentiment: Moving averages can help identify whether the market is in a bullish or bearish phase.
Disadvantages:
- Lagging Indicator: Moving averages are lagging indicators, meaning they react to price changes after they occur. This can cause delayed entry or exit signals.
- Not Effective in Sideways Markets: In sideways or range-bound markets, moving averages may generate misleading signals.
- Dependence on Time Period: The effectiveness of moving averages can vary depending on the time period chosen. Short periods are more sensitive, while long periods are more stable but less responsive to quick price movements.
Common Mistakes to Avoid When Using Moving Averages
While moving averages are widely used in trading, there are common mistakes that traders often make when relying on them. Understanding these pitfalls and learning how to avoid them can help traders maximize the effectiveness of moving averages and improve their trading decisions.
- Over-relying on Moving Averages: Never use moving averages in isolation. It’s important to combine them with other indicators, such as RSI or MACD, to confirm signals and increase the accuracy of your analysis.
- Using Only One Time Frame: Relying on moving averages from a single time frame can lead to inaccurate decisions. It’s crucial to analyze multiple time frames to gain a more comprehensive view of the market.
- Ignoring Market Conditions: Moving averages work best in trending markets. In sideways or range-bound markets, they can produce false signals. Understanding market conditions is key to using moving averages effectively.
- Choosing the Wrong Period: Using too short a moving average period can result in frequent whipsaws, while a period that is too long may miss timely signals. Choose the period length based on your trading strategy and the volatility of the asset.
In Summary
A moving average is a key tool that helps traders identify trends by smoothing out price fluctuations. This makes it easier to identify trends, potential reversal points, and ideal entry or exit opportunities. Whether you use a Simple Moving Average (SMA), Exponential Moving Average (EMA), or Weighted Moving Average (WMA), understanding how to apply these tools effectively can greatly enhance your trading strategy and market analysis.
Put Your Knowledge into Practice with VT Markets
Now that you have an understanding of moving averages, why not put your knowledge into practice? At VT Markets, we offer a user-friendly platform and access to advanced trading tools through MetaTrader 4 (MT4) and MetaTrader 5 (MT5), where you can seamlessly incorporate moving averages into your trading strategies. You can also explore our Help Centre for guidance, open a demo account to practice risk-free, and begin using moving averages in real-time.
Open an account with VT Markets and start enhancing your trading skills today!
Frequently Asked Questions (FAQs)
1. What is a moving average?
A moving average is a technical indicator that smooths out price data to identify trends over a specified period.
2. How do you calculate a moving average?
A moving average is calculated by averaging the closing prices of an asset over a set number of periods. The calculation differs slightly depending on whether it is a Simple Moving Average (SMA), Exponential Moving Average (EMA), or Weighted Moving Average (WMA).
3. What is the difference between SMA and EMA?
The main difference is that an EMA gives more weight to recent prices, making it more responsive to price movements than the SMA.
4. Can moving averages predict future prices?
While moving averages help identify trends, they cannot predict future price movements. They are a lagging indicator, reacting to price changes after they occur.
5. Which moving average is best for day trading?
Shorter-period moving averages, such as the 9-day or 20-day SMA/EMA, are commonly used by day traders to capture short-term price movements.
6. How do moving averages help identify trends?
Moving averages help identify the direction of a trend by smoothing out price fluctuations over a specific time period. If the price is above the moving average, it indicates an uptrend, and if it’s below, it indicates a downtrend.
7. What is a moving average crossover?
A moving average crossover occurs when a shorter-term moving average crosses above or below a longer-term moving average. A crossover above suggests a potential buy signal (bullish), while a crossover below suggests a potential sell signal (bearish).
8. Can I use moving averages for both short-term and long-term trading?
Yes, moving averages can be used for both short-term trading and long-term trading. Short-term traders may use faster moving averages (e.g., 9-day), while long-term traders may use slower moving averages (e.g., 200-day) to track broader trends.
9. How do I choose the right period for a moving average?
The right period for a moving average depends on your trading strategy and time frame. Shorter periods (e.g., 5-day or 10-day) are better for capturing quick price movements, while longer periods (e.g., 50-day or 200-day) provide a broader perspective on long-term trends.
10. How do I use moving averages in combination with other indicators?
Moving averages can be combined with other indicators, such as RSI or MACD, to confirm signals. For example, if a moving average crossover occurs along with an RSI indicating overbought conditions, it strengthens the validity of the signal.


 | VT Markets")


 | VT Markets")