Moving averages are essential tools in technical analysis, helping traders identify trend direction and key price levels. The two most common types—Simple Moving Average (SMA) and Exponential Moving Average (EMA)—use similar principles but respond differently to price changes. In this article, we explain the difference between simple moving average and exponential moving average and guide you on when to use each.
What Is a Simple Moving Average (SMA)?
A Simple Moving Average (SMA) is one of the most fundamental tools in technical analysis. It calculates the average price of an asset over a specific number of periods, giving equal weight to each price point. For example, a 10-day SMA adds the closing prices of the past 10 days and divides the total by 10. This line helps traders smooth out market noise and identify long-term trends.
Example: Imagine you’re tracking Apple stock (AAPL). If the 50-day SMA is steadily rising and price remains above it, this indicates a sustained uptrend. Many long-term investors rely on the 200-day SMA to spot major market shifts or reversals.
What Is an Exponential Moving Average (EMA)?
An Exponential Moving Average (EMA) also measures the average price over a selected period, but it gives more importance to recent prices. This weighting makes the EMA more responsive to current price movements. The formula includes a smoothing factor, which adjusts the sensitivity of the average. The shorter the period, the more reactive the EMA becomes.
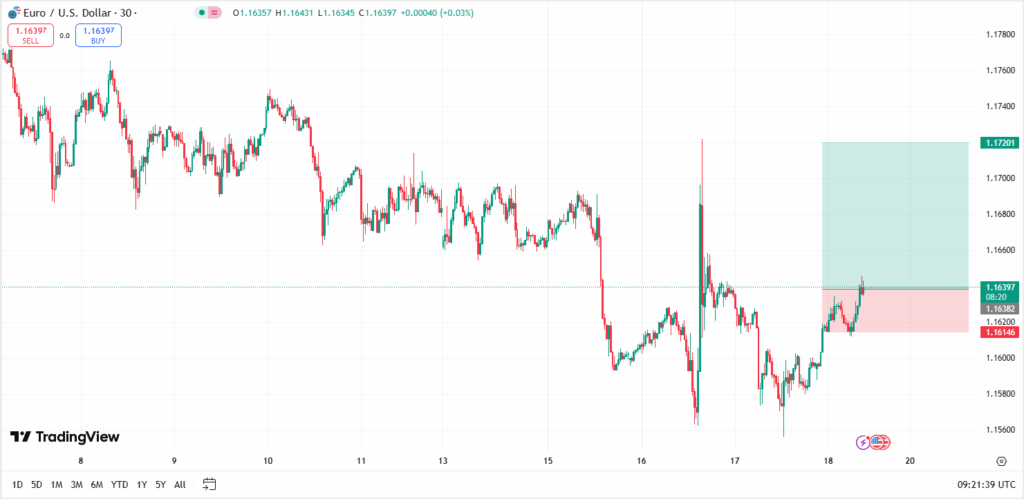
Example: A swing trader monitoring the major currency pair EUR/USD may use a 20-day EMA to capture short-term momentum. When price pulls back to the EMA and rebounds, it can signal a buying opportunity in an ongoing trend.
EMA vs SMA: Key Differences
Understanding the difference between a simple moving average and an exponential moving average is essential for selecting the right tool for your trading strategy.
| Feature | Simple Moving Average (SMA) | Exponential Moving Average (EMA) |
| Calculation Method | Equal weight for all periods | More weight to recent prices |
| Responsiveness | Slower, less sensitive | Faster, more responsive |
| Lag Time | Higher lag due to equal weighting across all periods | Lower lag due to more emphasis on recent prices |
| Best for | Long-term trend analysis | Short-term trading signals |
| Reaction to Volatility | Smooths out price action | Reacts quickly to new price data |
| Noise Filtering | Better at filtering out short-term fluctuations | May respond to minor, insignificant price changes |
| Suitability for Beginners | Easier to understand and apply | Requires a better understanding of price weighting |
| Use in Popular Indicators | Commonly used in Bollinger Bands and MA crossovers | Core component of MACD and other momentum indicators |
1. Calculation Method
SMA: The Simple Moving Average assigns equal weight to all data points within the selected period. This method is simple and easy to apply, but slower to react to recent price shifts.
EMA: The Exponential Moving Average applies greater weight to more recent data points, making it more responsive to current market conditions and price changes.
2. Responsiveness
SMA: SMA reacts more slowly to price movements, making it better for identifying stable, longer-term trends without being influenced by short-term fluctuations.
EMA: EMA adjusts quickly to price movements, allowing traders to catch momentum shifts or reversals earlier, especially in active or volatile markets.
3. Best for
SMA: Best used for long-term trend analysis and spotting major levels of support or resistance in relatively stable market conditions.
EMA: Favoured by short-term or swing traders who require faster trading signals for timely entries and exits.
4. Reaction to Volatility
SMA: Provides a smoother line that filters out erratic price spikes, helping traders maintain focus on the underlying trend during periods of high volatility.
EMA: Due to its sensitivity, EMA may react more dramatically to sudden price changes, which can lead to faster—but sometimes less reliable—signals.
5. Lag Time
SMA: Has a higher lag because it treats all price data equally, which can delay recognition of market turning points.
EMA: Shows less lag by prioritizing recent price action, helping traders respond to changes more quickly.
6. Noise Filtering
SMA: More effective at filtering out short-term price noise, making it easier to identify the broader market direction.
EMA: While quick to react, EMA may also reflect minor fluctuations that are not significant to the larger trend.
7. Suitability for Beginners
SMA: Straightforward to calculate and interpret, making it ideal for beginner traders who are just learning technical analysis.
EMA: Slightly more complex due to its weighting mechanism, but provides more advanced insight for traders with some experience.
8. Use in Popular Indicators
SMA: Commonly used in tools like Bollinger Bands or moving average crossovers for trend confirmation.
EMA: Serves as the foundation of momentum-based indicators such as the Moving Average Convergence Divergence (MACD), which relies on quick reaction to price shifts.
Advantages and Disadvantages of EMA and SMA
Both the simple moving average and the exponential moving average offer unique benefits and drawbacks:
Simple Moving Average (SMA) Advantages:
- Simple and easy to use: A straightforward formula makes it beginner-friendly.
- Good at filtering market noise: Smooths out erratic price movements in trending markets.
- Reliable for long-term trends: Commonly used for support/resistance on higher timeframes (e.g., 200-day SMA).
Simple Moving Average (SMA) Disadvantages:
- Slow to react: Equal weighting causes a delayed response to price shifts.
- Can miss quick reversals: May still reflect old trends after the market has changed direction.
Exponential Moving Average (EMA) Advantages:
- More responsive: Reacts quickly to recent price movements due to the weighted formula.
- Better for short-term trading: Favoured by scalpers and day traders needing faster signals.
- Effective in volatile markets: Captures momentum in fast-moving assets like forex or crypto.
Discover the 10 most volatile forex pairs to watch and trade.
Exponential Moving Average (EMA) Disadvantages:
- Prone to false signals: Sensitive to price spikes in sideways or choppy conditions.
- Requires tuning: Needs careful adjustment of settings to suit your strategy and asset class.
When Should You Use SMA or EMA?
Your choice depends on your trading style, asset class, and timeframe.
Use Simple Moving Average (SMA) when:
- You’re a long-term trader or investor: SMA provides stable signals that help identify major market trends.
- You prefer smoother signals: It’s slower reaction filters out short-term noise, making it ideal for steady trend confirmation.
- You’re focusing on key levels: Commonly used for identifying long-term support or resistance, especially the 100-day or 200-day SMA.
Example: A stock investor might use the 200-day SMA on Microsoft (MSFT) to determine whether the stock remains in a long-term uptrend before entering a position.
Use Exponential Moving Average (EMA) when:
- You’re a short-term or swing trader: EMA reacts quickly to price action, making it useful for faster trade decisions.
- You need early entry and exit signals: Their responsiveness helps capture momentum shifts as they develop.
- You’re trading volatile instruments: Ideal for forex, precious metals, or indices where speed matters in capturing breakouts or reversals.
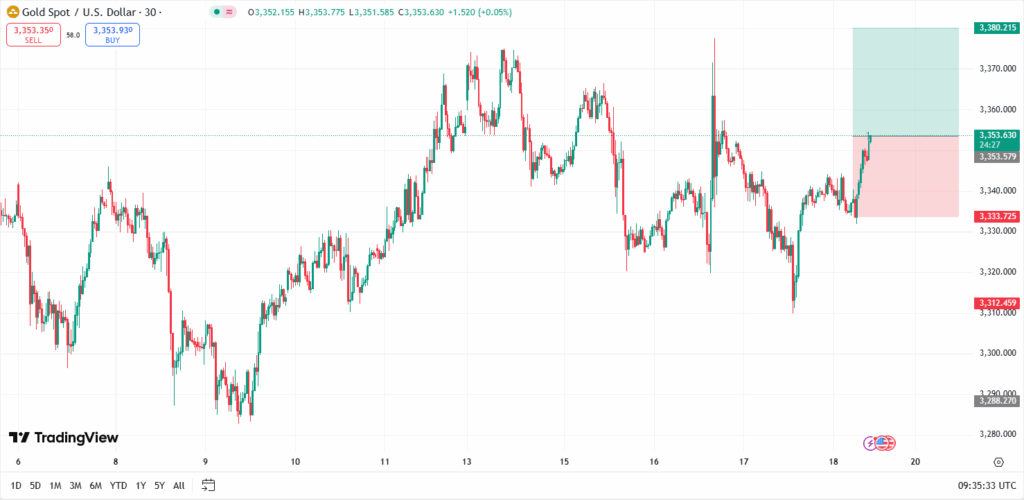
Example: A trader using the 20 EMA on the 15-minute chart of XAUUSD (gold) may identify intraday reversals earlier than one using a 1-hour SMA, gaining a timing edge in volatile conditions.
In Summary
The key difference between simple moving average and exponential moving average is how they respond to price changes, while SMA offers smoother, slower signals suited for long-term trends, while EMA reacts faster and is ideal for short-term trading. Your choice depends on your strategy and market conditions, and many traders combine both to balance stability with responsiveness.
Start Trading with Moving Averages on VT Markets
At VT Markets, we provide the tools you need to apply SMA and EMA strategies across forex, indices, commodities, and crypto. Whether you prefer MetaTrader 4 (MT4), MetaTrader 5 (MT5), or our own proprietary platform, you’ll get:
- Real-time charting tools to plot moving averages
- Flexible timeframes from 1-minute to monthly views
- Access to the VT Markets demo account to test your strategies risk-free
- Transparent, competitive spreads across major instruments
- 24/5 support through our Help Centre for platform and trading guidance
Create an account and join VT Markets today, and refine your trading using powerful tools like the EMA and SMA.
Frequently Asked Questions (FAQs)
1. What is the difference between simple moving average and exponential moving average?
The main difference is that SMA gives equal weight to all prices in a period, while EMA gives more weight to recent prices, making it more responsive to current market movements.
2. Can I use both EMA and SMA at the same time?
Yes, many traders use both for confirmation. For example, a crossover of a short-term EMA above a long-term SMA can signal a trend change.
3. Which moving average is better for day trading?
The EMA is generally preferred for day trading due to its responsiveness to recent price movements.
4. Are moving averages accurate in volatile markets?
EMAs are more suitable in volatile conditions. Combining them with indicators like RSI or MACD can improve accuracy, but no indicator guarantees results.
5. Can moving averages be used for all asset classes?
Yes, moving averages are widely used across various markets, including forex, stocks, indices, commodities, and cryptocurrencies. The logic behind them remains the same, though ideal settings may vary by asset type and volatility.
6. How do I choose the right period for a moving average?
It depends on your trading style and timeframe. Short-term traders may use 9, 12, or 20-period MAs, while long-term traders often prefer 50, 100, or 200-period MAs. Backtesting different settings on your target asset can help you fine-tune your approach.
7. What is a moving average crossover strategy?
This involves using two moving averages—one short-term and one long-term. A bullish crossover occurs when the short-term MA crosses above the long-term MA, suggesting upward momentum. A bearish crossover signals the opposite.
8. When should I use SMA vs EMA?
Use SMA for long-term trend analysis and smoother signals in stable markets. Use EMA when you need faster responses in short-term or volatile trading environments. Choosing the right one depends on your strategy and timeframe.
 | VT Markets")

 | VT Markets")

 | VT Markets")

 | VT Markets")