Sterling faces renewed pressure as bond market swings, fiscal uncertainty, and political shifts test investor confidence. Traders are watching to see whether the pound can steady or slide further.
Pound hit by debt concerns
The British pound dropped more than 1% on Tuesday, sliding to $1.3422, as a sharp selloff in UK government bonds pushed 30-year gilt yields to their highest level since 1998.
The move has reignited market concerns over the UK’s fiscal outlook and its ability to keep public debt under control.
Buffeted by this year’s surge in sterling and the slide in the dollar, British companies are upping their protection against foreign-exchange swings https://t.co/4eufNzflJP
While the downturn in gilts mirrored the broader global bond market repricing, sterling’s sharpest one-day fall since June has underscored the UK’s fragility.
Chancellor Rachel Reeves is expected to announce tax hikes in the autumn budget in a bid to meet fiscal rules, a move that could weigh on economic growth.
With the UK economy showing signs of life, most economists believe British finance minister Rachel Reeves will deliver a fiscally prudent budget, but tax rises are inevitable pic.twitter.com/Y0NzSTFrgL
At the same time, Prime Minister Keir Starmer reshuffled his cabinet this week in preparation for what is expected to be a challenging close to the year.
Rabobank strategist Jane Foley noted that although revised Bank of England expectations supported sterling last month, fiscal headwinds tied to the autumn budget may continue to limit gains.
Are fears over the dollar's demise overblown? Jane Foley from Rabobank told Reuters that a lot of the factors that created pressure on the currency earlier have now been 'downgraded' pic.twitter.com/ZAmfaYox4X
The UK is not alone in facing scrutiny. In France, 30-year bond yields surged to their highest level in over 16 years, with Prime Minister François Bayrou working to prevent a potential government collapse.
Technical analysis
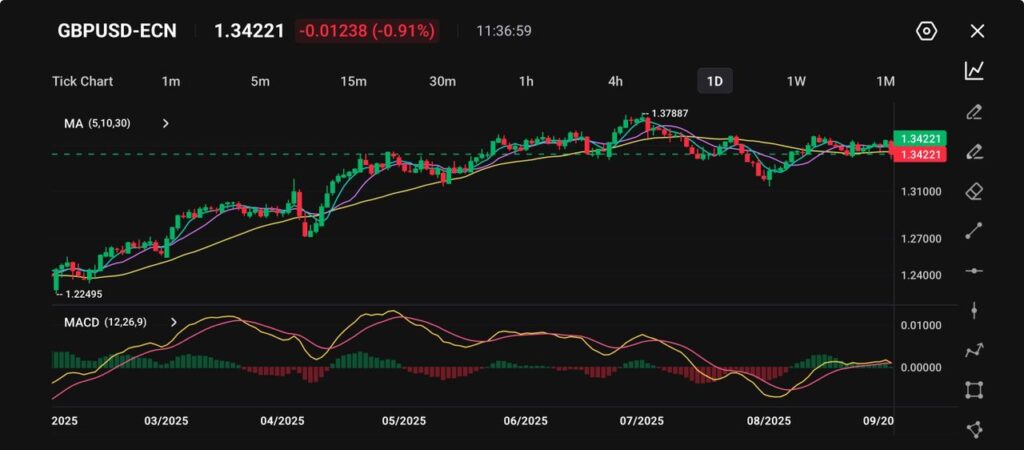
Since touching February’s low near 1.2250, GBP/USD has maintained an upward trajectory, climbing steadily to a July peak of 1.3788 before retreating.
The pair is now trading around 1.3422, still holding above the key 1.3300 support zone.
Picture: GBPUSD-ECN trades at 1.34221, down 0.91% from its recent high as it shown on the VT Markets app.
Short-term moving averages (5, 10, and 30) are levelling off, signalling a consolidation phase.
Meanwhile, the MACD has eased back to hover near the zero line, reflecting a loss of momentum compared with earlier in the year.
Immediate resistance is seen at 1.3550–1.3600, with a break higher paving the way for a retest of July’s 1.3788 high.
On the downside, support remains at 1.3300, with the risk of a deeper move toward 1.3100 if that level gives way.
For now, GBP/USD appears range-bound, with direction likely to be shaped by US inflation figures, Federal Reserve policy signals, and upcoming UK growth data.
Cautious forecast
If fiscal concerns intensify and gilt yields stay elevated, GBP/USD could retest the 1.3300 threshold in the near term.
A sustained break below this level may extend losses toward 1.3100, which would mark a significant reversal from the summer rally.
Such a move could also dent investor confidence further, especially if global risk sentiment remains fragile.
However, stronger signs of fiscal discipline in Rachel Reeves’ autumn budget could provide a stabilising effect.
Clear measures to contain debt levels may help the pound recover, with a rebound towards 1.3550 becoming more likely.
In addition, any supportive developments from the Bank of England – such as firmer guidance on interest rates – could limit sterling’s downside.
Overall, traders should expect heightened volatility in the months ahead, with GBP/USD likely to remain highly sensitive to both UK fiscal signals and broader global market dynamics.
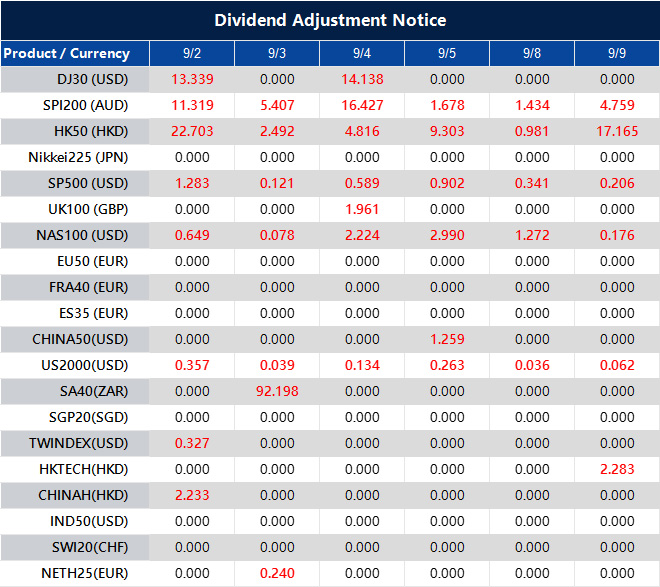
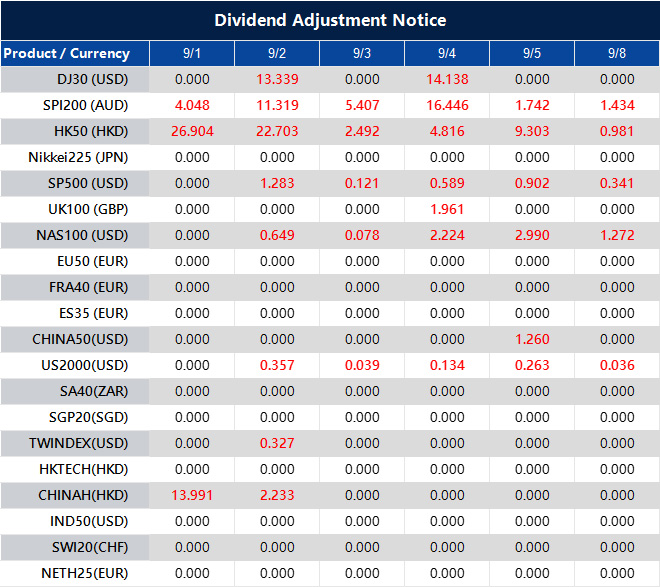
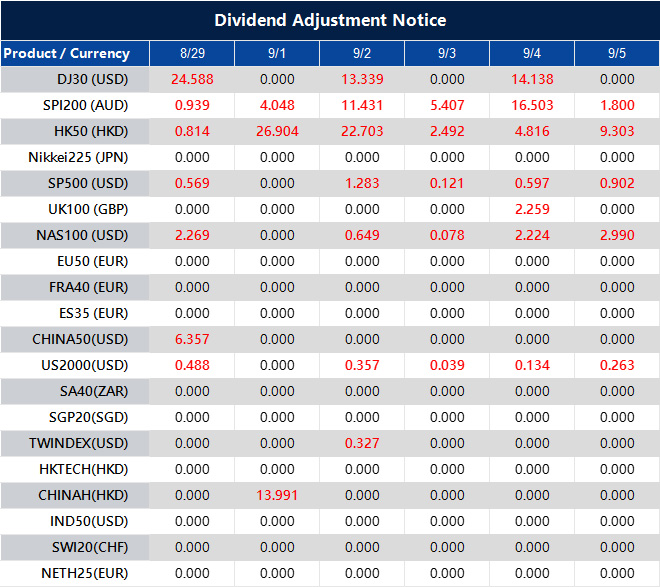
Please note that the dividends of the following products will be adjusted accordingly. Index dividends will be executed separately through a balance statement directly to your trading account, and the comment will be in the following format “Div & Product Name & Net Volume”.
Please refer to the table below for more details:
The above data is for reference only, please refer to the MT4/MT5 software for specific data.
If you’d like more information, please don’t hesitate to contact info@vtmarkets.com.
Written on September 2, 2025 at 8:31 am, by anakin
Markets are weighing rising risks as a US court challenges Trump’s tariffs and the Fed signals a potential rate cut in September, while the ECB emphasises flexibility. Geopolitical tensions intensify with the Russia-Ukraine war, escalating Middle East conflicts, and Turkey cutting ties with Israel. Political shifts in Thailand and reaffirmed mandates in France add to market uncertainty, while Swiss gold remains resilient amid US pressure.
KEY INDICATORS
US inflation and market reaction
US inflation data came in line with forecasts, boosting bets on a September Fed rate cut.
Dollar slipped slightly; Dollar Index down 0.001% at 97.86.
10-year Treasury yield at 4.233%, 2-year yield at 3.625%.
Commodities
Gold rose 0.9% to USD 3,448/oz, marking the best monthly gain since April; silver increased 1.53% to USD 39.7/oz.
WTI fell 0.47% to USD 63.79, Brent down 0.35% to USD 67.38, marking the first monthly decline since April.
Long strategy: Buy on dips near 198.20 support, target 199.40 initially, extend towards 199.70, stop-loss below 198.20.
Short strategy: Consider tactical shorts on failed rallies near 199.40–199.70 resistance, target 198.60 initially, extend back to 198.20 if momentum builds.
Range trade: Buy near support and sell near resistance if price consolidates between 198.20–199.70.
Risk management: Keep stops tight given the overall bullish structure.
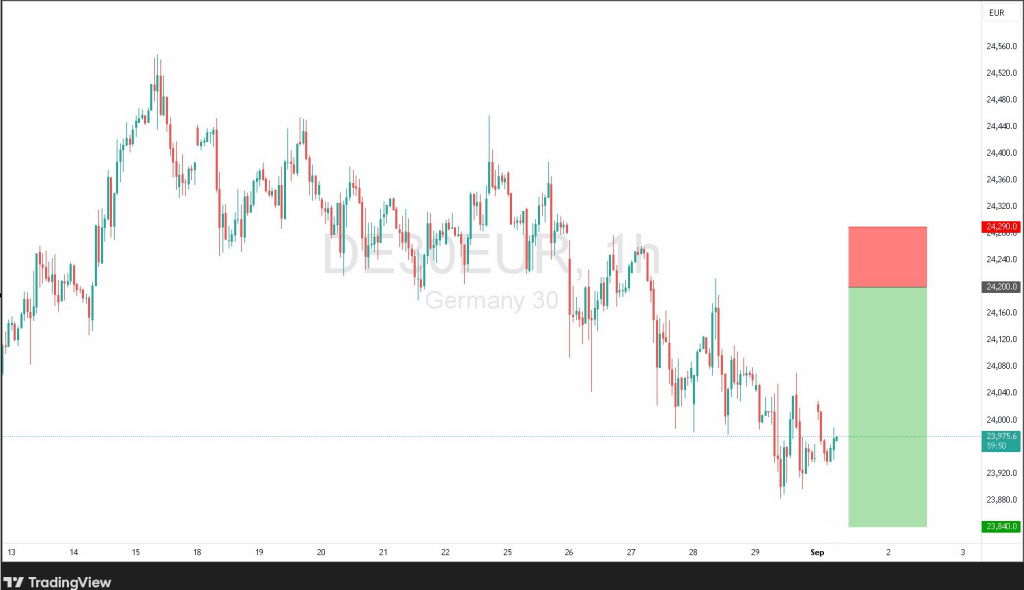
DAX 40 (Germany)
Primary trend: Bearish, with rallies into resistance likely to attract sellers and brief moves higher expected to be short-lived.
Long strategy: Consider tactical longs only on dips holding above key support, with targets likely limited given the broader bearish backdrop, stop-loss below support.
Short strategy: Sell on rallies towards 24,200 resistance, target 23,840 initially, extend towards 23,750 if momentum builds.
Range trade: Sell near the top of the range and buy near the base if price consolidates between 23,750–24,200.
Risk management: Keep stops tight given the bearish medium-term trend.
NEWS HEADLINES
US economic and policy updates
A US court rules Trump’s tariffs illegal, but he insists the measures will remain in effect, highlighting ongoing trade uncertainty.
Fed officials signal a September rate cut as July Core PCE reaches 2.9%, amid tensions over their economic mandate and market expectations.
The Fed finalises new big-bank capital rules, with Morgan Stanley seeking a review, while a judge delays ruling on Cook’s removal, keeping her in place.
Trump cancels USD 5bn in foreign aid and advances plans to rename the “War Department”, while the Texas governor signs a new congressional map into law.
Geopolitical tensions
Zelensky pushes for deeper strikes in Ukraine as the EU pledges stronger support; heavy clashes continue in Donetsk, and Zelensky is scheduled to meet Trump with EU leaders.
The EU plans troop deployments, with France and Germany advocating secondary sanctions, as geopolitical pressure rises in the region.
Israel intensifies strikes in Gaza, killing senior figures including Hamas spokesman Abu Ubayda, while operations expand and the country considers West Bank annexation.
Turkey severs trade and closes its airspace to Israel, and Houthis target UN agencies, signalling escalation across the Middle East.
Europe and central banks
Macron commits to a full term and backs PM Bayrou in a confidence vote, reinforcing political stability in France.
The ECB keeps September policy decisions open, with Kocher stressing flexibility and Rehn warning that inflation risks remain on the downside, reflecting ongoing uncertainty in the Eurozone.
This week, markets focused on the Federal Reserve’s dovish signals and rising geopolitical tensions. Fed Governor Waller backed a 25 bps rate cut in September, with further easing likely over the next three to six months. However, political risks grew as Tim Cook sued Trump and named Powell as a defendant, raising questions about Fed independence.
KEY INDICATORS
Fed policy turning dovish, but political risks to independence are rising
Tim Cook filed a lawsuit against Trump over the dismissal controversy, with Powell also named as a defendant.
A Biden-nominated judge will hold a hearing this Friday, with the case expected to reach the Supreme Court.
Trump’s Fed nominee Milan is likely to be confirmed before the September decision.
Fed Governor Waller supports a 25 bps cut in September and expects further cuts over the next three to six months.
IMF official: Markets still trust Fed independence, but risks remain.
ECB’s Rehn: Trump’s pressure on the Fed’s independence could have major global consequences.
Trade tensions persist, limited signs of de-escalation
The EU proposes scrapping some US tariffs to secure lower car tariffs from Washington.
India’s Russian oil imports in September are expected to rise by 10–20% month-on-month despite US threats.
The US plans to impose flat parcel tariffs of $80–$200 within six months, later shifting to specific rates.
German Chancellor Merz: No meeting between Zelensky and Putin.
Europe proposes a 40 km frontline buffer zone.
Political and economic events
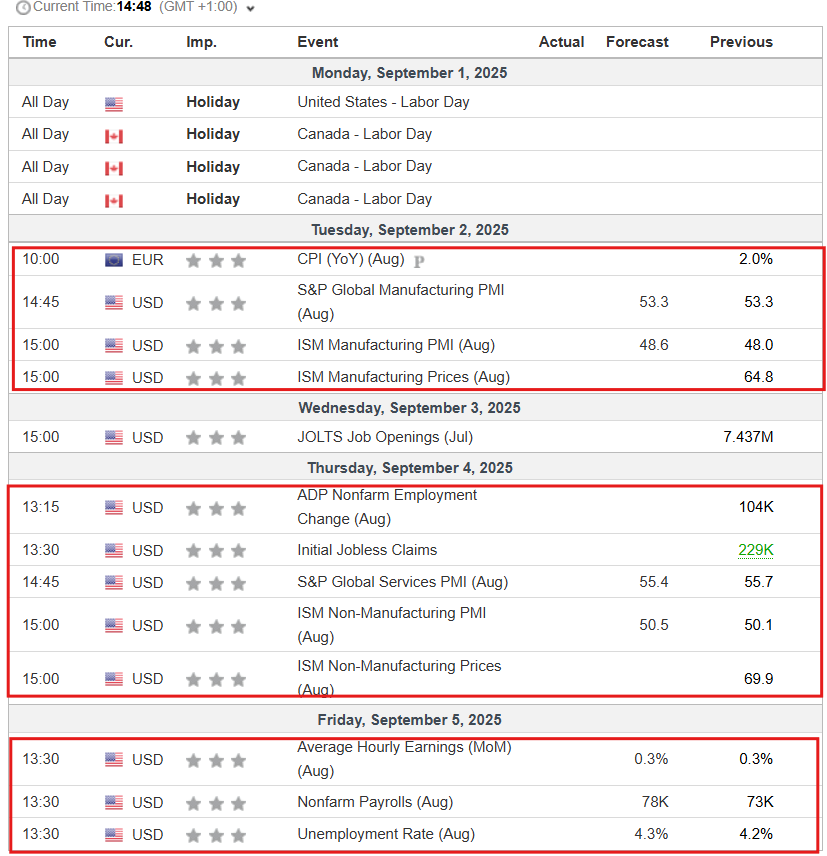
US non-farm payrolls report expected Friday, forecast at about 78,000 new jobs; weak data could push the Fed closer to rate cuts and is highly watched as a key labour market signal.
Fed Governor Waller backs rate cuts, expecting 125–150 bps over the next three to six months; markets price in a 75–85% chance of a September cut, with further easing likely in 2025.
Key economic releases this week include PMIs, ISM manufacturing, eurozone inflation, and Brazil GDP; data will gauge global growth and inflation pressures and may shift market sentiment ahead of payrolls.
Jim O’Neill named CDC head, prompting resignations and backlash; Trump ends Harris’s Secret Service protection, drawing official criticism.
European Council President António Costa visits multiple EU states on the EU “tour des capitales.”
SCO summit gathers 20+ world leaders; China highlights regional influence with North Korea, while Xi Jinping hosts Putin and Kim Jong-un at a Beijing military parade, signalling strengthened anti-US alliances in Asia.
MARKET MOVERS
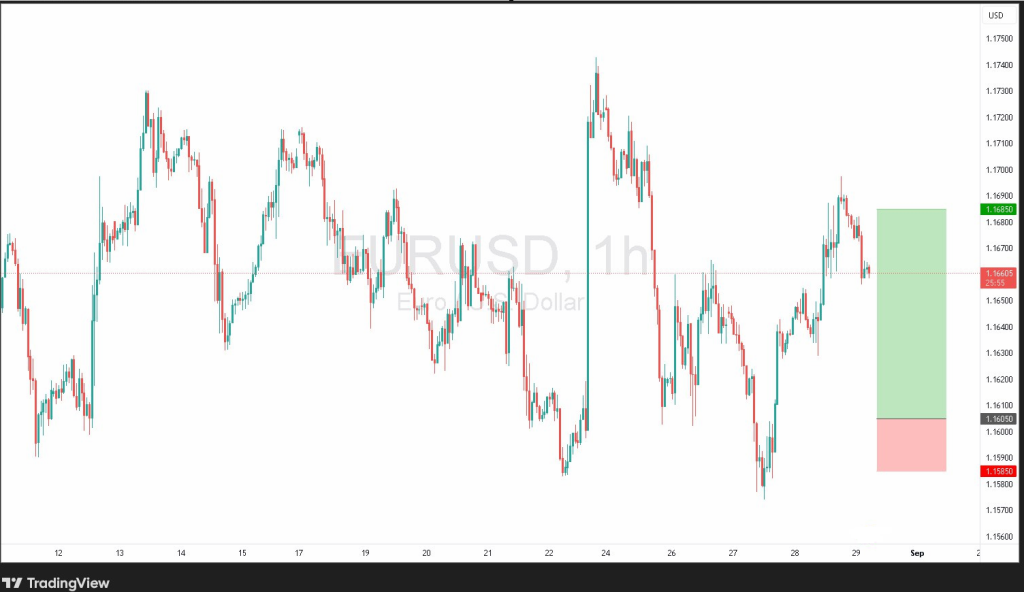
EUR/USD
Primary trend: Bullish, though a short pullback may test support
Support level: 1.1620 (secondary: 1.1580)
Resistance zone: 1.1680–1.1685
Long strategy: Buy on dips above 1.1620, target 1.1680–1.1685
Short strategy: Sell near resistance at 1.1685, target 1.1620 with potential extension towards 1.1580
Range trade: Buy near 1.1620 and sell near 1.1685 if price consolidates in this band
Risk management: Keep stops tight given the bearish bias
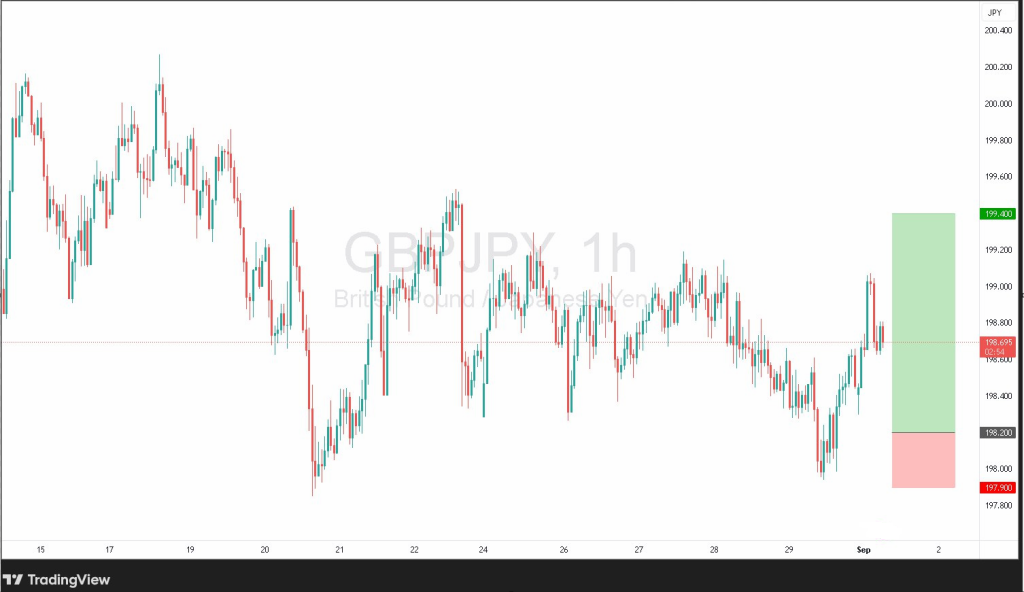
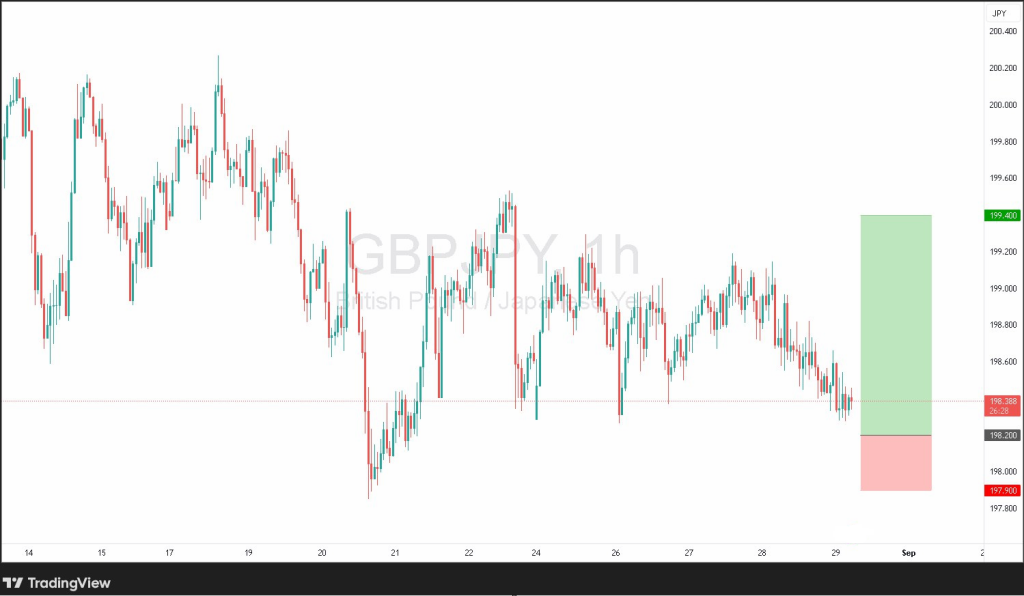
GBP/JPY
Primary trend: Bullish, with recent pullbacks showing signs of exhaustion
Support level: 198.20 (secondary: 198.20–198.70)
Resistance zone: 199.40–199.70
Long strategy: Buy on dips near 198.20, target 199.40 with potential extension to 199.70
Short strategy: Consider tactical shorts if price spikes into 199.40–199.70, target 198.70 with potential extension to 198.20
Range trade: Buy near 198.20 and sell near 199.70 if price consolidates in this band
Risk management: Use tight stops given prevailing bullish momentum
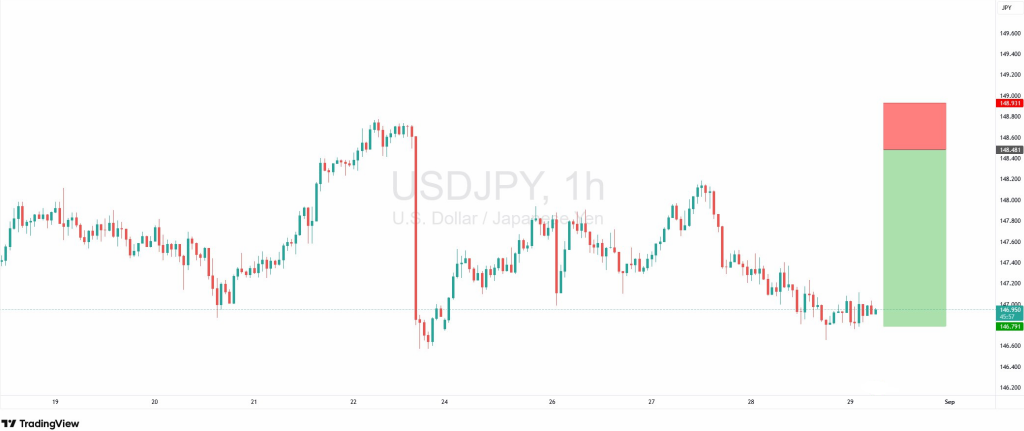
USD/JPY
Primary trend: Mixed short-term range, with rallies sold and dips supported; medium-term bias remains bearish
Please note that the dividends of the following products will be adjusted accordingly. Index dividends will be executed separately through a balance statement directly to your trading account, and the comment will be in the following format “Div & Product Name & Net Volume”.
Please refer to the table below for more details:
The above data is for reference only, please refer to the MT4/MT5 software for specific data.
If you’d like more information, please don’t hesitate to contact info@vtmarkets.com.
Written on September 1, 2025 at 8:48 am, by anakin
When traders want to speculate on financial markets without owning the underlying asset, two common instruments are CFDs (Contracts for Difference) and options. Both are derivatives linked to assets such as stocks, indices, commodities, or currencies, but they differ in structure, costs, risks, and uses. This guide explores cfd vs options, outlining their similarities and differences with real-life examples to help you decide which approach best fits your trading goals.
What Is CFD Trading?
A Contract for Difference (CFD) is a financial derivative that allows traders to speculate on price movements without owning the underlying asset. Instead of buying the asset directly, you agree with a broker to exchange the difference in its value between the time you open and close the position.
How Does CFD Trading Work?
CFDs let you profit from both rising and falling markets. If you believe the price will increase, you go long (buy). If you expect it to fall, you go short (sell). Because CFDs are traded on margin, you only need a fraction of the full trade value, but leverage also magnifies both profits and losses.
Suppose gold (XAUUSD) is trading at $3,300 per ounce. With 1:20 leverage, a margin of $1,000 allows you to control a position worth $20,000. If gold rises to $3,310, your position gains $200. If it falls to $3,290, you lose $200. This shows how leverage can magnify both profits and losses, making risk management essential in CFD trading.
An option is a financial contract that gives the buyer the right, but not the obligation, to buy or sell an underlying asset at a predetermined price within a set period. Options are widely used for speculation, income generation, and hedging.
How Do Options Work?
There are two main types of options:
Call option: A call option gives the right to buy an asset at a fixed price (strike price) before expiry.
Put option: A put option gives the right to sell an asset at a fixed price before expiry.
When buying an option, you pay a premium upfront, which is the maximum amount you can lose. Option sellers, however, may face far larger risks.
Key Features of Options
Defined expiry dates (unlike CFDs)
Premium payment is required upfront
Losses are limited to the premium for buyers
Flexible strategies for speculation and hedging (e.g., covered calls, protective puts, straddles)
Example of Options Trading
Suppose you buy a call option on Apple stock with a strike price of $200, expiring in 30 days, for a premium of $5 per share. If Apple rises to $220, the option is worth $20, giving you a net profit of $15 per share after subtracting the premium. If Apple stays below $200, the option expires worthless, and your maximum loss is the $5 premium.
While both are derivative products, CFDs and options operate in very different ways.
Feature
CFDs
Options
Ownership
No ownership of the asset
May lead to ownership if exercised
Expiry
No expiry date
Fixed expiry date
Costs
Spreads + overnight financing
Premium upfront
Leverage
Broker-provided margin
Built into option pricing
Complexity
Straightforward trading
More complex with multiple strategies
Risk
Losses can exceed the deposit if unmanaged
Loss capped at premium for buyers
1. Ownership
CFDs never involve owning the underlying asset — you only speculate on price changes. Options, however, can result in ownership if the contract is exercised, especially with stock options, where buyers may take delivery of the shares.
2. Expiry
CFDs have no expiry date, which means you can hold a position as long as you meet margin requirements. Options always have a set expiry, and the contract becomes worthless after this date if not exercised.
3. Costs
CFD traders usually pay the spread and may incur overnight financing fees for leveraged positions. Options buyers pay a one-time premium upfront, which is the cost of the contract and represents their maximum possible loss.
4. Leverage
CFDs provide leverage through broker margin, allowing traders to control larger positions with smaller deposits. Options embed leverage within the contract itself — a relatively small premium can provide exposure to a much larger underlying value.
5. Complexity
CFDs are generally straightforward: you decide whether to go long or short. Options are more complex, offering strategies like straddles, spreads, or covered calls, which can be used for speculation or hedging.
6. Risk
CFDs can lead to unlimited losses if markets move sharply against your position and stop-loss orders are not in place. For option buyers, the maximum loss is limited to the premium paid, though sellers of options face much greater risks.
These differences show why the decision between CFD trading and options depends on the trader’s objectives, risk tolerance, and level of experience. CFDs provide straightforward, margin-based exposure ideal for short-term speculation, while options offer structured strategies and defined risk for buyers. Knowing how each product handles costs, leverage, and risk helps traders make the right choice for their circumstances.
Similarities Between CFDs and Options
Despite the distinctions between these two instruments, CFDs and options share several important features that make them appealing to traders who want alternatives to traditional investing.
1. Both Are Derivatives
CFDs and options do not involve direct ownership of the underlying asset. Their value is based on the performance of assets such as stocks, commodities, indices, or currency pairs. This allows traders to access markets without the cost or complexity of owning the asset outright.
2. Both Allow Two-Way Speculation
CFDs let traders take long or short positions, while options use calls and puts to capture opportunities in both rising and falling markets. This flexibility to profit in either direction is a major advantage compared with buy-and-hold strategies.
3. Both Can Be Used for Hedging
Beyond speculation, CFDs and options serve as risk management tools. A trader with shares may use a CFD short position to offset potential losses, or buy a put option to protect against market downturns. In both cases, derivatives provide a way to manage portfolio risk.
4. Both Offer Leverage
Although structured differently, both products provide leveraged exposure. CFDs achieve this through broker margin, while options embed leverage in their premium pricing. In practice, both give traders access to larger positions with relatively small amounts of capital.
These similarities show why CFDs and options are often considered side by side. Both products provide traders with access to a wide range of markets, the ability to act in bullish or bearish conditions, and the potential to use derivatives not only for speculation but also for effective risk management.
CFDs vs Options: Which Suits You Best?
The decision between CFD trading vs options depends on your trading goals, experience, and risk tolerance. Each product has its own strengths that may suit different types of traders.
Why Traders Choose CFDs
Simplicity: CFDs are straightforward — you profit from price movements without worrying about strike prices or expiry dates.
Short-Term Focus: Well-suited to day traders and swing traders who want to capture intraday or weekly price movements.
Broad Market Access: CFDs are available on forex, indices, commodities, shares, and even cryptocurrencies, all from one trading platform.
Flexible Positioning: Easy to go long or short, making them ideal for fast-moving markets.
Why Traders Choose Options
Defined Risk: For buyers, the maximum loss is capped at the premium paid, making risk management clearer.
Strategic Flexibility: Options allow for advanced strategies like spreads, straddles, and covered calls.
Hedging Power: A put option can act as insurance against a market downturn, protecting long-term investments.
Time Value Opportunities: Traders can profit not only from price movements but also from changes in volatility and time decay.
In summary, CFDs are often chosen by traders who want direct, margin-based exposure and a simple trading approach. For instance, a short-term trader speculating on the EUR/USD currency pair might use CFDs with leverage to capture quick intraday price movements. Options, by contrast, attract traders who prefer structured strategies, defined risk, and hedging opportunities. An investor holding a portfolio of blue-chip stocks, for example, could buy a put option on the Nasdaq 100 index to safeguard their positions against a potential market downturn.
Summary
CFDs are straightforward, do not have expiry dates, and allow easy long or short positions, but financing costs and leverage increase short-term risks.
Options involve paying a premium and working with expiry dates, but they offer structured strategies and limited risk for buyers.
CFDs suit short-term traders who want direct market exposure and flexibility.
Options suit investors who want defined risk, hedging tools, and strategic flexibility.
The right choice depends on your experience, risk tolerance, and trading objectives.
Start Trading CFDs or Options with VT Markets
Whether you prefer the simplicity of CFDs or the strategic flexibility of options, VT Markets provides everything you need to begin trading with confidence. Our platforms, MetaTrader 4 (MT4) and MetaTrader 5 (MT5), offer access to global markets including forex, indices, commodities, and shares. You can take advantage of competitive spreads, advanced trading tools, and full support through our Help Centre, making it easier to trade the way that suits your strategy. A demo account is available for you to practise in a risk-free environment before moving into live trading.
CFD stands for Contract for Difference. It is a financial derivative that allows traders to speculate on the price movements of assets such as currencies, commodities, indices, and shares without actually owning them. The profit or loss comes from the difference in the asset’s price between when the contract is opened and closed.
2. What does options mean in trading?
An option is a financial contract that gives the buyer the right, but not the obligation, to buy or sell an underlying asset at a set price before or on a specific expiry date. Options come in two types: calls, which give the right to buy, and puts, which give the right to sell. They are widely used for speculation, hedging, and advanced trading strategies.
3. Are CFDs riskier than options?
CFDs involve leverage, which magnifies both gains and losses, making them riskier for beginners. Options can be less risky for buyers since losses are limited to the premium.
4. Can I hedge my portfolio with CFDs or options?
Yes. CFDs allow you to short-sell quickly, while options such as puts are commonly used for hedging against downside risks.
5. Which is better for beginners, CFDs or options?
CFDs are generally simpler to understand, while options require more knowledge of strategies and pricing. Beginners may find CFDs more approachable.
6. Do CFDs or options have better liquidity?
Liquidity often depends on the market and asset traded. Major forex pairs and indices usually have deep CFD liquidity through brokers, while options on large stocks or indices like the S&P 500 are highly liquid on regulated exchanges.
7. Which product offers better risk management?
Options provide defined risk for buyers since the maximum loss is the premium paid. CFDs require strict stop-loss orders to manage risk effectively, as losses can exceed the initial deposit if markets move quickly.
Japan’s stock market has enjoyed a strong rally, but momentum is cooling as investors pause to take stock. A stronger yen and softer domestic data are tempering sentiment, yet the overall trend remains positive, with September likely to bring a mix of caution and opportunity.
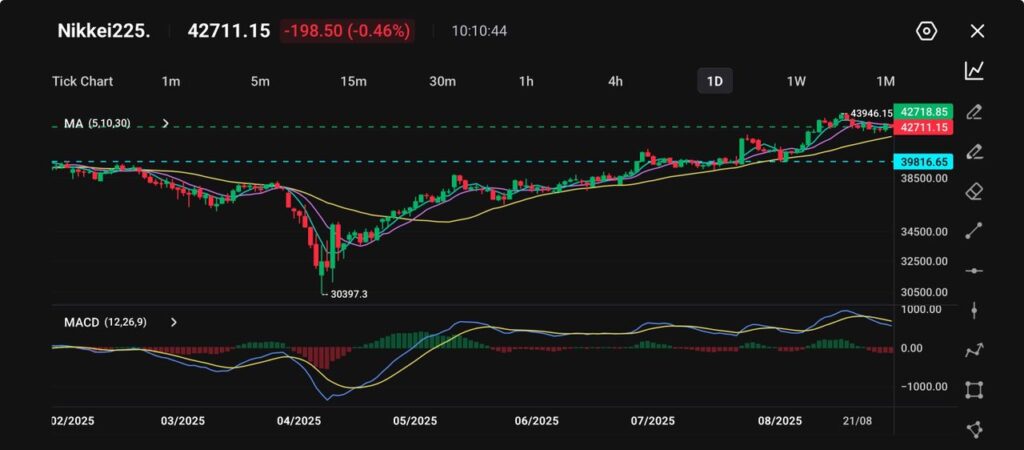
Japanese equities pause after record-setting rally
The Nikkei 225 ended Friday lower at 42,718.47, as investors locked in gains on the final trading day of August.
Despite the pullback, the benchmark index still recorded a monthly rise of over 4%, touching a record high of 43,876.42 earlier in the month.
The broader Topix index also eased by 0.47% to 3,075.18, though it managed a monthly advance of 4.49%, reflecting the resilience of Japanese equities amid the wider global risk-on sentiment.
Profit-taking was fuelled by a stronger yen, which erodes exporters’ overseas earnings, alongside weaker-than-expected domestic economic data.
Factory output for July contracted more sharply than anticipated, while retail sales rose only modestly, missing analyst forecasts.
Inflation in Tokyo sharply eased led by government utility subsidies, while still staying well above the Bank of Japan’s target, keeping it on a path toward further interest rate hikes https://t.co/AC0aTWbLzz
Automakers were among the hardest hit: Toyota declined 1.58%, Honda slipped 1.29%, while tech and consumer shares also softened.
Tokyo Electron edged down 0.41%, Sony lost 1.45%, and Nintendo dipped 0.89%. Out of the 225 Nikkei components, 152 ended lower, 68 advanced, and 5 closed unchanged.
Technical analysis
The Nikkei 225 has staged an impressive rally from its April low of around 30,397, climbing to a recent peak of 43,946 before easing back to near 42,711.
The index continues to trade above its 30-day moving average, confirming that the longer-term uptrend is intact.
However, shorter-term moving averages are starting to flatten, indicating that upward momentum may be cooling.
The MACD indicator is also showing early signs of weakness, with the histogram edging closer to neutral, signalling fading bullish momentum.
Picture: Nikkei 225 trades near 42,718, easing from a 43,946 peak, with support at 42,000 and resistance at 43,950, as shown on the VT Markets app.
Key resistance is located near 43,950. A decisive break above this level would open the door to further upside toward 45,000.
On the downside, initial support lies at 42,000, followed by a stronger base around 39,800, which has served as a major floor in recent months.
While the overall trend remains bullish, the index could see a phase of consolidation or a mild correction before attempting another move higher.
Cautious forecast
After a strong August, the Nikkei 225 forecast suggests the market may trade within a range of 42,000 to 43,500 in the short term as traders reassess valuations.
Continued yen appreciation could weigh on exporters, while lingering concerns over domestic demand may add pressure.
That said, solid corporate earnings are expected to act as a key buffer, particularly from firms with strong global exposure.
Foreign inflows also remain supportive, with Japan seen as a relatively stable market compared to other Asian economies facing sharper slowdowns.
Overall, while the pace of gains may cool, the fundamental backdrop remains positive, keeping the Nikkei on track for further advances into the final quarter of the year.
Please note that the dividends of the following products will be adjusted accordingly. Index dividends will be executed separately through a balance statement directly to your trading account, and the comment will be in the following format “Div & Product Name & Net Volume”.
Please refer to the table below for more details:
The above data is for reference only, please refer to the MT4/MT5 software for specific data.
If you’d like more information, please don’t hesitate to contact info@vtmarkets.com.
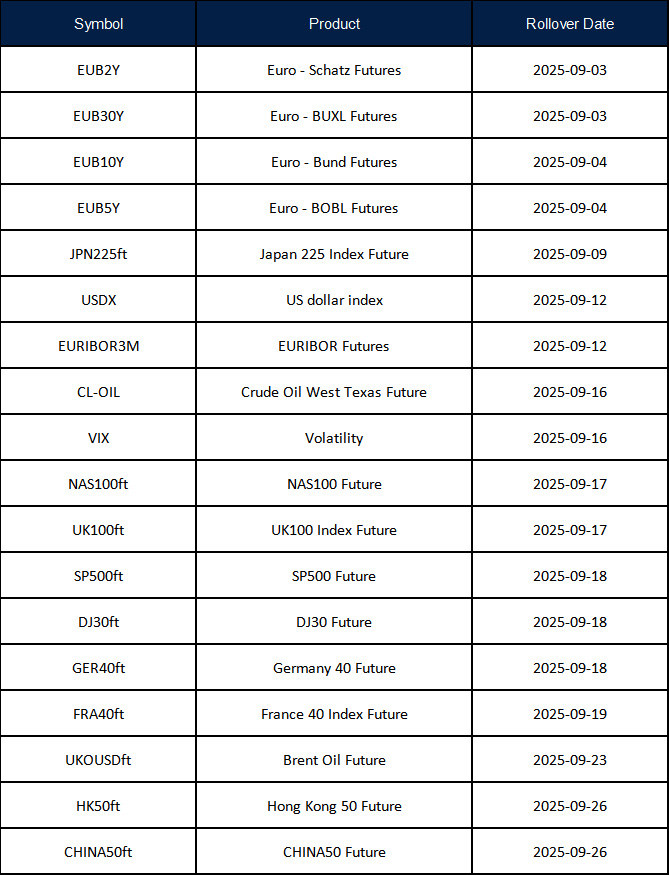
New contracts will automatically be rolled over as follows:
Please note:
• The rollover will be automatic, and any existing open positions will remain open.
• Positions that are open on the expiration date will be adjusted via a rollover charge or credit to reflect the price difference between the expiring and new contracts.
• To avoid CFD rollovers, clients can choose to close any open CFD positions prior to the expiration date.
• Please ensure that all take-profit and stop-loss settings are adjusted before the rollover occurs.
• All internal transfers for accounts under the same name will be prohibited during the first and last 30 minutes of the trading hours on the rollover dates.
If you’d like more information, please don’t hesitate to contact info@vtmarkets.com.
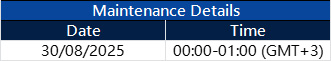
As part of our commitment to provide the most reliable service to our clients, there will be maintenance this weekend.
Maintenance Details:
Please note that the following aspects might be affected during the maintenance:
1. During the maintenance period, VT Markets APP will not be available. It is recommended that you avoid using it during the maintenance.
2. During the maintenance hours, the Client Portal will be unavailable, including managing trades, Deposit/Withdrawal and all the other functions will be limited.
The above data is for reference only. Please refer to the MT4/MT5 software for the specific maintenance completion and market opening time.
Thank you for your patience and understanding about this important initiative.
If you’d like more information, please don’t hesitate to contact info@vtmarkets.com.