Please note that the dividends of the following products will be adjusted accordingly. Index dividends will be executed separately through a balance statement directly to your trading account, and the comment will be in the following format “Div & Product Name & Net Volume”.
Please refer to the table below for more details:
The above data is for reference only, please refer to the MT4/MT5 software for specific data.
If you’d like more information, please don’t hesitate to contact info@vtmarkets.com.
Written on September 16, 2025 at 9:51 am, by anakin
Please note that the dividends of the following products will be adjusted accordingly. Index dividends will be executed separately through a balance statement directly to your trading account, and the comment will be in the following format “Div & Product Name & Net Volume”.
Please refer to the table below for more details:
The above data is for reference only, please refer to the MT4/MT5 software for specific data.
If you’d like more information, please don’t hesitate to contact info@vtmarkets.com.
Written on September 15, 2025 at 9:16 am, by anakin
US inflation and jobs data lifted expectations of Fed rate cuts, driving US stocks to record highs. In Europe, the ECB held rates steady, with its upbeat outlook on growth and inflation tempering bets on further cuts. Meanwhile, Trump dropped his nomination of a hawkish China policy adviser, fuelling speculation he may adopt a more dovish stance on China.
KEY INDICATORS
US economy and Fed
US inflation rose in August, with CPI up 0.4% month on month and 2.9% year on year.
Core CPI increased 0.3% month on month and 3.1% year on year.
Jobless claims reached 263,000 in the week ending 6 Sept, the highest level since Oct 2021.
The IMF reported slowing domestic demand and weaker job growth in the US.
The IMF warned that tariffs could add further pressure to inflation.
Europe and global outlook
The ECB kept interest rates unchanged.
Christine Lagarde said economic risks are now more balanced, but inflation remains uncertain.
Inflation in 2027 is projected at 1.9% and core inflation at 1.8%, both below the ECB’s 2% target.
The IMF said the Fed may have room for cautious rate cuts depending on upcoming data.
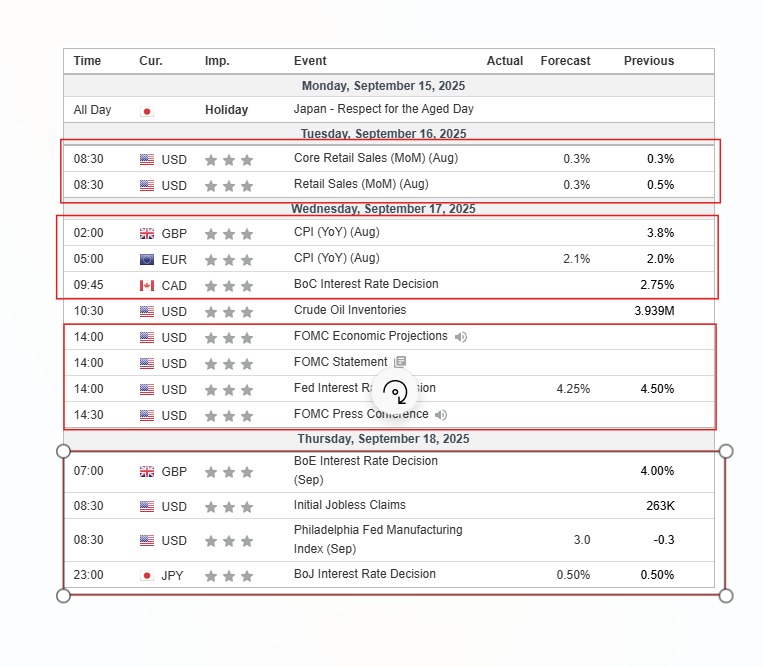
Looking ahead (15–19 Sept)
The Fed’s rate decision takes centre stage, with markets expecting a cut and guidance closely watched.
Key inflation data from the US and Europe.
Earnings from tech and industrials, and geopolitical risks in the Middle East and Asia, may drive volatility across FX, commodities, and equities.
MARKET MOVERS
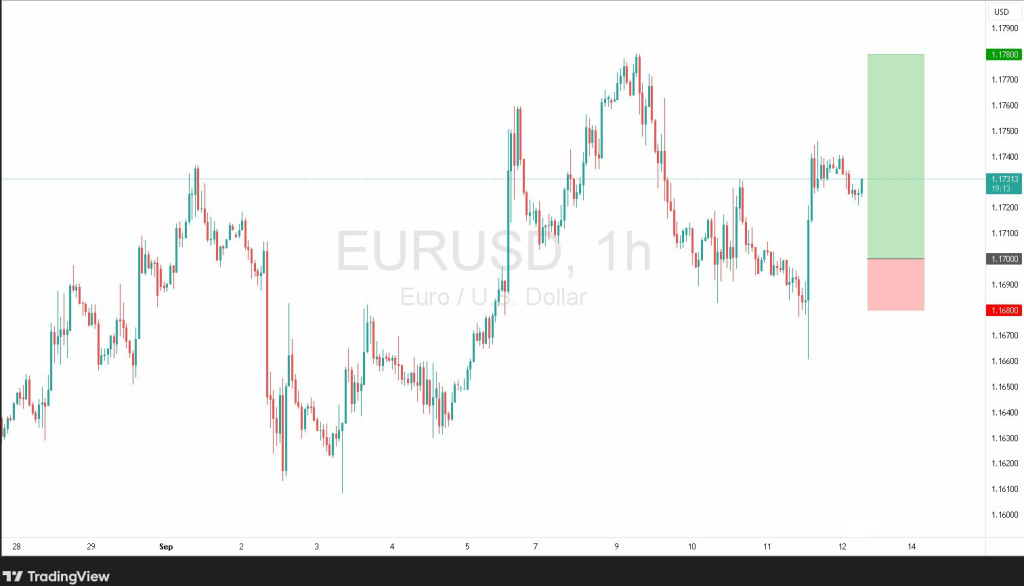
EUR/USD
Primary trend: Bullish, with pullbacks towards 1.1700 expected to attract buyers.
Support level: 1.1700 (secondary: 1.1725)
Resistance zone: 1.1780 (secondary: 1.1800)
Long strategy: Enter longs near 1.1700 support, target 1.1780 initially, extend towards 1.1800, stop-loss below 1.1700.
Short strategy: Consider tactical shorts on rallies into 1.1780–1.1800 resistance, target 1.1725 initially, extend back to 1.1700 if momentum fades.
Range trade: Buy dips near support and sell rallies near resistance if price consolidates between 1.1700–1.1800.
Risk management: Keep stops tight in line with the prevailing bullish bias.
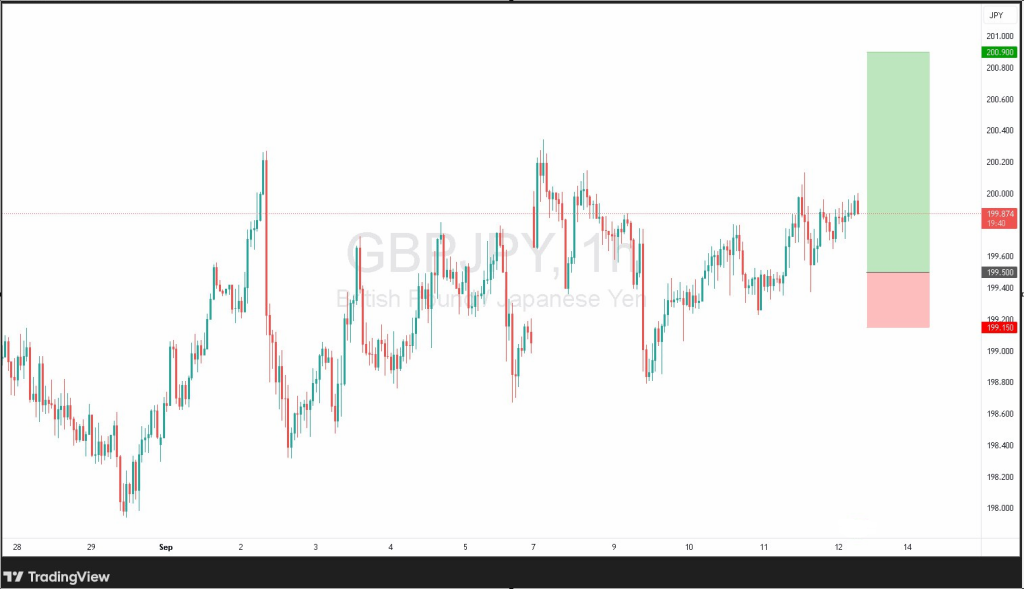
GBP/JPY
Primary trend: Bullish, though risk/reward is limited at current levels.
Support level: 199.50 (secondary: 199.80)
Resistance zone: 200.90 (secondary: 201.30)
Long strategy: Enter longs near 199.50 support, target 200.90 initially, extend towards 201.30, stop-loss below 199.50.
Short strategy: Consider tactical shorts on rallies into 200.90–201.30 resistance, target 199.80 initially, extend back to 199.50 if momentum fades.
Range trade: Buy dips near support and sell rallies near resistance if price consolidates between 199.50–201.30.
Risk management: Keep stops tight in line with the prevailing bullish bias.
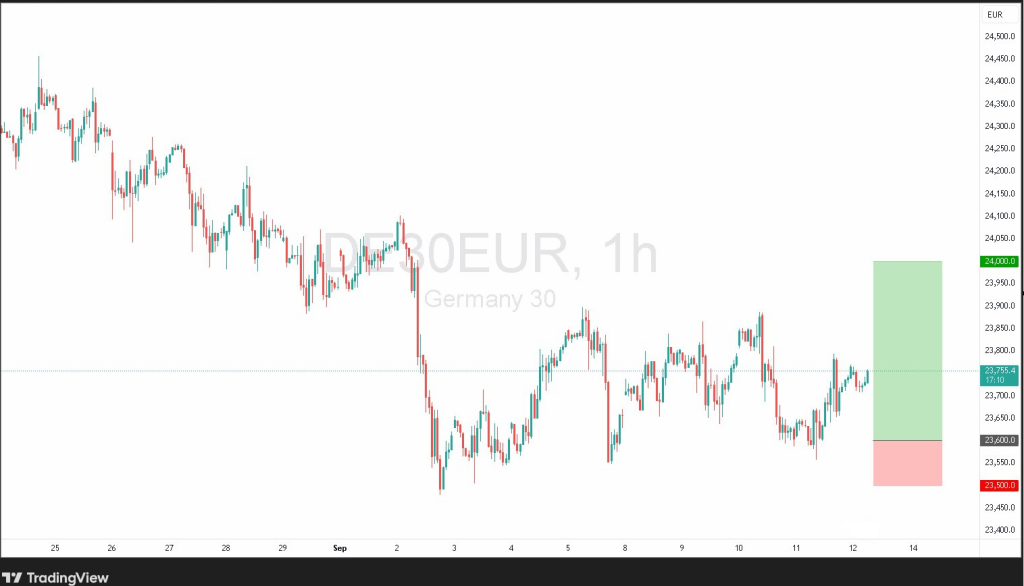
DAX 40 (Germany)
Primary trend: Bullish, with pullbacks towards 23,600 expected to attract buyers.
Support level: 23,600 (secondary: 23,750)
Resistance zone: 24,000 (secondary: 24,100)
Long strategy: Enter longs near 23,600 support, target 24,000 initially, extend towards 24,100, stop-loss below 23,600.
Short strategy: Consider tactical shorts on rallies into 24,000–24,100 resistance, target 23,750 initially, extend back to 23,600 if momentum fades.
Range trade: Buy dips near support and sell rallies near resistance if price consolidates between 23,600–24,100.
Risk management: Keep stops tight in line with the prevailing bullish bias.
NEWS HEADLINES
AI optimism lifts Wall Street
The S&P 500 and Nasdaq reached new highs as cooling inflation and robust AI demand lifted investor sentiment.
Oracle led gains on strong AI cloud demand, with chipmakers including Nvidia, Broadcom, and AMD climbing alongside.
Tech and power suppliers outperformed, while consumer discretionary and staples lagged behind.
Dollar weakens as Fed cut bets grow
The US dollar weakened as markets priced in a likely 25 bps Fed cut.
The yen strengthened against the dollar after US and Japanese officials emphasised that currency levels are not policy targets.
The euro remained steady, supported by stable risk sentiment.
Oil dips, gold benefits from Fed rate expectations
Oil prices (Brent and WTI) fell on oversupply concerns and weak US demand, despite persistent geopolitical risks.
Gold rose for a fourth consecutive week, supported by softer labour market data and growing expectations of a Fed rate cut.
Oil markets face pressure as rising supply and weakening demand outweigh short-term geopolitical headlines, keeping traders focused on fundamentals like inventories and production trends.
Market shifts focus to oversupply risks
Oil futures fell further in early Friday trading, extending the previous session’s decline as market focus shifted back to core supply and demand fundamentals.
Brent crude slipped 0.6% to $65.95 per barrel, while WTI dropped 0.7% to $61.95. Growing concerns over a potential surplus are weighing on sentiment, particularly as demand from the United States shows further signs of slowing.
Oil output from the Bakken, the second-largest US shale field, is showing signs of a slowdown as flows on a key pipeline out of the region decline https://t.co/JLJx6gwjNA
Although tensions in the Middle East and renewed sanctions rhetoric initially supported oil, the geopolitical risk premium is fading.
Earlier in the week, prices briefly spiked after President Trump urged the EU to impose tariffs on Chinese and Indian goods as part of broader efforts to increase pressure on Russia. However, the boost quickly reversed as the market refocused on fundamentals.
Trump's pressure on Europe to slap 100% tariffs on India and China raises eyebrows https://t.co/yGJMrkZSaf
The muted response to sanctions headlines highlights traders’ view that current supply dynamics carry more weight than geopolitical disruptions.
With US demand weakening and stockpiles rising, the potential for oversupply is emerging as a more dominant driver of price direction than the risk of conflict or trade restrictions.
Technical analysis
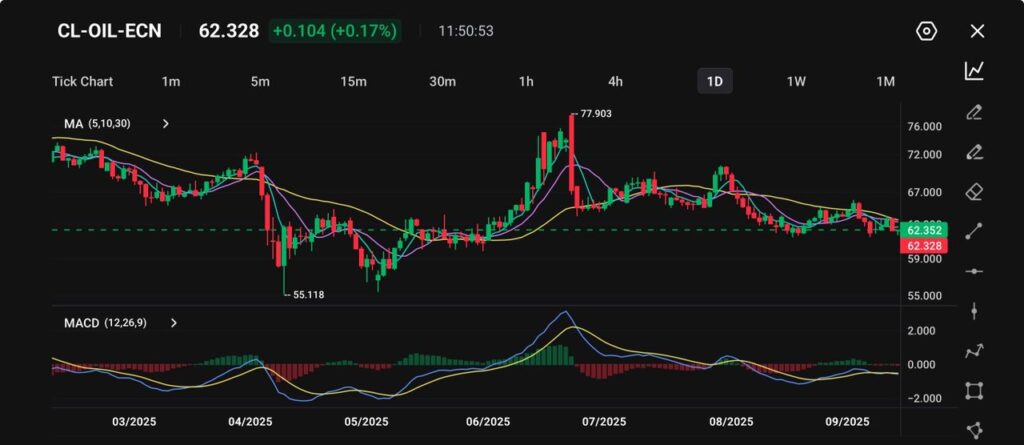
WTI crude is currently trading at $62.33, up 0.17% on the day, though overall momentum remains subdued after a turbulent year.
Picture: Brent crude slips to $65.95, consolidating between $59.00 support and $67.00 resistance on the VT Markets app.
The price chart shows crude rebounding from April’s low of $55.12, peaking at $77.90 in July before retreating to the low $60s.
Moving averages (5, 10, 30) are now converging, reflecting indecision, while the MACD hovers flat around the zero line, signalling weak momentum.
Immediate support is identified near $59.00, while resistance lies around $67.00, with July’s high of $77.90 marking the next major ceiling.
Unless a breakout occurs, oil prices are likely to consolidate within this range, with traders closely monitoring supply-demand trends and potential shifts from the Federal Reserve’s interest rate policy.
Cautious forecast
In the short term, crude oil is expected to remain under pressure between $61.00 and $64.00, as rising inventories and a stronger supply outlook outweigh geopolitical headlines.
The IEA’s revised forecast and persistent US stock builds suggest that upside potential remains capped, even in the face of sanctions or Middle East flashpoints.
Over the medium term, if demand continues to soften while OPEC+ holds to its production strategy, prices could gradually drift towards the $59.00–60.00 range.
A sharper slowdown in US consumption could accelerate losses unless offset by production cuts or unexpected supply disruptions.
Looking ahead, traders should keep an eye on next week’s EIA inventory report and OPEC+ statements for any signs of a shift in tone. Until then, upside rallies may remain limited while downside risks persist.
Please note that the dividends of the following products will be adjusted accordingly. Index dividends will be executed separately through a balance statement directly to your trading account, and the comment will be in the following format “Div & Product Name & Net Volume”.
Please refer to the table below for more details:
The above data is for reference only, please refer to the MT4/MT5 software for specific data.
If you’d like more information, please don’t hesitate to contact info@vtmarkets.com.
Written on September 12, 2025 at 8:49 am, by anakin
When companies raise capital, they often issue different classes of shares. Understanding the difference between ordinary and preference shares is essential before making investment decisions. While both represent ownership in a company, they differ in rights, income, and growth potential. This guide explains preference shares vs ordinary shares and helps investors decide which may suit their objectives.
What Are Ordinary Shares?
Ordinary shares, also called common shares, are the most widely issued type of equity. They represent a claim on a company’s profits and assets, giving investors both risks and rewards tied directly to business performance. By holding ordinary shares, investors become partial owners of the company, with their returns coming from capital appreciation and dividends when profits are distributed.
Key features include:
Voting rights: Ordinary shareholders can vote on major company decisions, including electing directors.
Dividends: Payments are not guaranteed. Companies distribute dividends from profits, and they may vary or stop entirely.
Capital growth potential: Ordinary shares can increase significantly in value if the company performs well.
Example:
Apple Inc. illustrates this clearly. Its ordinary shares traded at about $25 in 2010 and rose above $200 by 2025, an increase of roughly 700% over 15 years. Since 2012, Apple has also paid regular dividends, rewarding investors with both income and long-term growth.
What Are Preference Shares?
Preference shares, also known as preferred stock, are a class of equity that blends features of both shares and bonds. They typically provide investors with a fixed dividend and priority over ordinary shareholders in the distribution of profits and assets. However, they usually come without voting rights, which limits shareholder influence. They are less common but remain popular in sectors like banking and utilities.
Key features include:
Fixed dividends: Preference shareholders typically receive a fixed dividend, paid before ordinary shareholders.
Priority: In the event of liquidation, preference shareholders have a higher claim on assets than ordinary shareholders.
Limited or no voting rights: Most preference shares do not carry voting rights.
Types of preference shares: Cumulative, convertible, redeemable, and participating.
Example:
JPMorgan Chase issues several series of preference shares, with dividends typically ranging from 4.5% to 6% annually. These consistent payouts appeal to income-focused investors who value stability over growth potential.
Preference Shares vs Ordinary Shares: Key Differences
Investors often ask: what is the difference between ordinary and preference shares? The answer lies in how each type of share provides rights, rewards, and risks. Ordinary shares tend to suit investors looking for long-term capital appreciation and voting power, while preference shares are designed to deliver stable income with more security.
To make this clear, the table below shows the main eight differences between ordinary and preference shares:
Feature
Ordinary Shares
Preference Shares
Ownership rights
Full ownership with voting rights
Ownership, usually no voting rights
Dividend payments
Variable, not guaranteed
Fixed, paid before ordinary shareholders
Dividend priority
Paid last, after all others
Priority over ordinary shareholders
Capital growth
High long-term potential
Limited upside, mainly income-focused
Risk level
Higher, tied to market volatility
Lower, thanks to fixed payouts
Priority in liquidation
Last in line for claims
Ahead of ordinary shareholders
Convertibility
Cannot be converted
Some can be converted into ordinary shares
Investor profile
Favoured by growth-oriented investors
Favoured by income-seeking investors
1. Ownership rights
Ordinary shareholders hold voting rights that allow them to influence company decisions such as electing directors or approving mergers. Preference shareholders usually lack voting rights, which makes them less influential in governance. For example, Apple’s ordinary shareholders can vote at annual meetings while JPMorgan preference shareholders cannot.
2. Dividend payments
Ordinary share dividends depend on profits and may vary from year to year. Preference shares usually provide fixed dividends, offering a more predictable income stream. For instance, JPMorgan’s preference shareholders receive around 6 percent annually regardless of fluctuations in ordinary dividends.
3. Dividend priority
Ordinary shareholders receive dividends only after preference shareholders have been paid. This makes preference shares safer for income-focused investors. In 2008, several banks halted ordinary share dividends but continued paying preference shareholders.
4. Capital growth
Ordinary shares offer higher potential for price appreciation over time. Preference shares provide limited upside because they focus on steady income. Apple’s share price rising from $25 in 2010 to over $200 in 2025 highlights the strong growth potential of ordinary shares.
5. Risk level
Ordinary shares are more volatile since their value follows market conditions and company performance. Preference shares are less risky because of their stable payouts. This is why retirees often prefer preference shares while younger investors lean toward ordinary shares.
6. Priority in liquidation
In the event of bankruptcy, preference shareholders have a stronger claim on assets than ordinary shareholders. This added protection reduces their downside risk. For example, preference shareholders may recover part of their investment in liquidation while ordinary shareholders often lose everything.
7. Convertibility
Ordinary shares cannot be converted into other types of equity. Certain preference shares, called convertible preference shares, can be exchanged for ordinary shares at a future date. Startups sometimes issue convertible preference shares to attract venture capital investors.
8. Investor profile
Ordinary shares appeal to investors seeking growth and long-term wealth. Preference shares suit investors looking for steady income and reduced risk. A 30-year-old saving for retirement may choose ordinary shares while a retiree might prefer preference shares for reliable dividends.
Preference Shares vs Ordinary Shares: Which Should You Choose?
The choice between preference shares and ordinary shares depends on your investment objectives. Some investors prioritise growth, while others value stability and income. Here’s how different types of investors typically approach each option:
People invest in ordinary shares when:
They want long-term growth through rising share prices.
They can accept higher risk and short-term volatility.
They value voting rights and influence in company decisions.
Example:
A 30-year-old professional with a long investment horizon chooses Apple ordinary shares. He accepts short-term volatility in exchange for long-term wealth accumulation, believing the growth potential outweighs dividend uncertainty.
People invest in preference shares when:
They prioritise steady income through fixed dividends.
They want lower risk and more security in returns.
They do not mind limited or no voting rights.
Example:
A 65-year-old retiree invests in JPMorgan preference shares, such as its PSL series, which pays around 6 percent annually. She values predictable income to cover living expenses and prefers the lower risk profile, even though it means limited upside potential.
Summary
Ordinary shares offer voting rights and the potential for long-term capital growth, making them attractive to younger or growth-focused investors willing to accept higher risk. Preference shares provide fixed dividends and greater security, appealing to retirees or income-seeking investors who prioritise stability over rapid gains. By understanding the difference between ordinary shares and preference shares, investors can choose the option that best fits their goals and risk appetite.
Learn More About the Share Market with VT Markets
At VT Markets, you can trade both ordinary shares and preference shares through Contracts for Difference (CFDs). This lets you benefit from price movements in both rising and falling markets without directly owning the shares. With access to leading platforms like MetaTrader 4 (MT4) and MetaTrader 5 (MT5), along with competitive spreads and professional support, VT Markets offers a flexible way to explore global share opportunities. New traders can start with a VT Markets demo account to practise strategies in real time, while further guidance and resources are available through the VT Markets Help Centre.
1. What is the difference between ordinary and preference shares?
Ordinary shares give investors ownership rights, voting power, and the potential for long-term capital growth, but dividends are not guaranteed and risks are higher. Preference shares provide fixed dividends and priority in payouts, with less risk and more stability, but usually without voting rights or significant growth potential.
2. Which is better, preference shares or ordinary shares?
Neither is universally better, as it depends on your goals. Ordinary shares suit investors who want long-term capital growth and are comfortable with higher risk. Preference shares are better for investors seeking steady dividends and lower volatility. The right choice comes down to your investment horizon and risk appetite.
3. Do preference shares pay higher dividends than ordinary shares?
Yes, preference shares generally pay higher and more stable dividends than ordinary shares, which depend on company profits.
4. Which is safer: preference shares or ordinary shares?
Preference shares are safer in terms of income and liquidation priority, while ordinary shares carry higher risk but greater potential for long-term gains.
5. Are preference shares more common in certain industries?
Yes. They are frequently issued by banks, insurance companies, and utilities because these industries benefit from stable capital and consistent payouts.
6. Do both types of shares trade on stock exchanges?
Ordinary shares are almost always listed, while preference shares may have limited availability and liquidity, depending on the market.
7. Can I hold both preference and ordinary shares in one portfolio?
Yes. Many investors combine both to balance income stability from preference shares with growth potential from ordinary shares.
Written on September 12, 2025 at 8:36 am, by jason
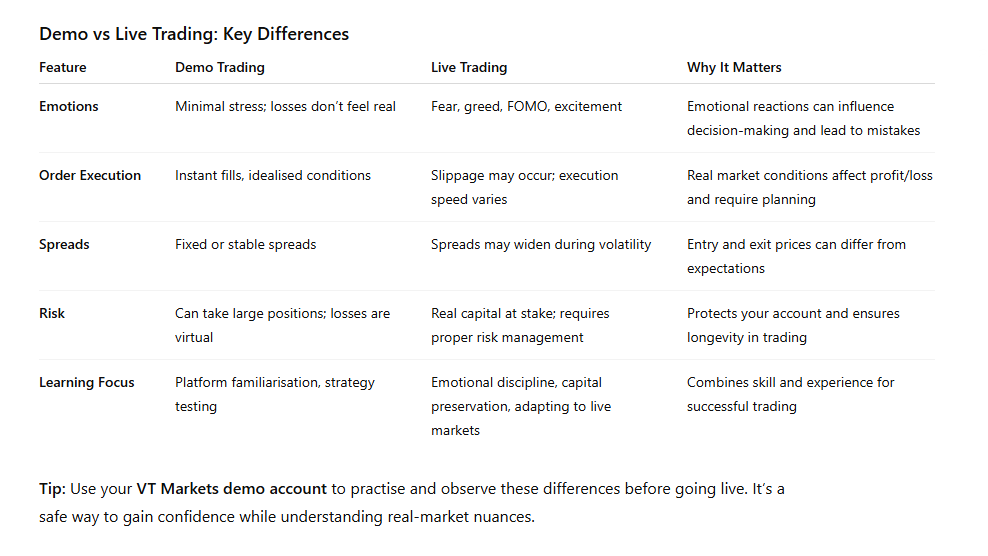
You’ve mastered the demo account, executed dozens of trades, and your strategy seems flawless. But what happens when real money is on the line? Suddenly, the calm confidence you felt turns into hesitation, doubt, and sometimes panic – and the rules of the game change.
Demo trading is invaluable for learning the mechanics, testing strategies, and getting comfortable with the platform. Yet, it can never fully prepare you for the emotional and practical realities of live trading. Understanding these differences and knowing how to adapt can be the key to trading successfully and confidently.
Why demo trading matters
For beginners, demo accounts are a crucial first step. They allow you to explore the trading environment without risking a penny, helping you understand how platforms like MT4 or MT5 work, familiarise yourself with order types, and practise strategies.
Imagine placing 50 demo trades using a simple moving average crossover strategy. Each trade reinforces the mechanics, timing, and basic rules of your strategy. By the end, you might feel confident that your approach works – and in many cases, it does… in a simulated world.
Demo trading is like a flight simulator for aspiring pilots. You can practise take-offs, landings, and emergency procedures endlessly, but nothing truly replicates the pressure of a real flight. In trading, that pressure comes with real money.
With a VT Markets demo account, you can start trading at your own pace and build confidence before risking real money. You get 90 days to practise, explore different strategies, and familiarise yourself with the platform until you feel prepared to trade live.
Ready to start your journey? Open a VT Markets demo account today and take your first step towards trading with confidence.
What changes when you go live
When you move from demo to live trading, three main factors make the experience fundamentally different: emotions, market conditions, and risk management.
Emotional discipline enters the game
In a demo account, losses are just numbers on a screen. Fear and greed are absent, so decisions tend to be rational.
In live trading, emotions suddenly matter. Fear of losing real money can make you hesitate, while the excitement of a winning streak may tempt you to overtrade. Even experienced traders can feel a surge of FOMO (fear of missing out) when markets move quickly.
Example: On demo, you might close a losing trade at -$200 without thinking twice. Live, that same loss could make you panic or hold onto a position too long, hoping it will recover – often with worse results.
Real market conditions
Demo accounts cannot always replicate the nuances of live markets. Two key differences are slippage and spread variability.
Slippage occurs when your order fills at a slightly different price than expected, usually during high volatility. On demo, orders fill instantly, giving a false sense of control.
Spreads – the difference between the buy and sell price – can widen during news events or market spikes. This affects your entry and exit points more noticeably on a live account.
Execution speed can also vary. Demo servers are often idealised, whereas live orders must compete in real-time market conditions.
Example: During a major economic announcement, a EUR/USD buy order may fill 5 pips away from your intended price in a live account. On demo, it would have filled perfectly. This small difference can influence your profit and loss, and it emphasises why live trading requires careful risk management.
Risk and capital management
Demo accounts often encourage traders to take larger positions or risk more per trade because losses don’t matter. In live trading, this approach can quickly lead to significant losses.
Example: A trader risking 10% per trade in demo may feel safe experimenting. On a live account, repeated 10% losses can deplete capital rapidly, making it harder to recover. Understanding proper position sizing and risk per trade is essential to survive and succeed in live markets.
How to transition smoothly
Moving from demo to live trading does not have to be intimidating. Here are practical tips to make the transition as smooth as possible:
1. Start small
Begin with a small deposit or micro-lot trades. This allows you to get used to the emotional side of live trading without risking too much.
2. Stick to your trading plan
Avoid the temptation to deviate from strategies that worked in demo. Your plan – including entry and exit rules, risk limits, and goals – is your safety net.
3. Use stop-losses consistently
Discipline in live trading is critical. Using stop-loss orders protects your capital and reinforces good habits.
4. Treat demo results as a baseline
Remember that past performance in demo is only indicative. Adjust your expectations and be ready to refine your strategy based on live results.
5. Leverage tools from VT Markets
Make use of advanced features such as AI-driven insights, real-time economic calendars, automated risk calculators, and expert support. These tools can help you make informed decisions and navigate live trading with greater confidence.
Conclusion
Moving from demo to live trading is a natural and necessary step for any trader who wants to succeed. Demo accounts teach skills; live accounts teach experience. The transition may feel daunting at first, but understanding the differences and preparing for them can make all the difference.
With discipline, realistic expectations, and the right tools, your demo success can translate into live trading confidence. Start today with a VT Markets demo account, practise at your own pace, and when you’re ready, step into live trading with exclusive tools, bonuses, and 24/5 expert support – giving you the best possible start on your live trading journey.
Written on September 11, 2025 at 2:17 pm, by valerie
Investors have many choices when it comes to building wealth. Beyond ordinary shares and bonds, companies also issue preference shares, sometimes called preferred stock. These instruments offer a balance between equity and fixed income, making them an attractive option for those seeking stability and steady returns. In this article, you will learn what preference shares are, how they work, their advantages and disadvantages, and how you can trade them through VT Markets, supported by real-life examples and figures.
What Are Preference Shares (Preferred Stock)?
Preference shares, also called preferred stock, are a special class of equity issued by companies to raise capital. They sit between bonds and ordinary shares in terms of risk and reward. Like ordinary shareholders, preference shareholders are part-owners of the company, but unlike them, they usually do not have voting rights in company decisions.
What makes preferred stock unique is its predictable dividend stream and priority status. Holders receive a fixed dividend before any payment is made to ordinary shareholders, and if the company faces liquidation, preference shareholders have a higher claim on the company’s assets. This makes them less risky than ordinary shares but not as secure as bonds.
Key characteristics include:
Fixed dividend payments that are often higher than ordinary share dividends.
Priority over ordinary shareholders for dividends and asset claims.
Hybrid nature, combining features of debt (steady income) and equity (ownership).
Limited or no voting rights, meaning less influence on company policies.
Example:
Suppose a company issues preference shares with a fixed 6% annual dividend. If an investor buys $10,000 worth of these shares, they receive $600 each year. Even if the company decides not to pay dividends to ordinary shareholders due to weak earnings, preference shareholders still receive their fixed payout first.
Types of Preference Shares
Preferred stock comes in different forms, each designed to meet specific needs for both companies and investors:
1. Cumulative Preference Shares
These shares allow unpaid dividends to accumulate and be carried forward to future years. This feature protects investors, since companies must pay all missed dividends before ordinary shareholders can receive any payments. For example, if a $2 dividend is skipped for three years, the shareholder is still entitled to $6 per share once dividends resume.
2. Non-Cumulative Preference Shares
With these shares, dividends are only paid out of current profits. If a company decides to skip the payment in a given year, those dividends are lost forever. This makes them riskier than cumulative preference shares, but they are still ranked ahead of ordinary shareholders in payouts. For instance, if a $2 dividend is missed this year, shareholders cannot claim it later even if profits improve.
3. Participating Preference Shares
Participating shares provide both a fixed dividend and the right to share in additional profits if the company performs exceptionally well. This allows investors to enjoy more upside than with traditional preference shares. For example, a shareholder might receive the usual 6% dividend and, in a record year, also gain an additional 2% bonus distribution.
4. Convertible Preference Shares
Convertible shares can be exchanged for a fixed number of ordinary shares after a certain period or under specified conditions. This feature gives investors flexibility, as they can keep collecting fixed dividends or convert to ordinary shares to benefit from share price growth. For instance, a $100 convertible preference share may be exchanged for five ordinary shares if the company’s stock price rises significantly.
5. Redeemable Preference Shares
Redeemable shares come with a maturity date at which the issuing company can buy them back, usually at a predetermined price. This provides investors with a clear exit strategy, although they may face reinvestment risk if market conditions change. For example, a company might issue redeemable preference shares at $100 each and promise to repurchase them after 10 years.
Preference Shares vs Ordinary Shares: Key Differences
Both preferred stock and ordinary shares represent ownership in a company, but they work very differently. Ordinary shares are the most common type of equity, giving investors full voting rights and the potential to benefit from rising profits. Preference shares, on the other hand, prioritise income stability and security by offering fixed dividends and higher claims on assets, but often at the cost of voting power and growth potential.
Feature
Preference Shares
Ordinary Shares
Dividend
Fixed, paid before ordinary shareholders
Variable, based on company profits
Voting Rights
Usually none
Full voting rights
Risk Level
Lower, more stable returns
Higher risk, potential for larger gains
Asset Claims
Priority over ordinary shares
Paid last after creditors and preference shareholders
Example: During the 2008 financial crisis, several banks, including Citigroup, raised capital by issuing preference shares. Holders of these shares continued receiving fixed dividends and had priority in receiving dividends, even as ordinary shareholders saw their dividends suspended, highlighting the stability preference shares can provide in turbulent markets and the risk that ordinary shareholders may not be receiving dividends during periods of financial stress.
Advantages of Preference Shares
Preferred stock offers several benefits that make it appealing to certain types of investors. Their structure provides stability, priority in payouts, and a mix of bond-like and equity-like features.
Stable Income: Preference shares usually pay fixed dividends, giving investors predictable returns regardless of market volatility. This makes them appealing to conservative investors or those relying on steady cash flow.
Priority Over Ordinary Shares: Holders are paid before ordinary shareholders when dividends are declared and also rank higher in asset claims if the company is liquidated. This reduces overall investment risk.
Hybrid Nature: They combine features of bonds and equity, offering fixed income like a bond while still representing ownership in the company. This balance provides both security and moderate growth potential.
Disadvantages of Preference Shares
Preferred stock also comes with drawbacks that limit its appeal. Their fixed structure means less growth potential, limited rights, and possible liquidity concerns.
Limited Voting Rights: Preference shareholders usually have little to no say in company decisions, which means they cannot influence management or policy like ordinary shareholders can.
Lower Growth Potential: Dividends are fixed, so investors miss out on the potential gains from rising profits and share prices that ordinary shareholders may enjoy.
Liquidity Risk: Preference shares are often less actively traded than ordinary shares, which can make it harder for investors to sell quickly or at favourable prices.
Who Should Invest in Preference Shares?
Preferred stock is best suited for investors who value stability and steady returns rather than high-risk, high-reward opportunities.
Income-Focused Investors: Those who rely on predictable dividend payments, such as retirees, benefit from the fixed payouts of preference shares.
Conservative Investors: People who want less exposure to market volatility may prefer the stability that preference shares provide compared to ordinary shares.
Institutional Investors: Pension funds and insurance companies often include preference shares in their portfolios to balance income with moderate risk.
Diversified Investors: Individuals who already hold higher-risk assets, such as growth stocks, may use preference shares to stabilise overall returns.
Long-Term Holders: Investors comfortable with limited liquidity and fixed income may see preference shares as a dependable option for holding over time.
How to Trade Preference Shares with VT Markets
At VT Markets, you do not purchase preference shares directly. Instead, you can trade them through Contracts for Difference (CFDs), which let you take advantage of price changes without owning the actual shares. This gives you flexibility to profit in both rising and falling markets.
Step 1: Learn the basics
Understand what preference shares are, how fixed dividends work, and why they differ from ordinary equity.
Step 2: Create your trading account
Sign up with VT Markets and finish the quick verification process to start trading.
Step 3: Fund your account
Deposit fund into your trading account using safe and convenient funding methods.
Step 4: Select a preference share CFD
Pick the company you want to trade, such as major banks or global corporations that issue preference shares, and review its market outlook.
Step 5: Execute your trade
Decide whether to buy (go long) if you expect prices to increase, or sell (go short) if you expect them to decline.
What are preference shares? They are hybrid instruments that provide fixed dividends and priority in payouts, making them attractive for income-focused and conservative investors. While they lack voting rights and offer limited growth compared to ordinary shares, they deliver stability and reduced risk. Through VT Markets, you can access preference shares via CFDs on global shares, giving you flexibility to speculate on price movements while managing risk effectively.
Preference shares, also known as preferred stock, are a type of equity that pays fixed dividends and gives shareholders priority over ordinary shareholders for payouts and asset claims.
2. Are preference shares safer than ordinary shares?
Yes, they are generally safer because they pay fixed dividends and rank higher in asset claims, though they are not risk-free.
3. Do preference shareholders have voting rights?
Usually no. Preference shareholders typically have little to no voting power in company matters.
4. Can preference shares be converted into ordinary shares?
Some types, called convertible preference shares, can be exchanged for ordinary shares at predetermined terms.
5. Are dividends on preference shares guaranteed?
Dividends are fixed but not always guaranteed. If unpaid, cumulative preference shares allow dividends to accrue, while non-cumulative ones do not.
6. Do preference shares trade on stock exchanges?
Yes, but they are often less liquid than ordinary shares, meaning fewer buyers and sellers may be available.
7. How do preference shares compare with bonds?
Both provide fixed income, but bonds are debt while preference shares represent equity ownership. Bonds usually rank higher in repayment if a company fails.
8. Why do companies issue preference shares?
They allow firms to raise capital without giving away voting control, often making them attractive for banks and large corporations.
Written on September 11, 2025 at 8:50 am, by jason
The US dollar is navigating a mix of economic and political pressures. Softer inflation data has lifted hopes of interest rate cuts, but uncertainty around the Federal Reserve’s independence and upcoming economic releases means the outlook remains finely balanced.
Cooling PPI fuels Fed cut bets
The US dollar found stability during Asian trading hours, supported by softer inflation data and growing anticipation of rate cuts from the Federal Reserve.
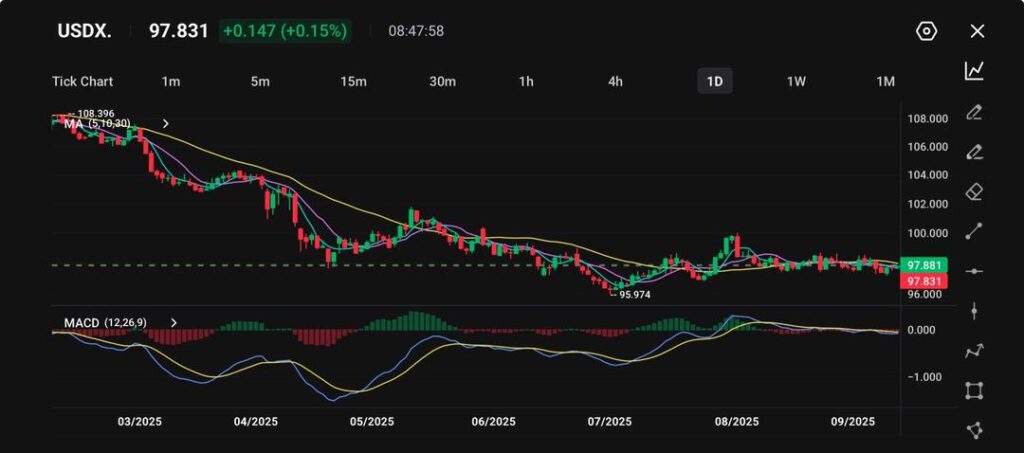
As of 08:47 GMT, the US Dollar Index (DXY) was at 97.831, showing an increase of 0.147 points or 0.15%.
This marked a third straight session of gains, following earlier weakness this month. The turning point came after the Bureau of Labor Statistics reported that the Producer Price Index (PPI) for final demand slipped 0.1% in August, compared with a downwardly revised 0.7% rise in July.
A stalling labor market points to slower growth ahead in the US. A drop in stock prices on this reality would be a buying opportunity, @edwarnh argues, as long as a recession isn't on the horizon https://t.co/5FNRZJgyk8
The softer print strengthened expectations of policy easing, with markets now viewing a 25-basis-point cut at the Fed’s 16-17 September meeting as highly likely.
Still, traders remain cautious ahead of today’s US Consumer Price Index (CPI) release. Any upside surprise could temper expectations for deeper monetary easing and reverse recent dollar strength.
Political turbulence challenges Fed independence
Alongside economic data, political manoeuvres in Washington are injecting uncertainty into the Fed outlook.
The Trump administration is seeking to dismiss Federal Reserve Governor Lisa Cook, despite a court ruling temporarily blocking the move.
The White House’s push to reshape the central bank’s leadership before the September policy meeting has raised concerns about political interference.
Meanwhile, Trump-backed nominee Stephen Miran cleared the Senate Banking Committee and is edging closer to confirmation, though it remains unclear if the process will conclude before the upcoming decision.
Even partial politicisation of the Fed could undermine confidence in its independence, potentially weighing on long-term dollar sentiment and market stability.
Technical analysis
The Dollar Index is trading at 97.83 (+0.15%), but it remains in a broader downtrend from February’s 2025 peak of 108.39.
Picture: Dollar Index steady near 97.83, consolidating between 96.00 support and 99.00 resistance on the VT Markets app.
After touching a yearly low of 95.97 in July, the index has recovered modestly yet still struggles to regain the 100 threshold – evidence of ongoing selling pressure.
Short-term moving averages (5, 10, and 30) are flat, signalling indecision, while the MACD hovers near zero, pointing to subdued momentum.
Key support lies at 96.00, with a break lower exposing July’s trough. On the upside, resistance is located at 99.00 and 101.00 – levels that bulls need to reclaim to shift sentiment decisively.
Cautious forecast
In the near term, the Dollar Index is likely to trade within a narrow 97.50–98.00 range as markets digest incoming inflation figures and policy signals from the Fed.
A stronger-than-expected CPI release could push the index towards 98.30, while dovish rhetoric or political headwinds from Washington may cap gains quickly.
Looking further ahead, the Fed’s policy stance and the Trump administration’s continued pressure on central bank governance will remain the key drivers.
One or two rate cuts by year-end – if managed without unsettling forward guidance – could keep the dollar steady near present levels.
However, intensified political interference or deeper disinflation risks might send the index back towards 96.00 in the final quarter.
Please note that the dividends of the following products will be adjusted accordingly. Index dividends will be executed separately through a balance statement directly to your trading account, and the comment will be in the following format “Div & Product Name & Net Volume”.
Please refer to the table below for more details:
The above data is for reference only, please refer to the MT4/MT5 software for specific data.
If you’d like more information, please don’t hesitate to contact info@vtmarkets.com.
Written on September 11, 2025 at 8:12 am, by anakin