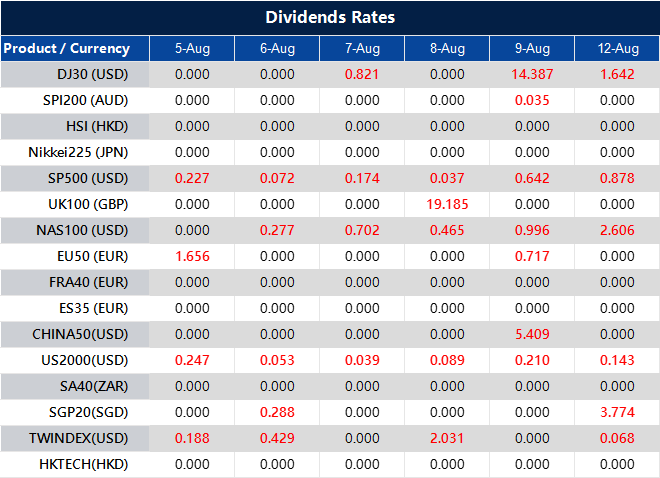
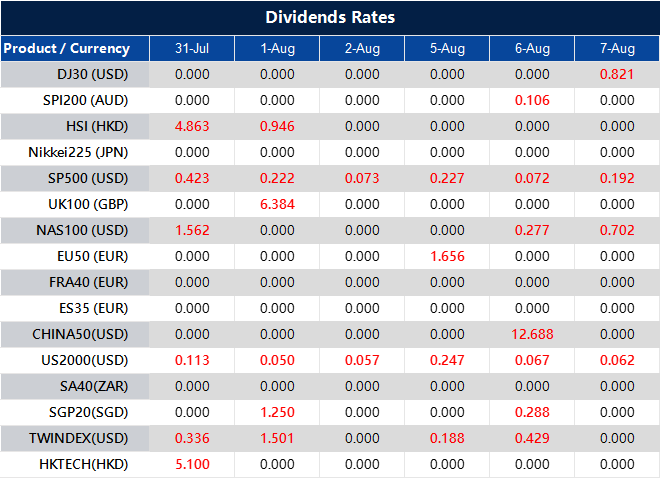
Please note that the dividends of the following products will be adjusted accordingly. Index dividends will be executed separately through a balance statement directly to your trading account, and the comment will be in the following format “Div & Product Name & Net Volume ”.
Please refer to the table below for more details:
The above data is for reference only, please refer to the MT4/MT5 software for specific data.
If you’d like more information, please don’t hesitate to contact info@vtmarkets.com.
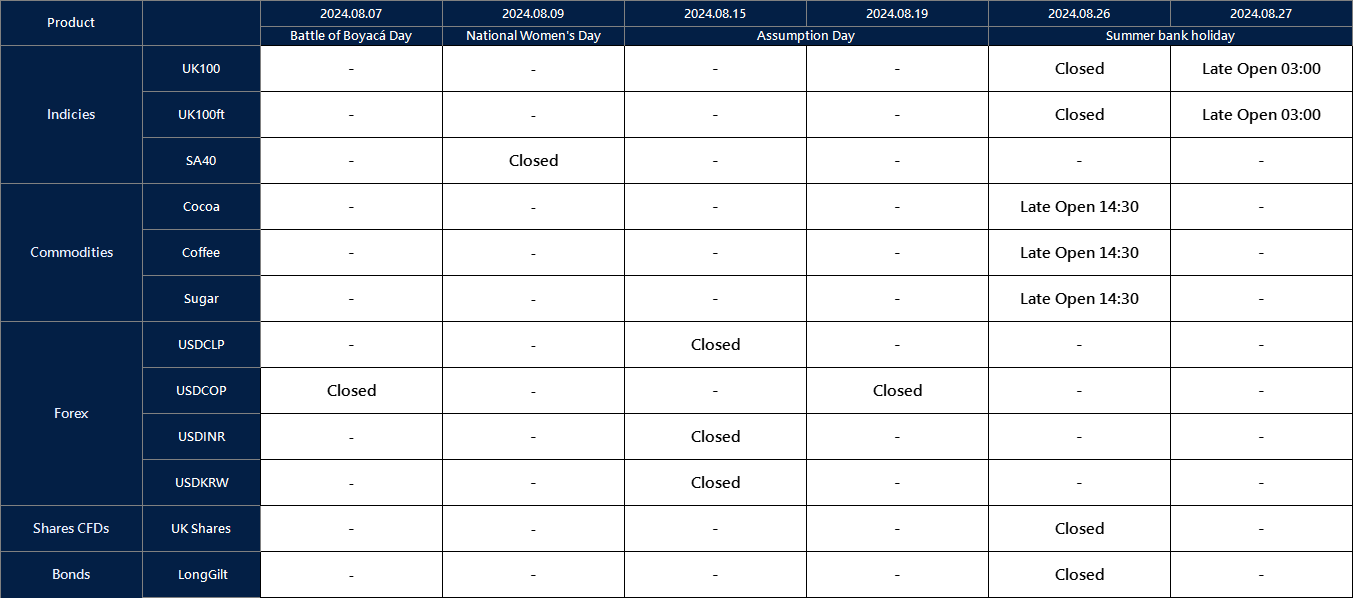
Affected by international holidays, the trading hours of some VT Markets products will be adjusted. Please check the following link for the affected products:
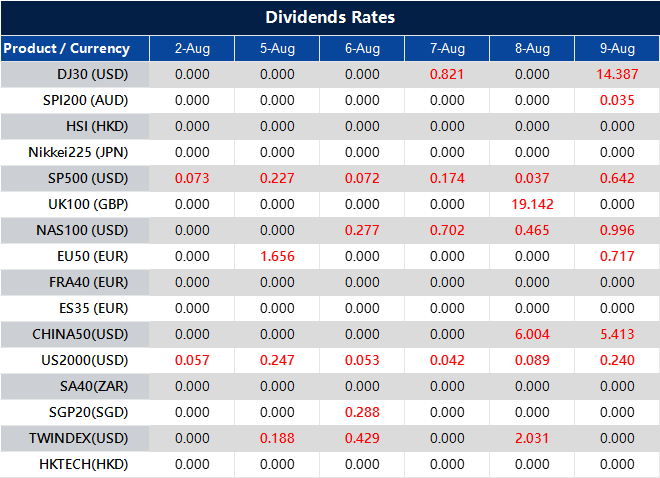
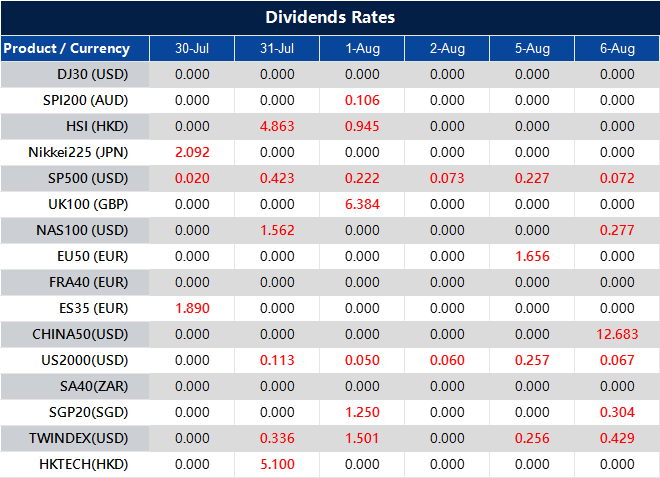
Please note that the dividends of the following products will be adjusted accordingly. Index dividends will be executed separately through a balance statement directly to your trading account, and the comment will be in the following format “Div & Product Name & Net Volume ”.
Please refer to the table below for more details:
The above data is for reference only, please refer to the MT4/MT5 software for specific data.
If you’d like more information, please don’t hesitate to contact info@vtmarkets.com.
As part of our commitment to provide the most reliable service to our clients, there will be MT4 server maintenance this weekend.
MT4 Maintenance Hours:
03th of August 2024 (Saturday) 09:00 – 13:00 (GMT+3)
Please note that the following aspects might be affected during the maintenance:
1. The price quote and trading management will be temporarily disabled during the maintenance. You will not be able to open new positions, close open positions, or make any adjustments to the trades.
2. There might be a gap between the original price and the price after maintenance. The gaps between Pending Orders, Stop Loss and Take Profit will be filled at the market price once the maintenance is completed. It is suggested that you manage the account properly.
Please refer to the MT4 software for the specific maintenance completion and marketing opening time.
Thank you for your patience and understanding about this important initiative.
If you’d like more information, please don’t hesitate to contact info@vtmarkets.com
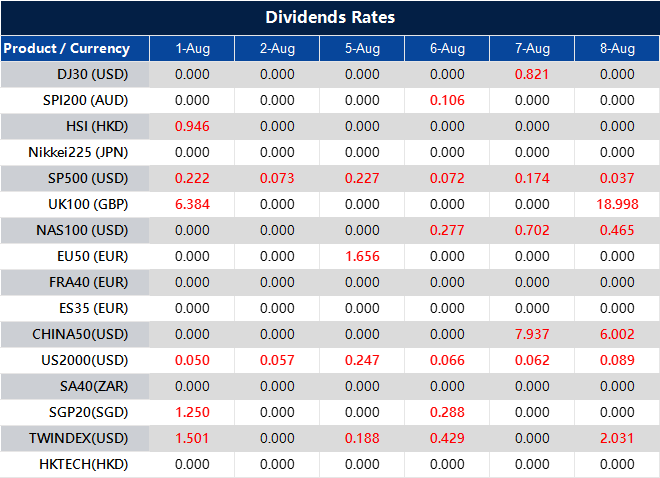
Please note that the dividends of the following products will be adjusted accordingly. Index dividends will be executed separately through a balance statement directly to your trading account, and the comment will be in the following format “Div & Product Name & Net Volume ”.
Please refer to the table below for more details:
The above data is for reference only, please refer to the MT4/MT5 software for specific data.
If you’d like more information, please don’t hesitate to contact info@vtmarkets.com.
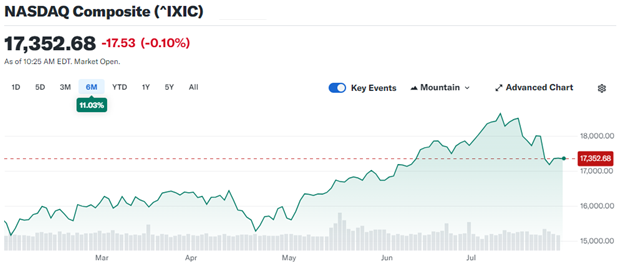
The US equity market increased by 3.20% in Q3 and 13.77% year-to-date, largely driven by AI-related stocks.
The price-to-fair value ratio of the US stock market rose to 1.03, indicating potential overvaluation.
Growth stocks are trading at a premium, while value stocks are at a discount, suggesting a strategic shift may be beneficial.
The third quarter of 2024 has seen intriguing developments in the US equities market, with attention on the performance of AI-related stocks.
As we approach the end of the quarter, investors are questioning whether the AI stock trade has reached its peak.
Q3 US Equity Market Boosted by AI-Driven Growth
As of June 24, the Morningstar US Market Index, representing the broad US equity market, increased by 3.20% for the quarter and 13.77% year-to-date.
This rise has been largely fueled by the performance of stocks related to artificial intelligence.
AI Stocks Leading the Charge
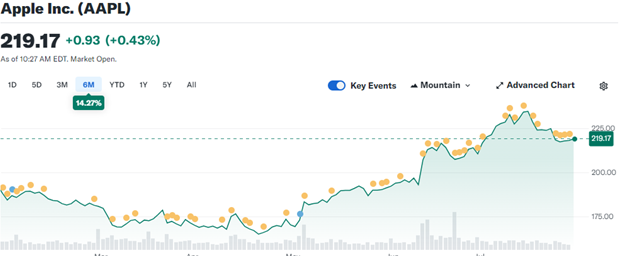
The second quarter’s gains were concentrated in a handful of AI-related stocks, including Nvidia (NVDA), Apple (AAPL), Microsoft (MSFT), Alphabet (GOOGL), and Broadcom (AVGO).
An attribution analysis reveals that without these gains, the broad market index would have declined. This trend raises questions about the sustainability of the AI-driven rally.
Market Valuation Concerns
The US stock market’s price-to-fair value ratio rose to 1.03, reflecting a 3% premium over fair value estimates as of June 24.
While this doesn’t yet signal an overvalued market, it places it near the higher end of the fair value range seen since 2010.
Historically, the market has only traded at this premium or higher 10% of the time.
The AI Surge and Its Implications
AI-related stocks continued to surge, heavily influencing the Morningstar US Growth Index and, to a lesser extent, the Morningstar US Core Index. Both indexes outperformed the Morningstar US Value Index.
However, based on current valuations, the outperformance of these AI stocks appears to be waning.
Growth vs. Value Stocks
Growth stocks traded at a 6% premium to Morningstar’s composite valuations, and core stocks at a 7% premium as of June 24. In contrast, value stocks remain attractively priced at a 9% discount.
This disparity suggests that long-term investors may benefit from shifting focus from overextended growth and core stocks to undervalued value stocks.
Sector Analysis and Investment Strategy
Given the current market dynamics, we recommend adjusting your investment strategy.
Growth and core stocks have become overextended due to the AI-driven surge, making it prudent to underweight these stocks. In contrast, value stocks present a better margin of safety and potential for future gains, warranting an overweight position.
Additionally, focusing on small-cap and mid-cap stocks is advisable, as these categories offer attractive valuations compared to the increasingly overvalued large-cap stocks.
Specific Sector Opportunities
While the broad market shows signs of overvaluation, there are specific sectors with promising opportunities:
Real Estate: Despite negative sentiment, real estate, particularly REITs with defensive characteristics, offers attractive investments.
Energy: The energy sector, trading at a discount, provides a natural hedge against geopolitical risks and persistent inflation.
Basic Materials: Select gold miners and agricultural chemical producers offer value, even in a slowing economy.
Shifting Focus to Value Stocks and Small Caps for Better Returns in 2024
The concentrated rally in AI stocks during the third quarter of 2024 has sparked worries about market overvaluation.
As we look forward, shifting focus from overvalued growth and core stocks to undervalued value stocks and smaller-cap opportunities may provide better investment returns. Stay informed and strategic to navigate this evolving market landscape effectively.
Please note that the dividends of the following products will be adjusted accordingly. Index dividends will be executed separately through a balance statement directly to your trading account, and the comment will be in the following format “Div & Product Name & Net Volume ”.
Please refer to the table below for more details:
The above data is for reference only, please refer to the MT4/MT5 software for specific data.
If you’d like more information, please don’t hesitate to contact info@vtmarkets.com.
The foreign exchange market, or Forex, is the world’s largest financial market, where currencies are traded against each other. If you’re a new trader venturing into the exciting world of Forex, understanding technical analysis is crucial. Technical analysis equips you with tools and knowledge to analyze historical price charts and identify potential trading opportunities. Let’s read further to find out more.
Types of Technical Analysis in Forex
Technical analysis encompasses various tools and techniques. Let’s explore some of the most common types used by beginner and experienced traders alike:
1. Trend Analysis
The first step is to identify the overall trend of the currency pair you’re interested in. This involves looking at the price movement over time. Is the price generally going up (uptrend), down (downtrend), or sideways (ranging)?
Trend lines: A simple yet effective way to visualize trends is by drawing trend lines. Connect a series of highs (uptrend) or lows (downtrend) to create a line that captures the overall direction.Example: Imagine you’re looking at the EUR/USD chart. You connect several higher lows, forming an upward-sloping trend line. This suggests an uptrend, and you might consider buying EUR/USD with the expectation that the price will continue to rise.
2. Support and Resistance Levels
As prices fluctuate, they tend to encounter certain price levels where buying or selling interest becomes concentrated. These price levels are called support and resistance.
Support: A price level where buying interest is likely to be strong, potentially halting or reversing a downtrend. The price might bounce off this level several times, acting as a floor.
Resistance: A price level where selling interest is likely to be strong, potentially halting or reversing an uptrend. The price might struggle to break above this level, acting as a ceiling.Example: Observe the EUR/USD chart again. You notice the price keeps bouncing off around 1.1000. This level is acting as a support zone, indicating potential buying interest at that price.
3. Price Action Trading
Price action trading focuses solely on analyzing the price movements themselves, without relying on additional indicators. Traders look for recurring price patterns, such as:
Head and shoulders: A reversal pattern indicating a potential trend change from bullish to bearish.
Double top/bottom: Two consecutive highs/lows at similar price levels, suggesting a possible trend reversal.
Flags and pennants: Consolidation patterns within a trend, often signaling a continuation of the trend after the breakout.
4. Technical Indicators
Technical indicators are mathematical calculations based on historical price and volume data, visualized on charts to provide additional insights.
Here are a few common examples:
Moving Averages (MA): This indicator smooths out price fluctuations by calculating the average price over a specific period. A 50-day MA, for instance, represents the average price of the past 50 days. If the current price is above the MA, it might suggest an uptrend, and vice versa.
Relative Strength Index (RSI): This indicator measures the momentum of price movements and helps identify potential overbought or oversold conditions. An RSI value above 70 might indicate an overbought market, suggesting a potential price pullback, while a value below 30 might suggest an oversold market, hinting at a possible price rebound.
Open a demo account today and start exploring the exciting world of technical analysis in forex trading!
FAQ
Q: What is technical analysis in forex trading?
A: Technical analysis involves analyzing historical price charts to identify potential trading opportunities based on price movements and patterns.
Q: Why is trend analysis important in forex trading?
A: Trend analysis helps traders understand the overall direction of the market, enabling them to make informed decisions about when to enter or exit trades.
Q: How do support and resistance levels impact trading decisions?
A: Support and resistance levels indicate potential price points where buying or selling interest is strong, helping traders identify entry and exit points.
Q: What are some common technical indicators used in forex trading?
A: Common indicators include Moving Averages (MA), Relative Strength Index (RSI), and Bollinger Bands, each providing different insights into market conditions.
Q: Can price action trading be effective without additional indicators?
A: Yes, price action trading focuses on analyzing price movements alone, making it effective for traders who prefer a simplified approach.
Q: How can I start practicing technical analysis in forex trading?
A: Open a demo account with VT Markets today and start exploring technical analysis tools and strategies in a risk-free environment.
Q: How does the moving average help in trading?
A: Moving averages help in identifying the direction of the trend and potential reversal points by smoothing out price data over a specified period.
Q: What is the role of volume in technical analysis?
A: Volume indicates the number of trades or contracts in a given period, helping traders confirm the strength or weakness of a price move.
Conclusion for Technical Analysis in Forex Trading
Technical analysis in forex trading provides a robust framework for making informed trading decisions. By understanding and applying trend analysis, support and resistance levels, price action trading, and technical indicators, traders can enhance their ability to predict market movements. Utilizing these tools effectively requires continuous learning and practice. Opening a demo account with VT Markets allows you to explore these techniques in a risk-free environment, helping you build confidence and refine your trading strategy.
Ready to enhance your forex trading skills? Open a demo account with VT Markets today and practice using technical analysis in a risk-free environment.
Here’s the twist: Not all that glitters are gold. You’re about to find out what exactly goes into the 2024 Olympic gold medal and why it’s worth examining the value of these precious metals.
2401874133
After a century, the 2024 Summer Olympics will see the games return to Paris.
All in for the win, the world’s top athletes dedicated years to their sport. Olympic champion Jess Fox is hoping to make it back-to-back gold this year and will be competing tirelessly to take home the ultimate symbol of glory—the Olympic gold medal.
The Paris Mint is manufacturing 5,084 medals. Of this number about 2,600 are for the Olympics and 2,400 for the Paralympics.
Each gold, silver, and bronze medal features an 18-gram hexagonal chunk of iron that was once part of the Eiffel Tower. The medals measure 85mm in diameter and 9.2mm in thickness.
Unlike any medals awarded since Athens 1896, LVMH’s Chaumet has taken up the challenge of combining these precious metals. They have brought the vision of modern Olympic medals to life, incorporating a small piece of Paris into each design.
Breaking down the composition of the gold medal
Silver gets the gold
You’d be forgiven thinking that the Olympics Paris 2024 gold medal is made of gold. The fact is that it isn’t made of gold at all. Only 6 grams are pure gold, used for plating.
95% of the Olympic gold medal is actually silver—505 grams, to be exact. The remaining 18 grams are iron.
The silver medal weighs 525 grams, with 507 grams of silver and 18 grams of iron. Based on the spot prices for silver and iron as of July 24, its value is around $486.
Based on VT Markets’ analysis, silver has been recognised as the top-performing commodity of 2024.Silver prices (Symbol: XAGUSD) have risen by 21% year-to-date in 2024, outperforming other metals like gold and copper, as well as the S&P 500 index.
The bronze medal weighs 455 grams, made up of 415.15 grams of copper, 21.85 grams of zinc, and 18 grams of iron. Its value is roughly $13.
Key stats behind the Paris 2024 medals
529g: the weight of the gold medal Gold plating: 6 grams Silver: 505 grams Eiffel Tower iron: 18 grams
525g: the weight of the silver medal Silver: 507 grams Eiffel Tower iron: 18 grams
455g: the weight of the bronze medal Copper: 415.15 grams Zinc: 21.85 grams Eiffel Tower iron: 18 grams
How much is the metal of an Olympic medal worth?
If these medals were made entirely of gold, they’d be worth around $41,161.50 each! That’s why the last time they handed out pure gold medals was way back in 1912.
While the monetary value of an Olympic medal is around $500, that doesn’t mean athletes don’t make money at all.
The payout for Olympic medalists varies by country— with Malaysia, Morocco, or Serbia receiving an upward of $200,000 from their country’s government or national Olympic committee for bringing home gold. The true value lies in its priceless pride of victory.
Medals with some history behind them have been sold for an excess of 1 million dollars on auction. The value of past gold medals has surged dramatically due to record gold prices. For example, one of Jesse Owens’ medals from 1936 sold for approximately $1,470,000.
US swimmer Michael Phelps is the most decorated Olympian with 23 golds, 3 silvers, and 2 bronze, earning him the title of “King of medals” in the Summer Olympics and an estimated net worth of $100 million.
This significant wealth comes from his exceptional swimming career, smart business investments, and profitable brand endorsements.
Hence, the 2024 Olympic medals not only symbolise athletic achievement but also reflect economic dynamics as metal prices continue to fluctuate.
This makes it an exciting time to examine the raw values of the commodities that make up the Olympic medals.
Although various financial instruments like options, futures, and ETFs are available for trading gold and other precious metals, their performance can differ significantly, especially depending on the broker offering them.
Much like a top Olympian, VT Markets’ CFD precious metals—gold (XAUUSD), silver (XAGUSD), and copper (CME)—demonstrate a competitive edge in a highly dynamic market. Trading with VT Markets offers advantages like ultra-low spreads and flexible leverage options up to 500:1.
With a diverse precious metals portfolio for you to choose from, it’s easy to optimise your trading strategy and align them with your preference. In the same way athletes compete in multiple events to increase their chances of winning, trading various precious metals like gold, silver, and platinum helps diversify your portfolio, spreading out risk.
Unleash your athletic spirit
In celebration of the 2024 Paris Olympics, VT Markets is running a once-in-four-years campaign where you could win up to USD 14,000 from our prize pool by trading with us. Complete simple daily missions to earn rewards and stay in the race to maximise your gains.
Please note that the dividends of the following products will be adjusted accordingly. Index dividends will be executed separately through a balance statement directly to your trading account, and the comment will be in the following format “Div & Product Name & Net Volume ”.
Please refer to the table below for more details:
The above data is for reference only, please refer to the MT4/MT5 software for specific data.
If you’d like more information, please don’t hesitate to contact info@vtmarkets.com.


