Wealth Expo Colombia gathers prominent leaders from the financial markets. Get ready to connect with exceptional fund managers, investors, and stock brokerages. This event offers a prime opportunity to enhance your knowledge, fine-tune your strategies, and forge valuable business relationships, all under one roof. Benefit from top-tier educational content and high-value networking with industry players in the financial markets. Join VT Markets for the following activities:
Keynote Speeches: Hear from industry leaders Expert Panels: Engage with professionals Specialized Workshops: Get hands on learning with our VT Markets’ Financial Market Analysis – Eduardo Ramos
Venue: Cl. 74 #13-27, Localidad de Chapinero, Bogotá, Cundinamarca, Colombia. Time: 9:30 am to 10:00 pm (GMT-5)
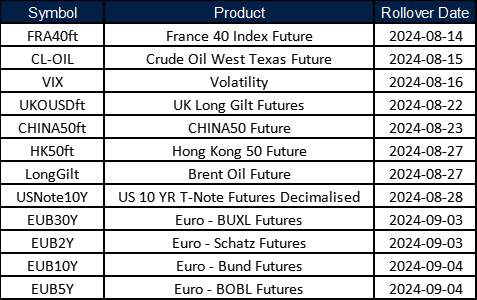
New contracts will automatically be rolled over as follows:
Please note:
• The rollover will be automatic, and any existing open positions will remain open.
• Positions that are open on the expiration date will be adjusted via a rollover charge or credit to reflect the price difference between the expiring and new contracts.
• To avoid CFD rollovers, clients can choose to close any open CFD positions prior to the expiration date.
• Please ensure that all take-profit and stop-loss settings are adjusted before the rollover occurs.
• All internal transfers for accounts under the same name will be prohibited during the first and last 30 minutes of the trading hours on the rollover dates.
If you’d like more information, please don’t hesitate to contact info@vtmarkets.com.
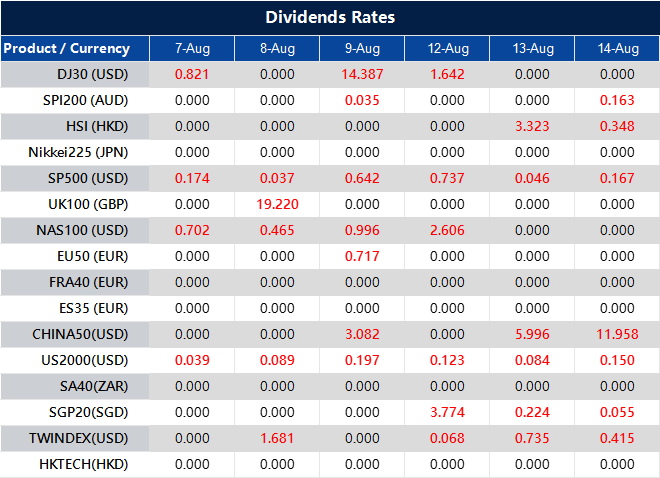
Please note that the dividends of the following products will be adjusted accordingly. Index dividends will be executed separately through a balance statement directly to your trading account, and the comment will be in the following format “Div & Product Name & Net Volume ”.
Please refer to the table below for more details:
The above data is for reference only, please refer to the MT4/MT5 software for specific data.
If you’d like more information, please don’t hesitate to contact info@vtmarkets.com.
Imagine the market as a bustling red carpet event, where every asset is a celebrity and every trader a paparazzi. Cameras flash, and eyes dart, seeking the hottest stars – the trends. In this fast-paced world, trend trading emerges as a strategy that not only keeps up with the glamour but also reaps the rewards of being in the right place at the right time.
Trend trading, akin to snapping a perfect photo of a celebrity at their peak, involves identifying and riding market trends.
The allure is undeniable: A trend trader follows the momentum of the market, capturing gains as the asset price moves in a consistent direction.
What is trend trading?
Trend trading is a strategy that involves analysing the price momentum of an asset in one direction – either up or down – and making trades based on the perceived continuation of this trend.
This approach capitalises on the idea that “the trend is your friend,” allowing traders to ride the waves of market movements.
Traders use various tools and indicators to identify trends, such as moving averages, trendlines, and momentum indicators like the Relative Strength Index (RSI).
These tools help in pinpointing the start and end of a trend, ensuring traders can enter and exit positions at optimal points.
The tools of the trade
Just like how a paparazzi needs a good camera, a trend trader requires specific tools to spot and follow trends. Here are some key instruments in the arsenal of a trend trader:
Moving averages
Moving averages smooth out price data to help identify the direction of a trend. The two most commonly used types are the Simple Moving Average (SMA) and the Exponential Moving Average (EMA).
Traders often use the 50-day and 200-day moving averages to gauge the overall trend.
Trend lines
Drawing trend lines on a chart helps traders visually identify the direction of the trend. An upward trend line is drawn by connecting the successive higher lows, while a downward trend line connects the lower highs.
Yes. YES. Nuff’ said
Technical indicators
Indicators like the Relative Strength Index (RSI), Moving Average Convergence Divergence (MACD), and Bollinger Bands provide additional insights into the strength and potential continuation of a trend.
These tools can signal overbought or oversold conditions, helping traders make informed decisions.
Strategies to be successful in trend trading
Trend trading can be implemented through various trading strategies, each with its unique approach to capturing market movements. Here are some popular ones:
Following the trend
This straightforward strategy involves identifying the direction of the trend and entering trades in the same direction.
For instance, if the market is in an uptrend, traders look for buying opportunities. Conversely, in a downtrend, they seek selling opportunities.
Trade the breakout
Breakout traders look for key levels of support and resistance. When the price breaks through these levels, it often signals the beginning of a new trend.
Traders enter positions as soon as the breakout occurs, aiming to capture the momentum of the new trend.
Make your entry during the pullback
In a trending market, prices often retrace or pull back before continuing in the original direction. Pullback traders wait for these retracements and enter positions at more favourable prices.
This strategy aims to capitalise on temporary price corrections within a trend.
Examples of trend trading
Apple (Symbol: AAPL)
The stock price of Apple has exhibited strong trends over the years. During its meteoric rise from 2009 to 2020, trend traders who entered into buy positions of AAPL when they identified an upward trend and held onto them profited significantly.
By following the trend and avoiding the urge to sell during minor pullbacks, these traders maximised their returns.
Euro vs US dollar (Symbol: EURUSD)
The EURUSD currency pair is one of the most traded in the forex market. Its price movements often exhibit clear trends.
For example, during the period of 2017 to 2018, EURUSD experienced a strong uptrend. Trend traders who recognised this upward momentum and entered buy positions profited as the euro strengthened against the dollar.
The pros and cons of trend trading
Here are the reasons why you should use trend as your friend, and what you should be looking out for when you decide to deploy trend trading as your strategy.
Pros
Simplicity: Trend trading is straightforward and easy to understand.
Profit potential: It allows traders to capitalise on significant market movements.
Flexibility: Can be applied to various markets, including stocks, forex and commodities.
Cons
Market Dependency: Relies heavily on the market trending in a clear direction.
Timing: Requires precise timing for entry and exit to maximise profits and minimise losses.
Volatility: Sudden market reversals can lead to significant losses.
Use trends as your friend as you navigate the financial markets
Trend trading, much like the pursuit of a paparazzi for the perfect shot, requires a keen eye, patience, and the ability to act swiftly. By understanding market trends and employing effective strategies, traders can capture the biggest market movements and turn them into profitable opportunities.
As with any trading strategy, continuous learning and adaptation are key to long-term success. Explore 1000+ assets being offered by VT Markets and tart your financial trading journey today!
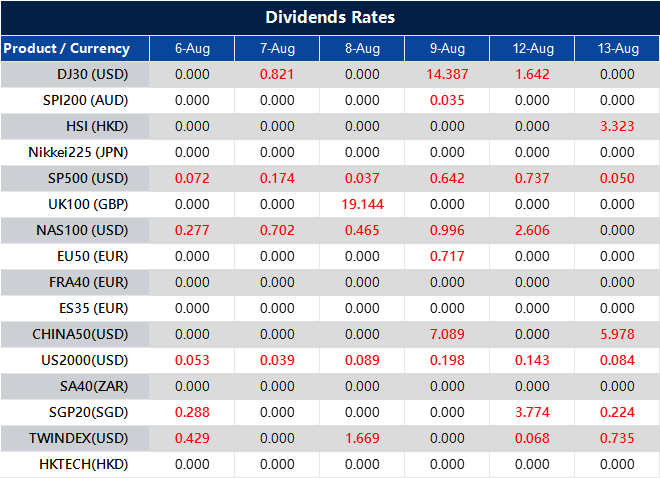
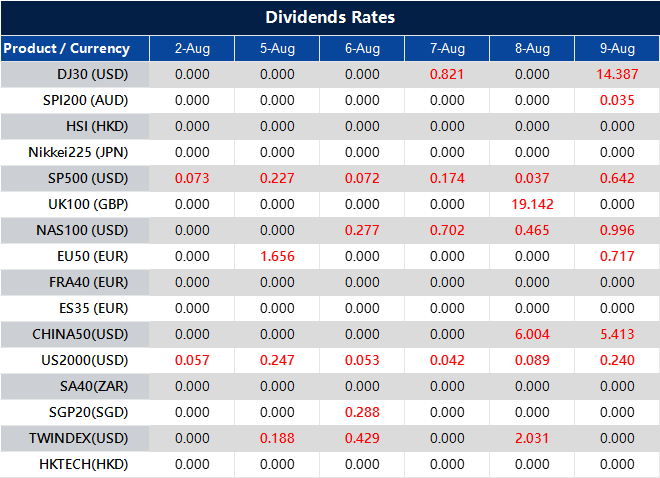
Please note that the dividends of the following products will be adjusted accordingly. Index dividends will be executed separately through a balance statement directly to your trading account, and the comment will be in the following format “Div & Product Name & Net Volume ”.
Please refer to the table below for more details:
The above data is for reference only, please refer to the MT4/MT5 software for specific data.
If you’d like more information, please don’t hesitate to contact info@vtmarkets.com.
This week’s market preview highlights the key events and data releases likely to drive market movements. Economic data so far are sparking Recession fears as a Global Stock sell-off sets to continue.
Key Economic Indicators
ISM Non-Manufacturing PMI (July):
A reading above 50 percent indicates the non-manufacturing sector economy is generally expanding, while below 50 percent signals contraction.
Given the large proportion of the US economy engaged in the services sector, this report offers crucial insights into the overall health of the US economy.
Crude oil inventories:
Weak manufacturing data and surging jobless claims weighed on the oil market, as worries about the U.S. economy outweighed the risk of regional conflict in the Middle East.
Initial jobless claims:
The weekly initial jobless claims report will be critical for assessing labour market conditions.
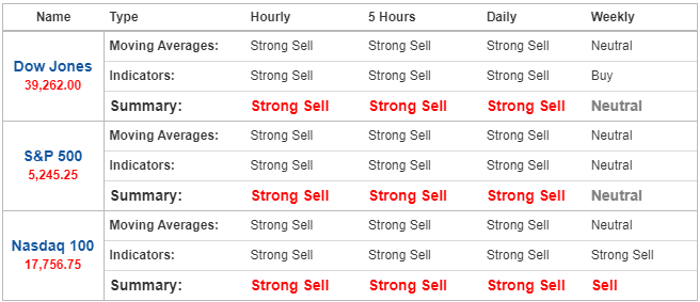
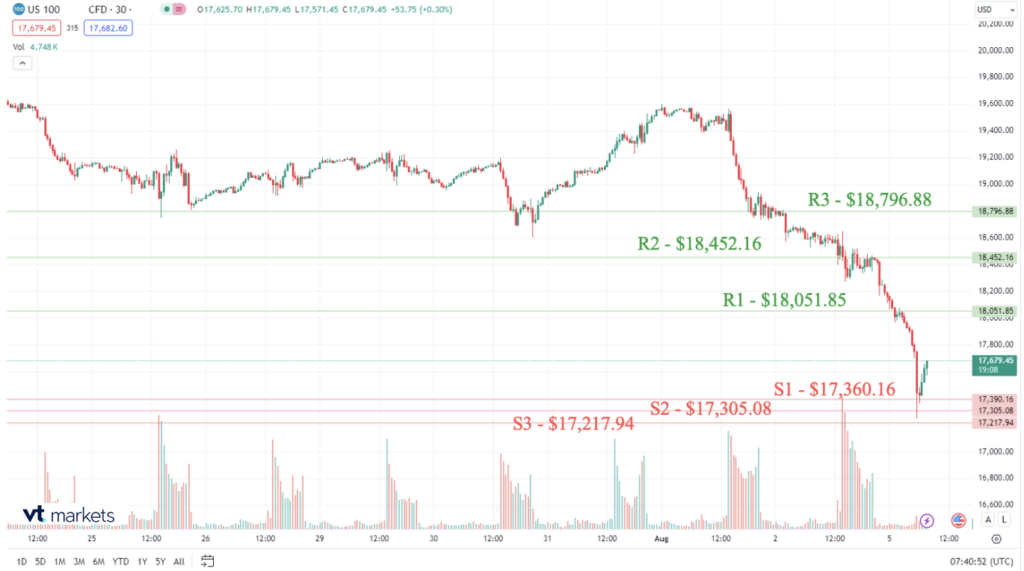
Index Market Dips on Recession Worries
This week saw a significant slide in the index market due to recession fears following key economic indicators such as GDP reports, inflation data, and employment reports. The Dow Futures, in particular, experienced a drop of more than 600 points after the Nasdaq fell into a correction.
Technical indications showing us a potential decline in the US Index market, according to Investing.com, amid Recession Fears after Key Economic data release.
S1-S3 mean potential Support points. If the market declines further, these are the potential levels it can reach.
R1-R3 mean potential Resistance points. If the market starts to increase again, these are the potential levels it can reach.
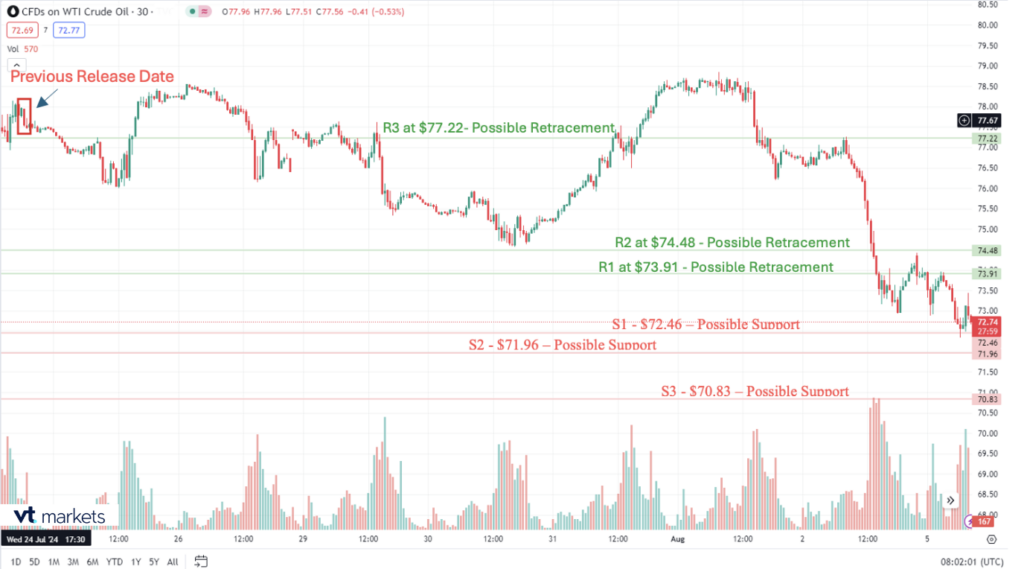
Crude Oil Inventories Expectations
The Inventory Report is scheduled to be released this Wednesday, 07 August 2024 at 15:30 GMT+1
Events since the last release of the Inventory Report
Saudi Aramco Hikes Oil Prices for First Time in Months
Chinese oil demand has been one of the biggest factors driving oil price movements lately, mostly determining a generally pessimistic mood on the market due to disappointing economic indicators and weaker oil import growth.
U.S. crude oil falls 2% as economic worries outweigh Middle East escalation.
Previous Report Figures and Forecast Figures for the latest release -3,436M (Barrels of Oil)
Gold Prices Rise Close to Record Highs Amid Recession Fears, Rate Cut Bets
Spot gold rose 0.4% to $2,453.51 an ounce, while gold futures expiring in December increased by 1% to $2,495.40 an ounce by 00:51 ET (04:51 GMT).
In the meantime, silver futures jumped 1.2% to $28.720 an ounce, reflecting increased demand for the metal, while platinum futures fell 0.8% to $958.40 an ounce, suggesting weaker market conditions for platinum.
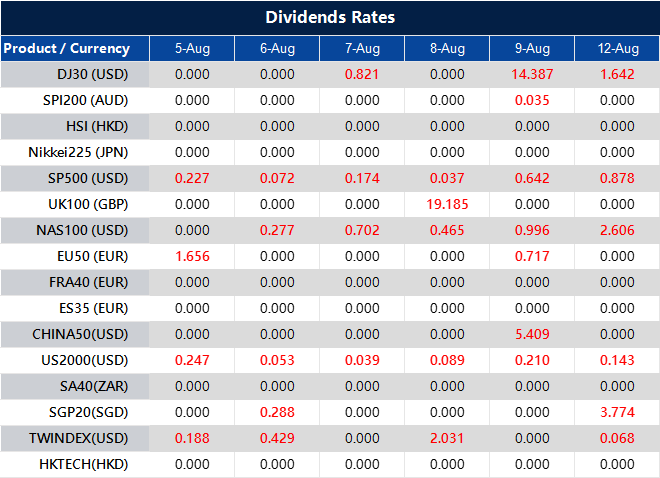
Please note that the dividends of the following products will be adjusted accordingly. Index dividends will be executed separately through a balance statement directly to your trading account, and the comment will be in the following format “Div & Product Name & Net Volume ”.
Please refer to the table below for more details:
The above data is for reference only, please refer to the MT4/MT5 software for specific data.
If you’d like more information, please don’t hesitate to contact info@vtmarkets.com.
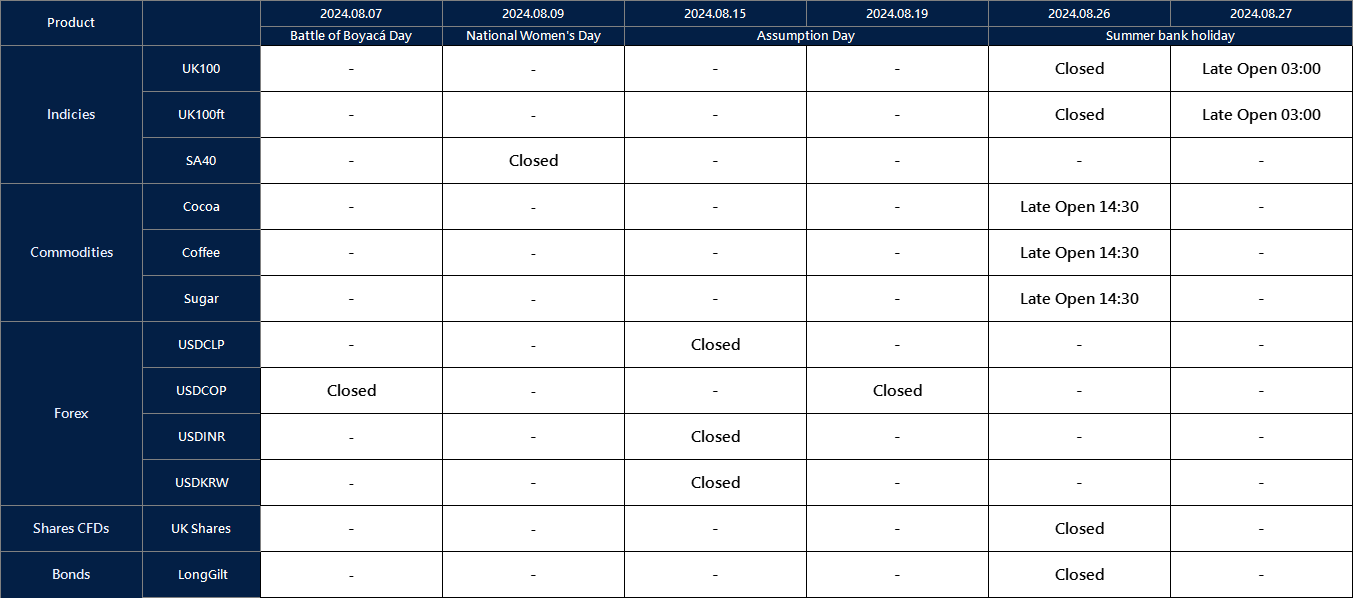
Affected by international holidays, the trading hours of some VT Markets products will be adjusted. Please check the following link for the affected products:
Please note that the dividends of the following products will be adjusted accordingly. Index dividends will be executed separately through a balance statement directly to your trading account, and the comment will be in the following format “Div & Product Name & Net Volume ”.
Please refer to the table below for more details:
The above data is for reference only, please refer to the MT4/MT5 software for specific data.
If you’d like more information, please don’t hesitate to contact info@vtmarkets.com.
As part of our commitment to provide the most reliable service to our clients, there will be MT4 server maintenance this weekend.
MT4 Maintenance Hours:
03th of August 2024 (Saturday) 09:00 – 13:00 (GMT+3)
Please note that the following aspects might be affected during the maintenance:
1. The price quote and trading management will be temporarily disabled during the maintenance. You will not be able to open new positions, close open positions, or make any adjustments to the trades.
2. There might be a gap between the original price and the price after maintenance. The gaps between Pending Orders, Stop Loss and Take Profit will be filled at the market price once the maintenance is completed. It is suggested that you manage the account properly.
Please refer to the MT4 software for the specific maintenance completion and marketing opening time.
Thank you for your patience and understanding about this important initiative.
If you’d like more information, please don’t hesitate to contact info@vtmarkets.com


