Choosing the right broker is often the most critical decision a trader makes. In this comprehensive VT Markets review, we dive deep into the platforms, fees, and real-world feedback that define this broker in 2026. Whether you are a scalper looking for raw spreads or a beginner seeking a reliable launchpad, this review by traders, for traders, covers everything you need to know.
Key Takeaways:
- Wide Range of Assets: Trade across 1,000+ instruments, including forex, gold, indices, and cryptocurrencies.
- Low Costs: Enjoy competitive spreads and no hidden fees on deposits or inactivity.
- Trusted Broker: Regulated by various legal bodies, with strong customer ratings of 4.4/5 on Trustpilot.
- Intuitive Platforms: Easy-to-use platforms like MT4, MT5, TradingView, and mobile apps.
- Educational Support: Access guides, tutorials, and webinars to boost your trading skills.
- Fast Execution: Known for quick withdrawals and efficient trade execution.
The Quick Verdict: Is VT Markets Right for You?
| Feature | Details |
| Regulatory bodies | Financial Sector Conduct Authority (FSCA) of South Africa, Financial Services Commission (FSC) of Mauritius, and Capital Market Authority (CMA) in the UAE |
| Minimum Deposit | $50 for all account types |
| Max Leverage | Up to 500:1 (Jurisdiction dependent) |
| Assets | Multi-Asset: 1,000+ symbols across Forex, Gold, Indices, Commodities, Share CFDs, ETFs, Bonds etc. |
| Platforms | MT4, MT5, VT Markets App, TradingView, WebTrader |
| Fund Safety | Segregated client funds and up to USD1 million client fund insurance |
| Trust Score | ⭐ 4.4/5 (Based on 2,200+ Trustpilot Reviews as of January 2026) |
If you’re looking for a broker that combines competitive pricing, a variety of assets, and a secure trading environment, VT Markets offers all these features. Its well-rounded platform is designed to meet the needs of both beginners and experienced traders, making it a versatile option in 2026. Whether your focus is on trading flexibility or educational support, VT Markets provides the tools and resources to help you succeed.
What is VT Markets?
If you’re considering entering the world of online trading, you might be asking, “What is VT Markets?” In this section, we’ll take a closer look at VT Markets, its offerings, and why it has become a popular choice for traders worldwide.
Founded in 2015, VT Markets has evolved into a global powerhouse serving over 160 countries. The broker is recognised for its “innovation-first” approach, aiming to bridge the gap between institutional-grade liquidity and retail accessibility.
As a global multi-asset broker that offers over 1,000+ financial instruments for trading, VT Markets provides a one-stop solution for traders to diversify their portfolios across a wide array of markets. Whether you are trading the volatility of the forex markets or diversifying with global ETFs, the platform is engineered to support professional-grade execution for every asset class.
Whether you’re new to trading or an experienced pro, VT Markets provides a secure and user-friendly platform for all types of traders. The platform offers a combination of advanced trading tools, educational resources, and competitive spreads to help traders succeed in a dynamic market.
Trust, Reputation, and Licensing Details
VT Markets is regulated by respected authorities, ensuring global compliance and trader protection:
- FSCA: VT Markets (Pty) Ltd is a Financial Services Provider (FSP No. 50865, Company Reg. No. 2015/072049/07), authorised and regulated by the Financial Sector Conduct Authority (FSCA) of South Africa.
- FSC: VT Markets Limited is authorised and regulated by the Financial Services Commission of Mauritius (License No. GB23202269).
- CMA: Licensed by the Capital Market Authority (License No. 20200000299, Category 5) for the regulated activities of introduction and promotion within the UAE.
These regulatory licenses ensure that VT Markets operates with transparency, providing a safe environment for traders. The platform has received numerous VT Markets reviews praising its regulatory compliance and trustworthiness.
Security Features, Data Protection, and Compliance
Security is a priority for VT Markets, with robust SSL encryption and two-factor authentication (2FA) keeping user data safe. The platform complies with global data protection regulations and adheres to anti-money laundering (AML) policies, which are crucial for maintaining a secure trading environment.
VT Markets Review: The Trader’s Perspective

Why do traders consistently leave positive VT Markets reviews? The answer lies in the execution model. Unlike market maker brokers that may trade against you, VT Markets utilises ECN (Electronic Communication Network) and STP (Straight Through Processing) technologies for trade execution. This ensures that your orders are sent directly to liquidity providers, providing a fairer and more transparent trading environment.
Verified User Feedback and Trustpilot Ratings
As of 2026, VT Markets maintains a strong reputation for reliability and customer satisfaction. The broker currently boasts a 4.4/5 Trust Score on Trustpilot, reflecting the confidence of thousands of active traders globally. This high rating is a testament to the broker’s commitment to maintaining institutional-grade standards for retail clients.
Trader Feedback Summary: “The general consensus among our community of traders highlights three specific wins: the speed of withdrawals, the reliability of the VT Markets App during high volatility, and the competitive ‘Raw’ spreads that actually stay at 0.0 pips during peak London/New York sessions.”
User Experience and Design
A smooth user experience is essential for traders, and VT Markets has designed its platform to be intuitive and easy to navigate.
1. Website Navigation, Accessibility, and Mobile Responsiveness
VT Markets is designed with both beginners and professionals in mind. The platform is straightforward to navigate, with a clean layout that helps users find the tools and resources they need quickly. Whether you’re using a desktop or mobile device, the platform is responsive and accessible, so you can trade from anywhere.
2. Visual Appeal and Overall User Interface
The design of VT Markets’ website is modern and clean, using a professional color palette to keep things simple. This minimalist approach ensures that traders can focus on what matters — making informed decisions and executing trades efficiently.
Educational and Trading Resources
For beginners, the availability of educational resources can make a huge difference, and VT Markets excels in this area.
1. Available Learning Tools, Guides, Webinars, and Tutorials
VT Markets offers an array of educational resources, including guides, insights, and webinars, to help traders of all levels improve their skills. Whether you are just starting or looking to sharpen your trading strategies, these materials will equip you with the knowledge you need.
2. Trading Resources for Both Beginners and Experienced Traders
In addition to the educational content, VT Markets provides advanced trading tools like real-time charts, market analysis, and trading signals, giving experienced traders an edge in the market.
3. User Engagement with Educational Content
VT Markets encourages users to engage with the educational materials, with opportunities for live webinars and interactive Q&A sessions. This creates an active learning environment, making it easier for traders to absorb and apply the content.
Pros and Cons of VT Markets: Is it the Best Low-Spread Broker in 2026?
When evaluating VT Markets in 2026, it is clear that the broker has refined its offering to cater to high-performance traders who prioritise speed and cost-efficiency. Below is a detailed breakdown of the advantages and critical considerations.
Advantages of Trading with VT Markets
1. Multi-Asset Access to 1,000+ Instruments
VT Markets has expanded its catalog to offer over 1,000 tradable assets, providing a one-stop solution for portfolio diversification.
- Forex: Access to 40+ major, minor, and exotic currency pairs.
- Commodities: Trade hard and soft commodities, including Gold, Silver, and Oil.
- Indices & Shares: CFDs on global stock indices and over 800 individual shares from the US, UK, EU, and HK markets.
- ETFs & Bonds: A selection of exchange-traded funds and bond CFDs for more sophisticated hedging strategies.
2. Institutional-Grade Spreads and Zero Fees
The platform is engineered for cost-effective trading, particularly for those using the Raw ECN Account.
- Ultra-Low Spreads: Raw spreads can drop to 0.0 pips during peak liquidity sessions, making it an ideal environment for scalpers.
- Zero Hidden Costs: VT Markets maintains a transparent fee policy with $0 inactivity fees and $0 deposit fees.
- Low Commissions: Competitive commission rates (e.g., $6 per round turn on Raw ECN and even as low as $0 for Pro ECN accounts) ensure that high-volume traders retain more of their profits.
3. High-Speed Execution via Equinix Fibre Optic Network
To minimise slippage and latency, VT Markets utilises a premium “innovation-first” infrastructure.
- Equinix Partnership: By housing servers in major financial hubs like New York (NY4) and London (LD5), VT Markets connects to a global fiber-optic backbone.
- oneZero™ Bridge: The integration of the oneZero™ MT4/MT5 Bridge allows for sub-millisecond execution speeds and access to deep liquidity pools.
- Reduced Slippage: This high-speed network ensures that orders are filled at the requested price even during periods of high market volatility.
Key Considerations and Risks
1. The Double-Edged Sword of High Leverage
VT Markets offers flexible leverage up to 1:500; in some cases, depending on the jurisdiction and asset class, the leverage is up to 2000:1.
- Reminder for traders: Leverage is a double-edged sword; while it can magnify gains, it equally amplifies potential losses. In a volatile market, a small price movement against your position can lead to a total loss of your initial investment or a margin call. Professional risk management, such as the use of stop-loss orders, is essential.
2. Regional Availability and Support
- Regional Availability: Due to global licensing requirements, VT Markets does not currently offer services to residents of certain jurisdictions, including but not limited to the United States, Singapore, or Russia.
For the other 160+ countries that VT Markets operates in, traders receive 24/7 multilingual support to ensure that their needs are addressed in a timely manner.
Conclusion
So, what’s the final verdict in this VT Markets review? VT Markets provides a secure, user-friendly trading platform that is well-regulated and backed by strong security features. The educational resources offered are top-notch, making it a great choice for beginners, while the advanced tools are perfect for experienced traders. Overall, VT Markets offers a balanced and reliable solution for traders looking to explore multiple asset classes in one place.
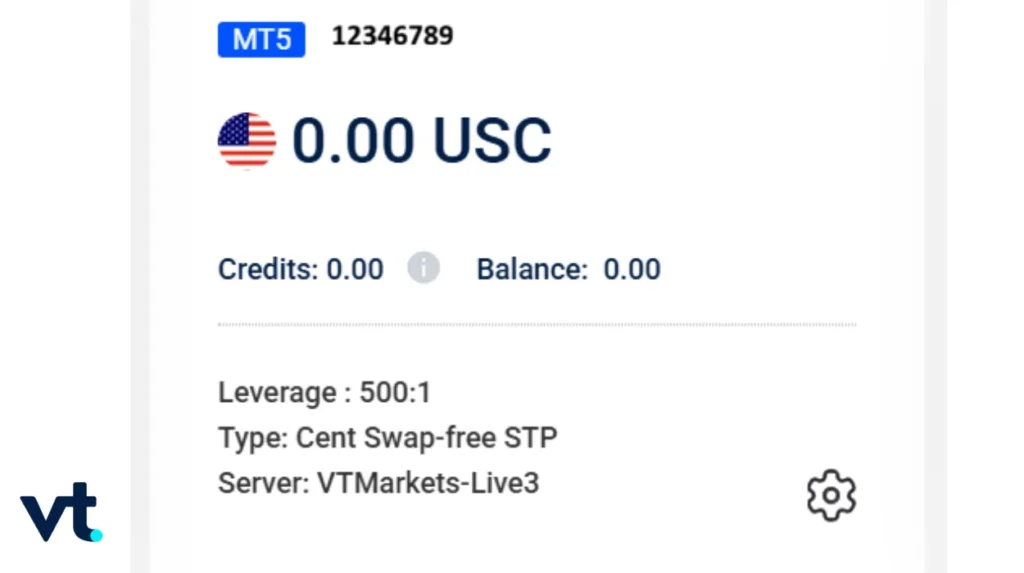
Why Choose VT Markets To Begin Your Trading Journey
VT Markets lowers the barrier to entry with a low starting capital requirement of $50 for all account types, including Cent accounts. As a true multi-asset broker, it allows beginners to hedge their strategies across Gold, Silver, and Bond CFDs rather than being limited to forex alone. With over 400,000 traders and eligible client fund insurance up to $1,000,000, it provides a secure foundation for growth.
Frequently Asked Questions (FAQs)
1. What do people say in their VT Markets review?
People often search for “VT Markets review” to get a sense of how the platform performs. Overall, the reviews are generally positive. Traders frequently highlight features like competitive spreads, reliable trade execution, and great customer support as key reasons for their satisfaction. The VT Markets review shows that many traders feel confident in using the platform, thanks to its strong reputation and consistent performance.
2. Is VT Markets a trustworthy platform?
Yes, VT Markets are regulated by multiple authorities, including FSC and CMA, ensuring a safe and transparent trading environment.
3. Can I trade on mobile with VT Markets?
Absolutely! VT Markets offers a fully mobile-responsive appthat allows you to trade anytime, anywhere.
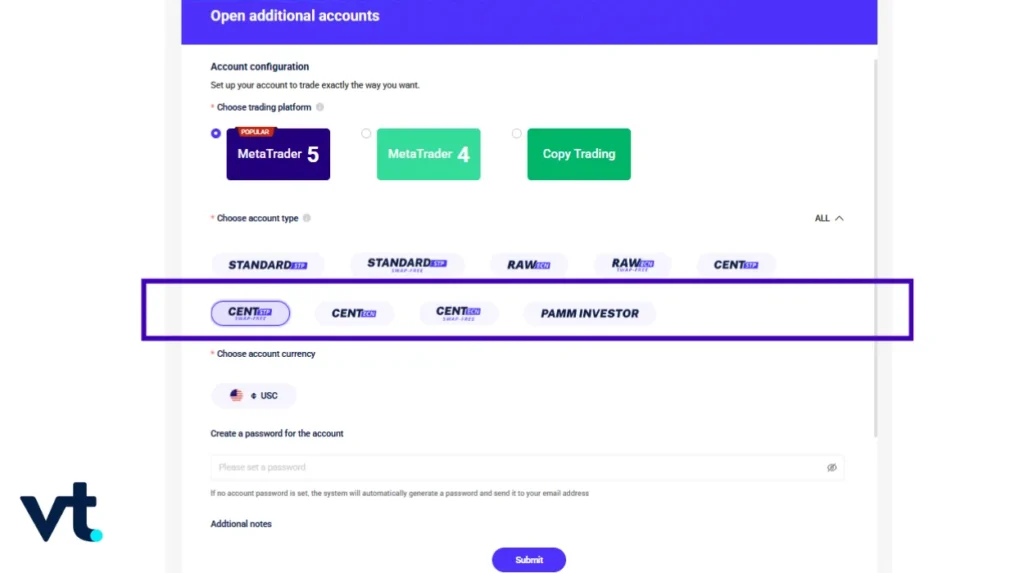
4. What types of accounts does VT Markets offer?
VT Markets offers several account types, including the Standard STP Account, Pro ECN Account, Swap-Free Account, and Cent Account. Additionally, demo accounts are available for beginners to practice trading.
5. Does VT Markets provide customer support?
Yes, VT Markets provides 24/5 customer support via live chat or email.
6. What assets can I trade on VT Markets?
VT Markets offers a wide range of assets, including forex, commodities, stock indices, and cryptocurrencies, giving traders plenty of options for diversifying their portfolios.
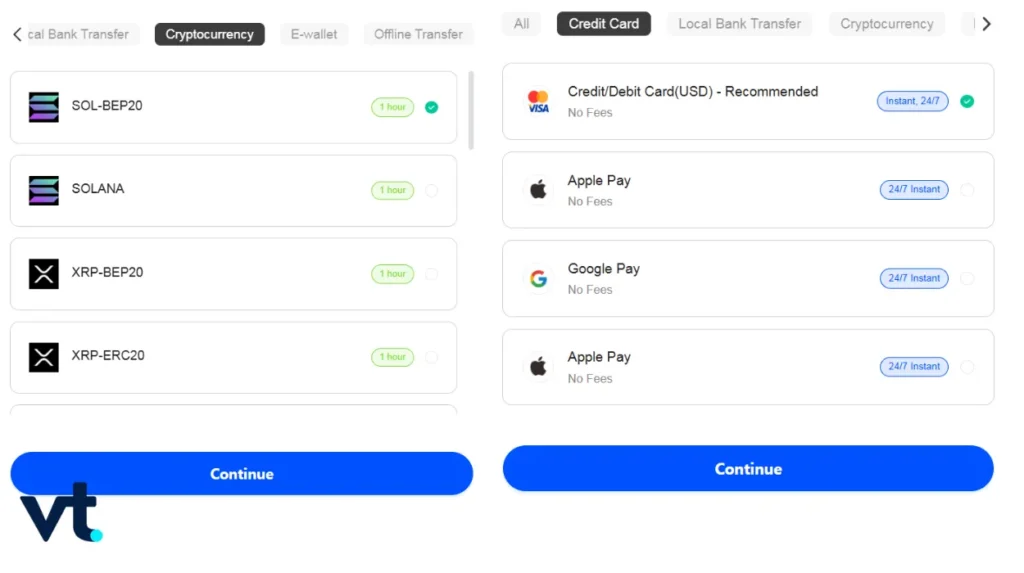
7. How can I deposit funds into my VT Markets account?
VT Markets offers various deposit methods, including credit/debit cards, bank transfers, cryptocurrencies, and e-wallets like PayPal, making it easy to fund your account.
8. Is there a minimum deposit required to start trading?
Yes, VT Markets typically require a minimum deposit of $50 to start trading. The exact amount depends on the type of account you choose, but it’s generally accessible for most traders.
9. What trading platforms does VT Markets offer?
VT Markets offers access to popular trading platforms, including MetaTrader 4 (MT4) and MetaTrader 5 (MT5), both known for their advanced charting and trading features. Additionally, traders can use the VT Markets App, which provides a user-friendly mobile trading experience for trading on the go.
10. Does VT Markets offer any bonuses or promotions?
Yes, VT Markets runs various promotions, including the deposit bonus and welcome bonus, to incentivise traders. These promotions may vary by region, so traders should check the platform for the latest offers available in their area.
11. How secure is my personal information with VT Markets?
VT Markets takes user privacy and security seriously, using SSL encryption and data protection measures to ensure that all personal and financial information is kept secure.
12. What makes VT Markets stand out from other brokers?
VT Markets stands out due to its strong regulatory framework, comprehensive educational resources, competitive spreads, and user-friendly platform.