What Is Technical Analysis? Trading Guide

Technical Analysis Explained: Things You Need to Know

In this article, you’ll learn what technical analysis is, how it differs from fundamental analysis, and how traders use it to forecast price movements. From identifying chart patterns to applying technical indicators, this guide covers the essential tools and strategies of technical analysis.

What is Technical Analysis?

In the world of financial markets, technical analysis is a powerful tool used to evaluate and predict price movements. But exactly what is technical analysis? It’s a method that studies historical price data, market trends, and patterns to forecast future price behavior. Unlike fundamental analysis, which focuses on evaluating a company’s financial health, technical analysis revolves around charts, indicators, and price action.

Traders rely on technical analysis to make informed decisions, as it provides actionable insights into entry and exit points for trades. Its popularity spans across markets like stocks, forex, commodities, and cryptocurrencies.

Why is Technical Analysis Important?

The significance of technical analysis lies in its ability to simplify the complexities of financial markets, making it an indispensable tool for traders.

1. Identifying Trends:

One of the primary advantages of technical analysis is its ability to help traders determine whether an asset is in an uptrend, a downtrend, or moving sideways. Recognizing these trends early enables traders to align their strategies with market direction, maximizing potential gains.

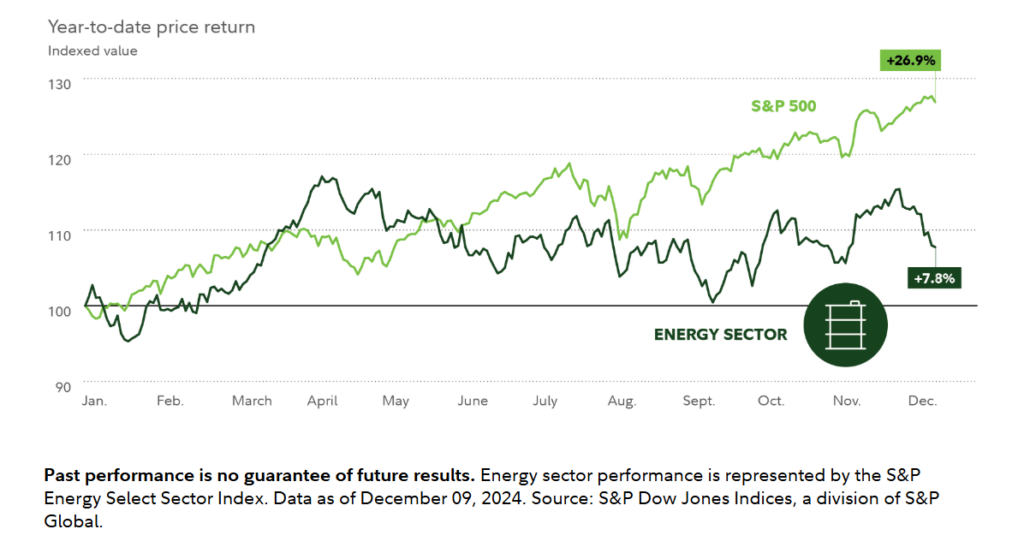
Example: A trader analyzing the S&P 500 might spot an uptrend over the past six months and decide to go long, capitalizing on the positive momentum.

Discover what trend analysis is and how to master it

2. Timing Trades:

By studying historical price movements, traders can pinpoint the best entry and exit points, allowing them to make well-timed decisions.

Example: In forex trading, observing a breakout on a EUR/USD chart using Bollinger Bands could signal an ideal moment to enter the market for a potential price surge.

3. Universal Application:

Technical analysis is versatile and can be applied across markets like stocks, forex, commodities, and cryptocurrencies.

Example: In cryptocurrency trading, identifying a Double Bottom pattern in Bitcoin’s price chart might suggest a bullish reversal, encouraging a trader to buy during the dip.

Types of Technical Analysis Tools

Mastering technical analysis requires a thorough understanding of the tools available, each designed to provide unique insights into market behavior. These tools are broadly categorized into charts, indicators, and patterns, all of which are essential for crafting effective trading strategies.

1. Charts: The Visual Backbone of Technical Analysis

Charts are the foundation of technical analysis, providing a visual representation of price movements over time. Different types of charts offer varying levels of detail and usability:

Line Charts 

Line charts connect the closing prices of an asset over a specific period, offering a clean, simple way to spot general trends in the market.

Example: A line chart of the S&P 500 might show a clear upward trajectory over the past year, helping traders identify a long-term bullish trend.

Bar Charts

Bar charts display detailed information on the open, high, low, and close (OHLC) prices, helping traders understand daily price ranges and volatility.

Example: A bar chart of Apple stock could show a large range between the high and low prices, signaling increased market activity on that day.

Candlestick Charts

Candlestick charts provide the same OHLC data as bar charts but in a more visually intuitive format, using color-coded candles to reflect bullish (green) or bearish (red) days.

Example: A candlestick chart of EUR/USD might highlight a bullish reversal pattern, such as a Hammer candle, signaling a potential price increase after a downtrend.

2. Indicators: Mathematical Tools for Market Insights

Indicators use mathematical formulas applied to price, volume, or open interest data to help traders interpret market conditions. Some of the most commonly used indicators include:

Moving Averages

Moving averages smooth out price data to help traders identify trends by calculating the average of prices over a specific period.

Example: A 50-day SMA crossing above a 200-day SMA (a “Golden Cross”) on Tesla stock indicates a bullish trend, prompting traders to consider buying opportunities.

Relative Strength Index (RSI)

RSI measures the momentum of price movements on a scale of 0 to 100, identifying overbought (above 70) or oversold (below 30) conditions.

Example: A reading of 75 on the RSI for EUR/USD suggests the pair is overbought, signaling a possible price pullback.

MACD (Moving Average Convergence Divergence)

MACD uses two moving averages to indicate momentum changes, with crossovers between the MACD and signal lines acting as key trading signals.

Example: A positive MACD crossover on the S&P 500 index signals growing bullish momentum, encouraging traders to look for long positions.

Bollinger Bands

Bollinger Bands plot standard deviation bands around a moving average, helping traders identify periods of high or low volatility.

Example: A stock’s price repeatedly hitting the upper Bollinger Band suggests it may be overbought and due for a correction.

3. Patterns: Recognizing Repeating Market Behaviors

Patterns help traders predict price direction based on historical tendencies. They fall into two main categories:

Chart Patterns:

Chart patterns provide clues about future price movement through shapes formed by price action on charts.

I. Head and Shoulders:

This chart pattern indicates a reversal from bullish to bearish trends, often signaling the end of an uptrend.

Example: A Head and Shoulders pattern on Apple stock might show three peaks, with the middle peak being the highest, suggesting a potential decline in price.

II. Flags and Pennants:

These patterns typically indicate a continuation of the current trend, with Flags appearing as rectangular price consolidations and Pennants as small symmetrical triangles.

Example: A bullish Flag on the gold price chart might indicate a temporary pause before the continuation of an upward rally.

III. Double Tops and Bottoms:

These patterns suggest a reversal in price direction, with Double Tops indicating bearish reversals and Double Bottoms signaling bullish reversals.

Example: A Double Bottom pattern on EUR/USD could show two nearly equal low points, suggesting a potential price increase.

Candlestick Patterns:

Derived from candlestick charts, these patterns offer insights into short-term price behavior.

I. Doji:

A candlestick pattern with a small body, the Doji signals market indecision and a potential reversal or continuation depending on its context.

Example: A Doji appearing after a strong uptrend in USD/JPY might suggest the trend is weakening.

II. Hammer:

A bullish reversal candlestick with a small body and a long lower wick indicates that buyers are stepping in after a downtrend.

Example: A Hammer on crude oil prices could signal a potential bounce back from recent lows.

Discover what inverted hammer candlestick pattern is.

III. Engulfing Patterns:

These patterns occur when one candlestick completely engulfs the previous one, signaling strong bullish or bearish momentum.

Example: A Bullish Engulfing pattern on the NASDAQ chart might indicate a strong buying opportunity after a downtrend.

Difference Between Technical Analysis and Fundamental Analysis

While both approaches aim to understand the market, their methodologies differ greatly:

AspectTechnical AnalysisFundamental Analysis
FocusPrice action, patterns, and market psychology.Economic data, financial health, and intrinsic value.
TimeframePrimarily short to medium-term.Medium to long-term investment horizons.
Key ToolsCharts, indicators (e.g., RSI, MACD), and patterns.Financial statements, P/E ratio, and macroeconomic data.
ApplicationUsed for trading decisions and market timing.Assessing asset value for investment purposes.
Market TypeSuitable for liquid, actively traded markets like forex and crypto.Best for stocks, bonds, and less volatile assets.
Data SourceHistorical price data and volume.Economic reports, earnings statements, and news.
Predictive ApproachAssumes trends and patterns repeat over time.Believes future performance depends on fundamentals.
Emotional InfluenceIncorporates market sentiment and psychology into decision-making.Focuses on rational analysis of financial health.
Speed of AnalysisRelatively quick, often real-time.Time-intensive, and requires deeper research.
Use CaseIdeal for day traders, scalpers, and swing traders.Preferred by long-term investors and value seekers.

For instance, a trader using technical analysis to assess gold prices would rely on price charts, patterns, and indicators like RSI or MACD, while a fundamental analyst would delve into supply-demand dynamics, geopolitical factors, and macroeconomic data to evaluate the asset’s intrinsic value.

Benefits of Technical Analysis

There are numerous advantages to incorporating trading technical analysis into your strategy:

Efficiency: Technical analysis simplifies decision-making by quickly identifying trading opportunities, such as spotting a Head and Shoulders pattern on Tesla’s stock chart to plan exits without extensive research.

Flexibility: Its tools are universally applicable across markets, like using RSI for forex momentum analysis or Bollinger Bands for crude oil volatility.

Timeliness: Real-time data in technical analysis enables swift decisions, such as acting on a Bitcoin breakout observed on a candlestick chart to seize trading opportunities.

Drawbacks of Technical Analysis

While technical analysis is powerful, it’s not without its limitations:

Reliance on Historical Data: Technical analysis depends on past price movements, but these don’t always predict future results, especially in unpredictable markets.

Subjectivity: Patterns like Head and Shoulders or Double Tops can be interpreted differently, leading to inconsistent conclusions among traders.

Market Volatility: Unexpected news events, such as geopolitical tensions or economic announcements, can invalidate even the most well-prepared technical analyses.

Conclusion

What is technical analysis, and why does it matter? Technical analysis is a key method for understanding market trends, identifying opportunities, and making informed decisions. While it relies on historical data and market psychology, its benefits, such as quick analysis, real-time decision-making, and universal application, make it invaluable for traders. While it has its challenges, the benefits often outweigh the drawbacks, making it an essential tool for traders across markets.

Learn Technical Analysis with VT Markets

VT Markets is a leading platform for learning and applying technical analysis strategies. With advanced charting tools, access to MetaTrader 4 and MetaTrader 5, user-friendly platforms, and a commitment to trader education, VT Markets equips you with the skills and confidence to excel in the financial markets.

Whether you’re a beginner or an experienced trader, VT Markets provides both a demo account and a live trading account for you to master trading technical analysis and succeed in your trading journey.

Frequently Asked Questions (FAQs)

1. What is technical analysis?

Technical analysis is the study of past market data—primarily price and volume—to forecast future price movements. It relies on chart patterns and technical indicators rather than economic data.

2. How does technical analysis differ from fundamental analysis?

Technical analysis focuses on market behaviour and historical price trends, while fundamental analysis examines the underlying economic and financial factors that affect an asset’s value.

3. Why is technical analysis important in trading?

Technical analysis helps traders identify patterns, trends, and entry/exit points, making it a vital tool for short-term and intraday trading strategies.

4. What are the common tools used in technical analysis?

Popular tools include moving averages, RSI (Relative Strength Index), MACD, Bollinger Bands, trendlines, candlestick patterns, and support/resistance levels.

5. Which markets can I analyse using technical analysis?

Technical analysis is applicable across forex, commodities, indices, bonds, and equities, making it versatile for any trader.

6. Can I combine technical and fundamental analysis?

Yes, you can combine both technical analysis and fundamental analysis. Many traders use technical analysis for timing their trades and fundamental analysis for understanding the broader market context.

Notification of Trading Adjustment in Holiday (Update) – Dec 24, 2024

Dear Client,

Affected by international holidays, the trading hours of some VT Markets products will be adjusted.

Please check the following link for the affected products:

Notification of Trading Adjustment in Holiday (Update)

Note: The dash sign (-) indicates normal trading hours.

Friendly Reminder:
The above data is for reference only, please refer to the MT4/MT5 software for specific data.

If you’d like more information, please don’t hesitate to contact info@vtmarkets.com

Dividend Adjustment Notice – Dec 23,2024

Dear Client,

Please note that the dividends of the following products will be adjusted accordingly. Index dividends will be executed separately through a balance statement directly to your trading account, and the comment will be in the following format “Div & Product Name & Net Volume ”.

Please refer to the table below for more details:

The above data is for reference only, please refer to the MT4/MT5 software for specific data.

If you’d like more information, please don’t hesitate to contact info@vtmarkets.com.

What Is Fundamental Analysis? Trading Guide

Fundamental Analysis Explained: Things You Need to Know

In this article, you’ll discover what fundamental analysis is, why it matters in financial markets, and how traders use it to make informed decisions. Whether you’re exploring the basics or looking to refine your fundamental trading strategy, this guide will walk you through the core concepts, key economic indicators, and practical applications.

What is Fundamental Analysis?

Fundamental analysis is a method used to determine the intrinsic value of an asset by evaluating various economic, financial, and qualitative factors. This approach examines elements like a company’s financial statements, industry trends, and broader economic conditions. Unlike technical analysis, which focuses on price movements, fundamental analysis digs deep into the underlying reasons for an asset’s performance.

Why is Fundamental Analysis Important?

Fundamental analysis provides traders and investors with a comprehensive understanding of an asset’s intrinsic value by focusing on long-term drivers of success. Unlike methods that react to short-term price movements, it evaluates economic trends, industry conditions, and company-specific metrics to identify undervalued or overvalued opportunities.

This approach is crucial for strategic decision-making and risk management, allowing investors to build stable, growth-focused portfolios. For example, analyzing Apple Inc.’s innovation, financial stability, and market position in the early 2000s helped investors capitalize on its long-term potential. By offering clarity on an asset’s true value, fundamental analysis empowers informed and confident investment decisions.

Types of Fundamental Analysis

Fundamental analysis is built on two key components: qualitative analysis and quantitative analysis, each offering unique insights into an asset’s value.

1. Qualitative Analysis

Qualitative analysis focuses on non-measurable, intangible factors that impact a company’s performance. It involves evaluating aspects that numbers cannot directly capture but are critical to understanding long-term value and growth prospects. Key areas include:

Management Quality: Leadership plays a crucial role in driving a company’s vision and strategy. For instance, the visionary leadership of Elon Musk at Tesla has been instrumental in its rapid growth and innovation in electric vehicles.

Brand Reputation and Customer Loyalty: A strong brand enhances customer trust and repeat business. Apple’s loyal customer base, driven by its reputation for quality and innovation, is a classic example of the power of qualitative factors.

Market Position and Competitive Advantage: Assessing whether a company holds a unique position in its industry, often referred to as its “economic moat.” For example, Amazon’s dominance in e-commerce and logistics showcases a significant competitive edge.

Qualitative analysis helps investors understand the “story” behind the company, offering insights into factors like adaptability, culture, and market potential.

2. Quantitative Analysis

Quantitative analysis focuses on numerical data and measurable metrics that reflect a company’s financial health and operational efficiency. It uses historical and current financial data to evaluate performance and predict future growth. Common metrics include:

Earnings Per Share (EPS): Indicates a company’s profitability on a per-share basis. Higher EPS suggests stronger performance.

Price-to-Earnings (P/E) Ratio: Compares a company’s share price to its earnings, helping investors assess whether a stock is overvalued or undervalued.

Revenue Growth: Measures a company’s ability to expand its operations and generate higher sales over time. For instance, Tesla’s consistent revenue growth is a strong indicator of its growing market presence.

Debt-to-Equity Ratio: Examines the company’s leverage, helping investors understand its financial stability.

Both approaches complement each other, with qualitative analysis providing context and vision, while quantitative analysis offers measurable validation. Combining these perspectives helps investors make well-rounded, informed decisions.

Top-Down Analysis vs Bottom-Up Analysis

1. Top-Down Analysis

The top-down approach begins with a broad perspective, analyzing global economic conditions and trends before narrowing the focus to industries and specific companies. This method ensures investments align with macroeconomic factors, helping to identify sectors poised for growth.

How It Works: Investors start by assessing global factors like GDP growth, inflation, and fiscal policies. From there, they identify industries benefiting from these trends, eventually selecting companies that are market leaders within those industries.

Advantage: Aligns investments with favorable economic conditions, reducing risks tied to underperforming sectors.

Example: An investor interested in renewable energy may evaluate international climate policies and sustainability initiatives. They might then focus on the renewable energy sector and select companies like Tesla for its innovation and leadership in electric vehicles.

2. Bottom-Up Analysis

The bottom-up approach focuses on individual companies first, emphasizing their financial health, competitive positioning, and growth potential. Broader economic trends are secondary, allowing this method to uncover opportunities even in challenging economic conditions.

How It Works: Investors analyze financial statements, management quality, and competitive advantages of specific companies. Broader trends are considered only after confirming a company’s intrinsic value.

Advantage: Identifies strong companies capable of thriving even during unfavorable market conditions.

Example: An investor evaluating Amazon might focus on its revenue growth, logistics innovation, and market dominance in e-commerce, irrespective of macroeconomic volatility.

Difference Between Fundamental Analysis and Technical Analysis

AspectFundamental AnalysisTechnical Analysis
FocusEvaluates the intrinsic value of an asset by analyzing economic, financial, and qualitative factors.Studies historical price patterns, volume, and market trends to predict future price movements.
ApproachLong-term focus, examining macroeconomic indicators, industry trends, and company-specific data.Short-term focus, using charts and technical indicators like moving averages and RSI to identify trade signals.
Data UsedEconomic reports, financial statements, industry analysis, and qualitative factors like management quality.Price charts, candlestick patterns, trading volume, and technical indicators.
ObjectiveLong-term investors are looking to build a stable portfolio based on asset fundamentals.To time market entries and exits by analyzing trends and predicting short-term price movements.
Tools and MethodsMetrics like P/E ratio, EPS, debt-to-equity ratio, and qualitative factors like competitive advantage and market trends.Tools like trendlines, Fibonacci retracements, MACD, and support/ resistance levels.
Examples of UseAssessing Apple Inc.’s financial health and innovation to decide on long-term investment potential.Identifying a breakout pattern in Tesla’s stock price to make a short-term trade.
Best Suited ForLong-term investors looking to build a stable portfolio based on asset fundamentals.Day traders and short-term investors aim to capitalize on price volatility and quick market movements.

Fundamental analysis is ideal for understanding the intrinsic value of an asset, making it more suited for long-term strategies. In contrast, technical analysis focuses on price action and patterns, catering to short-term trading needs. While both methods differ, they can complement each other when combined for a holistic investment strategy.

Benefits of Fundamental Analysis

Fundamental analysis offers several advantages for traders and investors:

Long-Term Perspective: Fundamental analysis focuses on understanding an asset’s intrinsic value, making it ideal for identifying long-term growth opportunities. Investors like Warren Buffett have successfully used this approach to uncover undervalued companies.

Data-Driven Insights: By relying on concrete financial data, such as earnings reports and economic indicators, fundamental analysis ensures decisions are based on factual information rather than market speculation.

Portfolio Optimization: This approach allows investors to analyze various industries and companies, enabling them to build a diversified portfolio that spreads risk across multiple sectors.

Strategic Advantage: Fundamental analysis uncovers opportunities that might be overlooked by short-term traders, helping investors align their strategies with long-term market trends and intrinsic value.

By leveraging these benefits, traders can make more informed decisions, achieving better outcomes in both stability and profitability.

Drawbacks of Fundamental Analysis

While fundamental analysis is powerful, it has its limitations:

Time-Consuming: Conducting in-depth research into economic trends, industry dynamics, and individual companies requires significant time and effort, making it less ideal for short-term trading or quick decision-making.

Market Irrationality: Even when the intrinsic value of an asset is accurately assessed, market prices can remain misaligned due to external factors such as speculation, market sentiment, or geopolitical events, causing short-term price volatility.

Subjectivity in Qualitative Factors: Evaluating elements like management quality, competitive advantages, or brand strength often involves personal judgment, leading to potential biases or inconsistencies among analysts.

Despite these drawbacks, fundamental analysis remains a powerful tool for long-term investors, especially when combined with other methods like technical analysis to provide a balanced and informed investment strategy.

Fundamental Analysis for Different Asset Classes

Forex (Foreign Exchange): In forex, fundamental analysis involves analyzing macroeconomic factors such as interest rate policies, inflation, GDP growth, and geopolitical stability. For instance, a rising interest rate in the U.S. might strengthen the dollar compared to other currencies.

Stocks: Fundamental analysis in stocks focuses on financial statements and valuation metrics like price-to-earnings (P/E) and price-to-book (P/B) ratios to assess a company’s financial health and growth potential.

Bonds: Investors evaluate credit ratings, interest rate trends, and the issuer’s debt-to-equity ratio to determine the reliability of the bond issuer and assess default risk.

Commodities: For commodities like crude oil or gold, fundamental analysis examines supply-demand dynamics, geopolitical events, and economic cycles that influence price movements.

Cryptocurrencies: While less traditional, fundamental analysis in cryptocurrencies considers factors like blockchain technology, adoption rates, and the utility of the coin to evaluate its long-term value.

Conclusion

Fundamental analysis is essential for understanding an asset’s intrinsic value and making informed investment decisions. By focusing on economic trends, industry performance, and company fundamentals, it helps identify opportunities and manage risks, making it a vital tool for long-term success.

Learn More with VT Markets

At VT Markets, we equip traders with powerful tools and resources to master fundamental analysis. Whether you’re analyzing stocks, commodities, or indices, our platform—featuring MetaTrader 4 and MetaTrader 5—provides real-time data, market insights, and a seamless trading experience.

Start trading with VT Markets and unlock the power of informed trading today.

Frequently Asked Questions (FAQs)

1. What is fundamental analysis?

Fundamental analysis is a method of evaluating the intrinsic value of an asset by examining related economic, financial, and geopolitical factors. It helps traders anticipate market movements based on real-world data.

2. How does fundamental analysis differ from technical analysis?

Fundamental analysis focuses on economic indicators, news, and financial statements to determine an asset’s value, while technical analysis studies historical price patterns and trading volume to forecast future price movements.

3. Why is fundamental analysis important in trading?

Fundamental analysis provides insights into the underlying drivers of market behavior, helping traders make informed decisions and develop long-term trading strategies.

4. What economic indicators are most relevant in fundamental analysis?

Key indicators include GDP, interest rates, inflation, employment data, consumer sentiment, and central bank decisions—all of which influence market trends and asset values.

5. Can I combine fundamental and technical analysis?

Yes, combining both fundamental analysis and technical analysis is a common practice. Many traders use fundamental analysis to determine overall market direction and technical analysis to identify precise entry and exit points.

6. What assets can be analyzed using fundamental analysis?

Fundamental analysis can be applied to a wide range of assets, including forex, stocks, commodities, indices, and bonds.

Why Is Gold So Valuable? 10 Reasons Explained

10 Reasons Why Gold is So Valuable?

In this article, we delve into the key reasons why gold is so valuable. From its historical significance and unique properties to its role in global markets and practical applications, this comprehensive guide explores the factors that have made gold a timeless and universal store of value.

What is Gold: The History of Gold

Gold has been treasured for thousands of years, symbolizing wealth, power, and beauty. Its discovery dates back to ancient civilizations like Mesopotamia and Egypt, where it was used for trade, ornamentation, and religious purposes. The allure of gold shaped economies, fueled explorations, and even ignited conflicts. Notably, the Gold Standard, implemented in the 19th century, established gold as the backbone of global currencies. Today, gold remains a coveted asset, transcending time as a symbol of enduring value.

Learn what gold trading is and how to trade gold

Why is Gold So Valuable?

Gold’s unique attributes have cemented its status as a universally valuable asset, captivating civilizations for centuries. Whether as a symbol of wealth, a practical material, or a financial safeguard, gold’s multifaceted appeal continues to stand the test of time. Here are 10 key reasons why it holds such high value:

1. Historical Significance

Gold’s significance has been tied to its symbolic representation of wealth and power. It has played an integral role in human history, shaping economic systems and societal hierarchies. Civilizations from Ancient Egypt to the Roman Empire leveraged gold for currency, ornamentation, and divine symbolism. This deep historical connection underpins humanity’s enduring trust in its value.

Example: The ancient Egyptians viewed gold as the “flesh of the gods,” often burying their pharaohs with gold artifacts to symbolize divine status and immortality.

2. Physical and Chemical Properties

Gold’s physical attributes are unparalleled. It is one of the few materials that does not tarnish or corrode, ensuring longevity. Its malleability allows it to be crafted into intricate designs, while its density provides a sense of substantiality that further enhances its perceived value. These properties make gold both aesthetically appealing and functionally durable.

Example: A 100-year-old gold necklace can look as pristine as it did on the day it was made, due to gold’s inability to tarnish or corrode.

3. Economic Hedge

Gold’s stability during times of economic uncertainty is unmatched. As a non-correlated asset, its value tends to rise when traditional financial markets falter. This role as a “safe haven” asset is why gold becomes a preferred investment during inflation, recessions, or geopolitical unrest.

Example: During the 2008 financial crisis, gold prices surged from approximately $870 to over $1,200 per ounce as investors sought safe-haven assets.

4. Global Acceptance

Gold’s universal appeal stems from its recognition as a store of value across cultures and nations. It acts as a global currency and a standard for trade. This widespread acceptance ensures liquidity, as gold can be easily converted into cash or other assets worldwide.

Example: In international trade, central banks use gold as a reserve asset to settle transactions, reinforcing its role as a universal currency.

5. Technological Applications

Beyond its aesthetic value, gold’s conductivity and resistance to corrosion make it essential in various industries. From high-end electronics to aerospace engineering, its practical applications in advanced technologies underscore its versatility and utility.

Example: Gold is widely used in high-end electronics, such as connectors and conductors in smartphones and computers, where its reliability ensures efficient performance. 

6. Rarity and Limited Supply

The finite availability of gold ensures its exclusivity. Unlike fiat currencies that can be printed, the supply of gold is constrained by mining limitations and natural occurrences. This scarcity, combined with its high demand, sustains its premium value.

Example: The average amount of gold extracted annually is 3,000 metric tons, yet demand consistently exceeds supply, maintaining its high market value.

7. Psychological Appeal

Gold’s lustrous appearance and symbolic associations with success and luxury create a psychological allure. It has become a marker of achievement, often celebrated in the form of awards, medals, and heirloom jewelry. This emotional connection further elevates its value in societal contexts.

Example: The FIFA World Cup trophy, adorned with 18-karat gold, is celebrated globally as a symbol of ultimate success in sports, reinforcing gold’s association with achievement and prestige.

8. Role in Central Banks and Reserves

Central banks worldwide maintain gold reserves as a hedge against currency fluctuations and as a tool for monetary policy. This institutional reliance underscores gold’s role in stabilizing global economies and reinforces its perceived importance.

Example: The U.S. Federal Reserve holds over 8,000 metric tons of gold, demonstrating its reliance on gold to stabilize monetary policy.

9. Investment Versatility

Gold’s adaptability as an investment is a significant factor in its value. It offers options ranging from physical holdings like coins and bars to digital forms like ETFs and CFDs. This flexibility caters to various investor profiles, ensuring its enduring relevance in financial markets.

Example: Gold ETFs have become increasingly popular, offering investors exposure to gold without the need for physical storage.

10. Cultural and Religious Significance

In many cultures, gold plays a pivotal role in traditions, rituals, and celebrations. Whether it is weddings in India or Lunar New Year gifts in China, these cultural practices drive consistent demand, further solidifying gold’s value.

Example: In Chinese New Year celebrations, gifting gold ornaments is a long-standing tradition symbolizing prosperity and good fortune, which also reinforces its value in cultural heritage.

Top 10 Gold-Producing Countries in the World

The table below highlights the leading nations in global gold production, showcasing their critical role in influencing the global gold market. 

CountryContribution and Key FeaturesAnnual Production (Metric Tons)
ChinaThe largest producer, contributing over 370 metric tons annually.370
AustraliaRenowned for its rich mines like Kalgoorlie and Newmont Boddington.330
RussiaA significant player with vast gold reserves.300
United StatesHome to the prolific Nevada mines.180
CanadaNotable for mining regions in Ontario and Quebec.170
PeruMajor South American contributor.120
South AfricaOnce the largest producer, it remains vital.90
MexicoRising in global rankings with increased output.110
IndonesiaHome to Grasberg, one of the world’s largest mines.100
UzbekistanA consistent producer with untapped potential.100

These 10 nations dominate the global gold production landscape, collectively contributing to the majority of gold supplied worldwide. China leads as the largest producer, consistently meeting high domestic and international demand. Australia’s rich mining regions bolster its global standing, while Russia leverages its vast reserves to maintain significant output. The United States and Canada continue to thrive due to technologically advanced mining operations. Emerging players like Mexico and Indonesia are steadily climbing the ranks, ensuring diversity in the global gold supply.

What Affects the Price of Gold?

Understanding the factors influencing gold prices is crucial for investors and policymakers to navigate market trends and make informed decisions.

Economic Conditions: Gold prices tend to rise during economic downturns as it is perceived as a safe asset, offering security against market volatility. When global stock markets face declines or recessions, gold’s stability attracts investors looking for reliable returns.

Inflation Rates: As inflation erodes the value of paper currencies, gold retains its purchasing power, boosting its appeal. Historical data shows that gold prices often correlate inversely with inflationary pressures, making it a trusted hedge.

Currency Strength: A weaker dollar often leads to higher gold prices since gold is priced in USD, making it more attractive globally. This relationship underscores gold’s value as a counterbalance to fluctuating currency strength.

Geopolitical Tensions: Events like wars, political unrest, or trade disputes increase demand for gold as a stable investment. For example, during periods of heightened geopolitical risk, gold’s price often spikes as uncertainty prompts investors to seek safe-haven assets.

Mining Output: Variations in gold production levels directly impact its supply, influencing prices. Declining ore grades or labor strikes in major gold-producing countries can limit supply and drive up prices.

Central Bank Policies: Buying or selling gold reserves by central banks can create significant market fluctuations. Central banks’ actions, like increasing gold reserves, can signal shifts in monetary policy, influencing global demand and price trends.

Why is Gold More Valuable Than Silver and Copper?

Gold’s intrinsic value surpasses that of silver and copper due to its rarity, unique physical properties, and cultural significance. While silver is abundant and primarily used industrially, gold’s scarcity and symbolic importance make it a premium choice for investment and ornamentation. Copper, widely used in construction and electrical wiring, lacks the universal appeal and monetary heritage that gold possesses. Additionally, gold’s resistance to tarnish and ability to retain its brilliance over centuries add to its unparalleled status.

How to Trade Gold

Trading gold opens up unique opportunities for both diversifying portfolios and preserving wealth, making it a valuable addition to any investment strategy.

Step 1: Understand the Gold Market

The first step to trading gold is gaining a deep understanding of how the market operates. Study gold price trends, historical data, and economic indicators that influence its value. Pay attention to factors such as inflation, currency strength, and geopolitical events, as these often drive price fluctuations.

Step 2: Choose a Trading Method

Choosing the right trading method is essential for success in gold trading. You can opt to buy physical gold, such as bullion, coins, or jewelry, for long-term holding and wealth preservation. Alternatively, you may invest in Gold ETFs, which offer a cost-effective way to track gold prices without handling physical assets. Another approach is trading gold futures or CFDs, which are suitable for short-term strategies aiming to capitalize on price fluctuations.

Step 3: Select a Reliable Broker

Choose a trusted broker with a proven track record in gold trading. Look for platforms like VT Markets that offer competitive spreads, user-friendly tools, and educational resources to support your trading journey.

Step 4: Open and Fund Your Trading Account

Once you have selected your broker, open a trading account and fund it with the required capital. Ensure your funds align with your risk tolerance and trading strategy.

Step 5: Open Your Position

Decide whether to go long (buy) or short (sell) based on your market analysis. Use tools provided by your broker, such as price charts and economic calendars, to make informed decisions.

Step 6: Monitor and Close Your Position

Continuously monitor your gold trades by keeping track of market developments and adjusting your positions as needed. When your profit target or stop-loss level is reached, close your position to secure gains or minimize losses.

Learn the 4 best gold trading strategies & tips

Conclusion

Gold’s enduring value lies in its historical significance, physical properties, and economic resilience. From ancient times to modern markets, it remains a cornerstone of wealth preservation and cultural significance. Understanding its appeal and the factors driving its value allows traders and investors to make informed decisions.

Trade Gold with VT Markets

VT Markets offers a seamless trading experience through advanced platforms such as MetaTrader 4 and MetaTrader 5, providing traders with sophisticated analytical tools, competitive low spreads, and direct access to global gold markets. Whether you’re new to trading or an experienced investor, VT Markets equips you with comprehensive resources to trade gold confidently. Start trading today with VT Markets and secure your financial future with gold.

Frequently Asked Questions (FAQs):

1. Why is gold so valuable?

Gold is valuable due to its historical significance, unique physical properties, limited supply, and enduring economic resilience. It serves as a reliable store of wealth and maintains cultural importance worldwide.

2. Why was gold valuable historically?

Historically, gold was valuable because it represented wealth, status, and power across various ancient civilizations. Its rarity, beauty, and resistance to decay made it ideal for currency, jewelry, and ceremonial objects.

3. What physical properties make gold expensive?

Gold’s distinctive properties, such as rarity, durability, malleability, resistance to corrosion, and natural beauty, significantly contribute to its high market value.

4. How does gold preserve wealth during economic uncertainty?

Gold is often seen as a safe-haven asset during times of economic volatility, inflation, or currency depreciation. Investors frequently turn to gold to safeguard purchasing power and mitigate risk during unstable financial periods.

5. What factors influence the cost of gold?

Several factors impact gold prices, including economic conditions, inflation rates, currency strength (especially the US dollar), interest rates, central bank policies, market demand, and geopolitical events.

6. Why is gold more costly than other precious metals?

Gold tends to be more costly than other precious metals due to its superior liquidity, consistent global demand, and widespread acceptance as a universal standard of value. Its unique combination of rarity, beauty, and versatility also sets it apart from metals like silver and platinum.

7. How to trade gold?

Follow these six simple steps to start trading gold effectively:

  • Understand the Gold Market
  • Choose a Trading Method
  • Select a Reliable Broker
  • Open and Fund Your Trading Account
  • Open Your Position
  • Monitor and Close Your Position

Dividend Adjustment Notice – Dec 20,2024

Dear Client,

Please note that the dividends of the following products will be adjusted accordingly. Index dividends will be executed separately through a balance statement directly to your trading account, and the comment will be in the following format “Div & Product Name & Net Volume ”.

Please refer to the table below for more details:

The above data is for reference only, please refer to the MT4/MT5 software for specific data.

If you’d like more information, please don’t hesitate to contact info@vtmarkets.com.

December Futures Rollover Announcement (Update) – Dec 20, 2024

Dear Client,

New contracts will automatically be rolled over as follows:

Please note:
• The rollover will be automatic, and any existing open positions will remain open.

• Positions that are open on the expiration date will be adjusted via a rollover charge or credit to reflect the price difference between the expiring and new contracts.

• To avoid CFD rollovers, clients can choose to close any open CFD positions prior to the expiration date.

• Please ensure that all take-profit and stop-loss settings are adjusted before the rollover occurs.

• All internal transfers for accounts under the same name will be prohibited during the first and last 30 minutes of the trading hours on the rollover dates.

If you’d like more information, please don’t hesitate to contact info@vtmarkets.com.

What’s coming to stock market in 2025? A practical guide for everyday investors

As 2024 draws to a close with remarkable gains—the S&P 500 up 30% and the Nasdaq soaring 35%—investors are naturally wondering what 2025 might bring. With artificial intelligence reshaping industries, interest rates in flux, and a post-election landscape ahead, the coming year promises to be fascinating for market watchers. Whether you are a casual investor or managing your retirement savings, understanding what might lie ahead can help you make more informed decisions.

Looking back to move forward

The market’s journey since 2022 tells an important story. After a challenging 2022 that saw nearly 20% decline due to rising interest rates, markets bounced back impressively with a 24% gain in 2023, followed by 2024’s stellar performance.

This pattern reminds us of a crucial truth: markets move in cycles, alternating between growth and downturns.

However, history suggests we should temper our expectations for 2025. Consecutive years of 20%-plus gains are relatively rare, having occurred only three times in market history. While this doesn’t guarantee a downturn, it suggests we might see more modest returns ahead.

The big picture: What’s driving the market?

The most transformative force shaping markets is artificial intelligence. Much like automobiles in the 1920s revolutionised society, AI is fundamentally changing how businesses operate.

Companies like Nvidia, which saw its stock rise 178% in 2024, exemplify this trend. AI investments are expected to grow at a 29% compound annual growth rate through 2028, creating opportunities across various sectors.

Interest rates and inflation will continue playing crucial roles. After seeing inflation fall below 3% in summer 2024, the Federal Reserve began lowering rates. Analysts expect three more rate cuts in 2025, which typically supports stock prices.

However, the spectre of persistent inflation hasn’t completely vanished, and the Fed’s actions will largely depend on economic data.

Global factors add another layer of complexity. China’s economic challenges might dampen demand for Western exports, while emerging markets in India and Africa show promising growth potential.

These dynamics create a mixed but interesting landscape for international investors.

Numbers in focus

Wall Street strategists offer varying predictions for 2025. Conservative estimates suggest the S&P 500 might end the year between 5,557 (a 5% decline) and 6,435 (a 10% gain). More optimistic forecasts point to 7,000, representing a 20% increase. Morgan Stanley, known for its measured outlook, predicts a 7% rise to around 6,500.

The technology sector shows particular promise, with AI spending projected to double between 2024 and 2028. This growth isn’t limited to AI—cloud computing, 5G networks, and cybersecurity are all expanding rapidly.

Market leaders in high-performance computing and semiconductor manufacturing are seeing unprecedented demand, particularly from data centres and AI applications.

Healthcare’s projected 7% annual growth through 2027 stems from three main factors: improved cost efficiencies through technology adoption, higher reimbursement rates, and new revenue streams from digital health solutions. Companies combining traditional healthcare with technological innovation are especially well-positioned.

The energy sector offers a balanced opportunity across both traditional and renewable sources. While fossil fuel demand remains strong, driven partly by AI technologies’ power requirements, renewable energy sources are seeing accelerated adoption.

This creates what analysts term a “barbell opportunity”—investors can benefit from both traditional energy stability and green energy growth potential.

These sectors might see additional benefits if interest rates decline in 2025, as lower borrowing costs could fuel further innovation and expansion.

Risk factors to consider

Several potential challenges could impact market performance in 2025.

The aftermath of the US presidential election might bring policy changes affecting trade relationships and corporate regulations. Ongoing geopolitical tensions, including conflicts in Ukraine and the Middle East, could disrupt global trade and commodity supplies.

Market valuations present another concern. The S&P 500’s forward price-to-earnings ratio remains above its 20-year average, suggesting stocks might be relatively expensive. This makes strong corporate earnings growth crucial for sustaining current price levels.

Some analysts, including Peter Berezin, chief global strategist at BCA Research, warn of potential sharp declines, with the S&P 500 possibly dropping to 4,450. While this represents a more pessimistic scenario, it reminds us of the importance of preparing for various outcomes.

Practical tips for everyday investors

Given this complex landscape, how should ordinary investors approach 2025?

First, diversification remains crucial. Consider spreading investments across different sectors and asset classes. The “barbell strategy” suggested by Morgan Stanley—combining both high- and low-risk assets—might be worth considering.

Technology and healthcare sectors offer growth potential, but don’t overlook traditional sectors that might benefit from economic changes. Environmental, Social, and Governance (ESG) investments continue gaining popularity, particularly in renewable energy and sustainable technologies.

For those holding cash or high-yield bonds, consider adjusting your strategy as interest rates decline. However, maintain some defensive positions given the potential for market volatility.

Looking ahead

While 2025 might not match 2024’s exceptional returns, it offers interesting opportunities for patient investors. The continuing AI revolution, changing interest rate environment, and evolving global economy create various paths for potential growth.

Successful investing isn’t about capturing every market move but staying committed to a well-structured strategy aligned with your goals. Markets have consistently rewarded patient investors who maintain discipline through different cycles, whether 2025 brings modest gains or temporary setbacks.

As you navigate the evolving market landscape, ensure your strategy is tailored to your objectives and circumstances. Open a live account with VT Markets today to access the tools and insights that can help you seize opportunities and stay ahead in the journey toward achieving your investment goals.

What’s coming to stock market in 2025? A practical guide for everyday investors

As 2024 draws to a close with remarkable gains—the S&P 500 up 30% and the Nasdaq soaring 35%—investors are naturally wondering what 2025 might bring. With artificial intelligence reshaping industries, interest rates in flux, and a post-election landscape ahead, the coming year promises to be fascinating for market watchers. Whether you are a casual investor or managing your retirement savings, understanding what might lie ahead can help you make more informed decisions.

Looking back to move forward

The market’s journey since 2022 tells an important story. After a challenging 2022 that saw nearly 20% decline due to rising interest rates, markets bounced back impressively with a 24% gain in 2023, followed by 2024’s stellar performance.

This pattern reminds us of a crucial truth: markets move in cycles, alternating between growth and downturns.

However, history suggests we should temper our expectations for 2025. Consecutive years of 20%-plus gains are relatively rare, having occurred only three times in market history. While this doesn’t guarantee a downturn, it suggests we might see more modest returns ahead.

The big picture: What’s driving the market?

The most transformative force shaping markets is artificial intelligence. Much like automobiles in the 1920s revolutionised society, AI is fundamentally changing how businesses operate.

Companies like Nvidia, which saw its stock rise 178% in 2024, exemplify this trend. AI investments are expected to grow at a 29% compound annual growth rate through 2028, creating opportunities across various sectors.

Interest rates and inflation will continue playing crucial roles. After seeing inflation fall below 3% in summer 2024, the Federal Reserve began lowering rates. Analysts expect three more rate cuts in 2025, which typically supports stock prices.

However, the spectre of persistent inflation hasn’t completely vanished, and the Fed’s actions will largely depend on economic data.

Global factors add another layer of complexity. China’s economic challenges might dampen demand for Western exports, while emerging markets in India and Africa show promising growth potential.

These dynamics create a mixed but interesting landscape for international investors.

Numbers in focus

Wall Street strategists offer varying predictions for 2025. Conservative estimates suggest the S&P 500 might end the year between 5,557 (a 5% decline) and 6,435 (a 10% gain). More optimistic forecasts point to 7,000, representing a 20% increase. Morgan Stanley, known for its measured outlook, predicts a 7% rise to around 6,500.

The technology sector shows particular promise, with AI spending projected to double between 2024 and 2028. This growth isn’t limited to AI—cloud computing, 5G networks, and cybersecurity are all expanding rapidly.

Market leaders in high-performance computing and semiconductor manufacturing are seeing unprecedented demand, particularly from data centres and AI applications.

Healthcare’s projected 7% annual growth through 2027 stems from three main factors: improved cost efficiencies through technology adoption, higher reimbursement rates, and new revenue streams from digital health solutions. Companies combining traditional healthcare with technological innovation are especially well-positioned.

The energy sector offers a balanced opportunity across both traditional and renewable sources. While fossil fuel demand remains strong, driven partly by AI technologies’ power requirements, renewable energy sources are seeing accelerated adoption.

This creates what analysts term a “barbell opportunity”—investors can benefit from both traditional energy stability and green energy growth potential.

These sectors might see additional benefits if interest rates decline in 2025, as lower borrowing costs could fuel further innovation and expansion.

Risk factors to consider

Several potential challenges could impact market performance in 2025.

The aftermath of the US presidential election might bring policy changes affecting trade relationships and corporate regulations. Ongoing geopolitical tensions, including conflicts in Ukraine and the Middle East, could disrupt global trade and commodity supplies.

Market valuations present another concern. The S&P 500’s forward price-to-earnings ratio remains above its 20-year average, suggesting stocks might be relatively expensive. This makes strong corporate earnings growth crucial for sustaining current price levels.

Some analysts, including Peter Berezin, chief global strategist at BCA Research, warn of potential sharp declines, with the S&P 500 possibly dropping to 4,450. While this represents a more pessimistic scenario, it reminds us of the importance of preparing for various outcomes.

Practical tips for everyday investors

Given this complex landscape, how should ordinary investors approach 2025?

First, diversification remains crucial. Consider spreading investments across different sectors and asset classes. The “barbell strategy” suggested by Morgan Stanley—combining both high- and low-risk assets—might be worth considering.

Technology and healthcare sectors offer growth potential, but don’t overlook traditional sectors that might benefit from economic changes. Environmental, Social, and Governance (ESG) investments continue gaining popularity, particularly in renewable energy and sustainable technologies.

For those holding cash or high-yield bonds, consider adjusting your strategy as interest rates decline. However, maintain some defensive positions given the potential for market volatility.

Looking ahead

While 2025 might not match 2024’s exceptional returns, it offers interesting opportunities for patient investors. The continuing AI revolution, changing interest rate environment, and evolving global economy create various paths for potential growth.

Successful investing isn’t about capturing every market move but staying committed to a well-structured strategy aligned with your goals. Markets have consistently rewarded patient investors who maintain discipline through different cycles, whether 2025 brings modest gains or temporary setbacks.

As you navigate the evolving market landscape, ensure your strategy is tailored to your objectives and circumstances. Open a live account with VT Markets today to access the tools and insights that can help you seize opportunities and stay ahead in the journey toward achieving your investment goals.

Dividend Adjustment Notice – Dec 19,2024

Dear Client,

Please note that the dividends of the following products will be adjusted accordingly. Index dividends will be executed separately through a balance statement directly to your trading account, and the comment will be in the following format “Div & Product Name & Net Volume ”.

Please refer to the table below for more details:

The above data is for reference only, please refer to the MT4/MT5 software for specific data.

If you’d like more information, please don’t hesitate to contact info@vtmarkets.com.

Back To Top
server

Hello there 👋

How can I help you?

Chat with our team instantly

Live Chat

Start a live conversation through...

  • Telegram
    hold On hold
  • Coming Soon...

Hello there 👋

How can I help you?

telegram

Scan the QR code with your smartphone to start a chat with us, or click here.

Don’t have the Telegram App or Desktop installed? Use Web Telegram instead.

QR code