Nvidia’s recent share decline highlights how quickly market sentiment can shift when global trade tensions and policy changes come into play. With fresh US export restrictions targeting AI chip sales to China and rising concerns over tariff-related uncertainty, investors are reassessing the outlook for the semiconductor sector. As pressure mounts across major chipmakers and broader economic risks re-emerge, Nvidia finds itself at the centre of a cautious and increasingly fragile market environment.
Nvidia shares slump as chip export restrictions weigh on sentiment
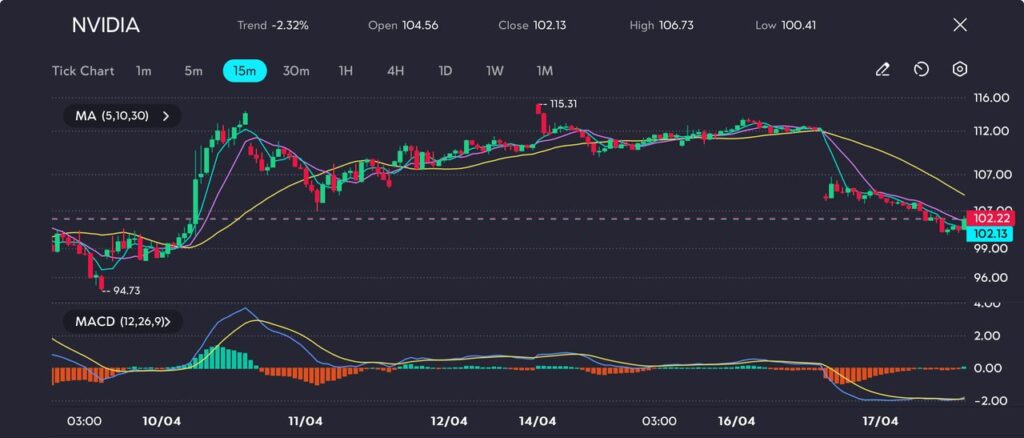
Nvidia’s share price continued to slide on Thursday, finishing the session at USD 102.13, marking a 2.32% decline. The drop follows the company’s recent revision of its revenue forecast, prompted by fresh US restrictions on AI chip exports to China.
Nvidia Warns Trump Curbs on China Chips to Cost $5.5 Billion. Hear about that and other companies making news on Wall Street today with Stock Movers from Bloomberg https://t.co/eoWUjS5CaI
Nvidia now anticipates a revenue loss of up to USD 5.5 billion in its fiscal first quarter due to these regulatory changes.
The announcement reverberated throughout the global semiconductor sector, with peer ASML also sounding the alarm. The Dutch chipmaker warned that uncertainty surrounding potential Trump-era tariffs could impact the industry through 2025 and 2026, triggering a sharp 6% fall in its share price.
Broader sentiment across chipmakers remains fragile, and attention now turns to TSMC’s upcoming earnings, which will be closely watched as a key indicator of sector health amid escalating trade tensions.
Meanwhile, Federal Reserve Chair Jerome Powell added to investor caution, noting that protectionist policies could dampen economic growth while fuelling inflation, placing the central bank in a difficult position.
Despite Powell’s slightly dovish undertones, fears of stagflation are creeping in—a scenario typically unfavourable for growth stocks, especially high-beta names like Nvidia.
On the 15-minute chart, Nvidia exhibits signs of a momentum shift, indicating a possible short-term correction following a strong rally. After a breakout from the USD 94.73 low, the stock surged to a recent high of USD 115.31, forming a potential swing top.
Bearish crossover on MACD adds weight to NVIDIA’s descending trend, as seen on the VT Markets app.
Since then, price action has weakened, falling below short-term moving averages and settling near USD 102.13.
The MACD indicator reinforces this bearish narrative, with the MACD line crossing below the signal line and the histogram staying negative—pointing to sustained downward momentum.
The divergence between the 5, 10, and 30-period moving averages further highlights growing selling pressure and diminishing bullish strength.
Currently, price is hovering just above a critical support level in the USD 100–USD 101 range. A break below this zone could trigger a decline toward the USD 98–USD 99 area, especially if market sentiment remains cautious.
On the upside, any bounce would need to clear the USD 105–USD 106 resistance to challenge the bearish outlook.
With Nvidia trading below the 30-period moving average and technicals showing signs of fatigue, a retest of the USD 100–USD 98 support region appears likely.
Any recovery would require a positive catalyst, such as encouraging earnings from TSMC or a shift in US trade policy.
In the short term, resistance sits at USD 106–USD 107, while a meaningful rally above USD 110 seems unlikely without a broader turnaround in sentiment.
On Wednesday, 16 April 2025, global markets are poised for significant movements as investors digest key economic data releases and central bank communications amid ongoing trade tensions and market volatility.
KEY INDICATORS
Central bank activities
Federal Reserve: Chairman Jerome Powell is scheduled to speak, with markets closely monitoring for any indications regarding future monetary policy amid current economic uncertainties.
Bank of Canada: Holding a policy meeting today, with a 40% probability of a rate cut priced in by markets, reflecting concerns over economic growth and inflation.
United States
Retail sales (March): Expected to rise by 1.4% month-on-month, indicating potential resilience in consumer spending despite recent economic headwinds.
Industrial production (March): Forecast to decline by 0.2%, suggesting a slowdown in manufacturing activity.
Manufacturing and trade inventories and sales: Scheduled for release at 9:00 am ET, providing insights into business inventory levels and sales trends.
EIA crude oil inventory report: Will offer data on US oil stockpiles, potentially influencing energy markets.
United Kingdom
Consumer price index (March): Inflation slowed to 2.6% year-on-year, down from 2.8% in February, primarily due to declining fuel prices and stable recreation and culture costs.
Core CPI (March): Also decreased, reflecting easing price pressures in the UK economy.
MARKET MOVERS
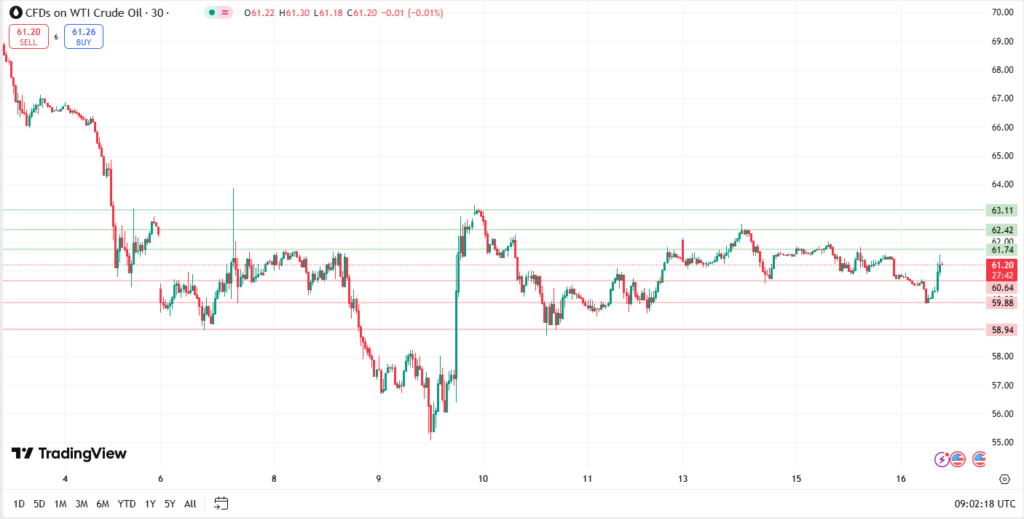
Crude Oil WTI
Possible short preference
Short positions below 60.64 with targets at 59.88 and 58.94 in extension.
Alternative scenario
Above 61.74, look for further upside with 62.42 and 63.11 as targets.
The RSI shows downside momentum.
Oil slips as markets assess impact of US-China trade war
Oil prices fell on Wednesday as shifting US tariff policies and the US-China trade war prompt traders to consider the potential impact on economic growth and energy demand.
Brent crude futures fell 39 cents, or 0.6%, to USD 64.28 a barrel by 7:58 AM GMT.
US West Texas Intermediate crude dropped 43 cents, or 0.7%, to USD 60.90.
Concerns over Trump’s escalating tariffs, combined with rising output from the OPEC+ group — comprising OPEC and allies such as Russia — have already dragged oil prices down by about 13% this month.
Trump has ratcheted up tariffs on Chinese goods to eye-watering levels, prompting Beijing to slap retaliatory duties on US imports in an intensifying trade war between the world’s two biggest economies.
Data on Wednesday showed China’s gross domestic product (GDP) grew 5.4% year on year in the first quarter, beating the 5.1% expected in a Reuters poll.
Meanwhile, US crude oil stocks rose by 2.4 million barrels in the week ended 11 April.
Petrol inventories fell by 3 million barrels and distillate stocks dropped by 3.2 million barrels.
Gold prices hit record high near USD 3,300/oz on trade jitters, Nvidia warning
Gold prices hit a record high in Asian trade on Wednesday, benefiting from sustained safe haven demand as markets fretted over US-China trade tensions and an impairment warning from Nvidia.
The yellow metal was also aided by weakness in the dollar, as investors dumped US Treasuries amid heightened uncertainty over the US economy under President Donald Trump.
Spot gold jumped 1.7% to a record high of USD 3,283.63 an ounce.
Gold futures expiring in June hit a peak of USD 3,299.52/oz.
Gold upbeat as US trade jitters persist
This came as Trump dialled up trade pressure on China with a cumulative 145% levy.
China retaliated with a 125% tariff on US imports.
However, Trump’s administration signalled that electronics were exempt from his 145% levy on China, while he also recently announced a 90-day exemption from his reciprocal tariffs on other countries.
Other precious metals were mixed amid heightened risk aversion:
Platinum futures fell 0.1% to USD 968.95/oz.
Silver futures rose 0.5% to USD 32.455/oz.
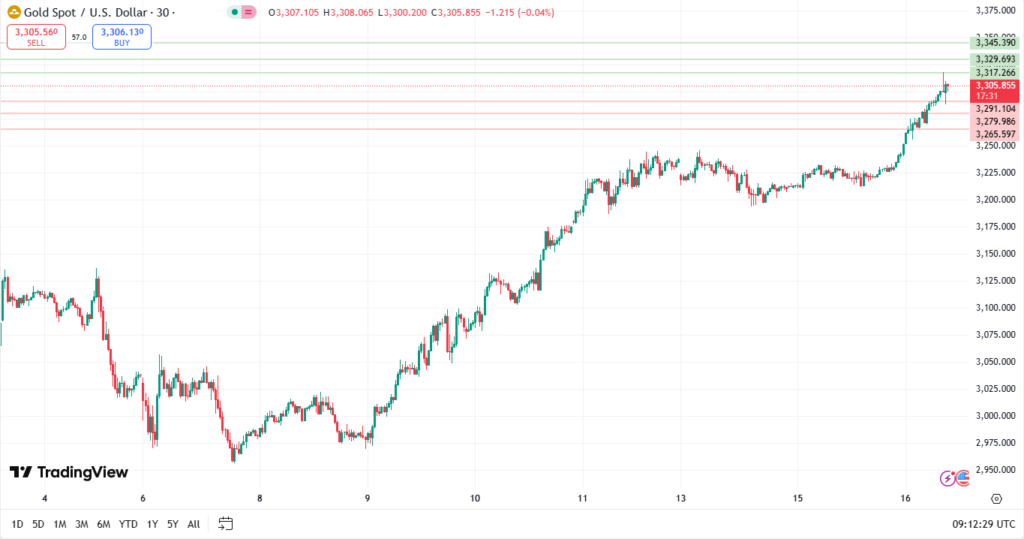
XAU/USD
Possible long preference
Long positions above 3317.26 with targets at 3329.69 and 3345.39 in extension.
Alternative scenario
Below 3291.10, look for further downside with 3279.98 and 3265.59 as targets.
The RSI shows upside momentum.
TODAY’S NEWS HEADLINES
S&P 500 futures slide as Nvidia shares tumble, traders await retail sales data
US stock futures slipped early Wednesday as investors looked ahead to the release of a key retail sales report and more earnings from the first-quarter season.
Dow Jones Industrial Average futures dropped 328 points, or 0.8%.
S&P 500 futures and Nasdaq 100 futures dipped 1.49% and 2.29%, respectively.
These moves followed a relatively muted Tuesday session, which ultimately saw the three major averages close in the red after back-to-back winning sessions.
The Dow shed nearly 156 points, or 0.4%, while the S&P 500 slipped 0.2%. The Nasdaq Composite closed marginally lower.
Europe stocks end 1.6% higher, real estate, banks lead gains on hopes of Trump tariff relief
European markets rose on Tuesday amid tentative optimism that there will be some respite from US President Donald Trump’s tariff regime.
The pan-European Stoxx 600 index provisionally ended the day higher by 1.6%.
The UK’s FTSE 100 was up 1.5%.
France’s CAC 40 and Germany’s DAX rose by 0.9% and 1.3%, respectively.
This followed a 2.7% jump in the Stoxx Europe 600 index on Monday.
Asia-Pacific markets mostly rise after tech rally pushes Wall Street higher
Asia-Pacific markets mostly rose Tuesday after all three key Wall Street benchmarks advanced overnight on a tech rally.
Japan’s benchmark Nikkei 225 climbed 0.84% to end the day at 34,267.54, while the broader Topix index advanced 1% to 2,513.35.
In South Korea, the Kospi index added 0.88% to close at 2,477.41, while the small-cap Kosdaq moved up 0.41% to 711.92.
Australia’s S&P/ASX 200 moved up 0.17% to close at 7,761.70.
Hong Kong’s Hang Seng Index closed 0.23% higher at 21,466.27.
Mainland China’s CSI 300 ended the day flat at 3,761.23.
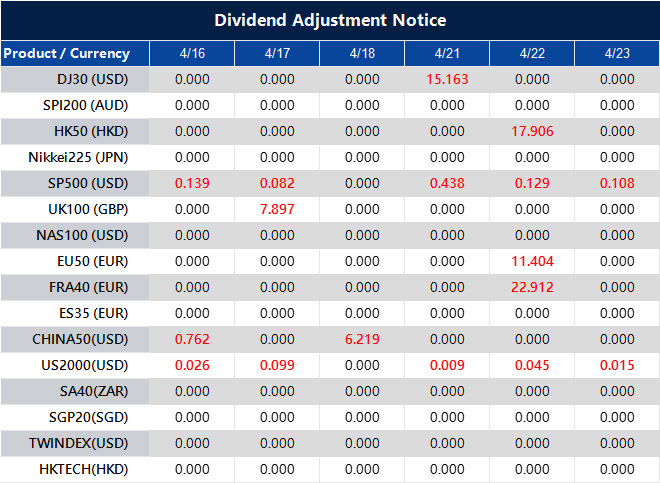
Please note that the dividends of the following products will be adjusted accordingly. Index dividends will be executed separately through a balance statement directly to your trading account, and the comment will be in the following format “Div & Product Name & Net Volume”.
Please refer to the table below for more details:
The above data is for reference only, please refer to the MT4/MT5 software for specific data.
If you’d like more information, please don’t hesitate to contact info@vtmarkets.com.
Long Position vs Short Position: A Comprehensive Guide
In the trading world, understanding the difference between going long and going short is crucial for navigating markets effectively. These strategies form the foundation of trading across various asset classes, such as stocks, commodities, and forex. Whether you’re a beginner or an experienced trader, grasping these concepts will help you make informed decisions and maximize potential profits. In this article, we’ll explain the key differences between long and short positions and how to open them for success in the markets.
What is a Long Position?
A long position involves buying an asset with the expectation that its price will rise. When traders go long, they are betting that the market or asset will increase in value. The goal is to buy low and sell high, profiting from the price increase.
To open a long position, the trader buys the asset at the current market price with the intention of selling it later at a higher price. If the price increases as expected, the trader can sell the asset at a higher price and pocket the difference as profit.
However, if the market moves in the opposite direction and the asset’s price falls instead of rising, the trader faces potential losses. In this case, the trader will have to sell the asset at a lower price than the purchase price, resulting in a loss.
Example:
A stock trader opens a long position on Meta, buying 1,000 shares at $500 each. Over the next few months, Meta’s stock rises to $550 per share. The trader then sells the shares at $550, making a profit of $50 per share. With 1,000 shares, the total profit is $50,000. The trader profits by buying at a lower price and selling at a higher price.
What is a Short Position?
A short position involves borrowing an asset, such as stock, and selling it with the expectation that its price will fall. Traders go short to profit from a price decline by selling the asset at a high price and buying it back at a lower price later.
To open a short position, the trader borrows the asset from a broker and sells it at the current market price. If the price decreases as expected, the trader can buy back the asset at the lower price, return it to the lender, and keep the difference as profit.
However, if the market moves in the opposite direction and the price of the asset rises instead of falling, the trader faces potential losses. In this case, the trader will have to buy back the asset at a higher price to return it to the lender, leading to a loss.
Example:
A stock trader opens a short position on Amazon, borrowing 1,000 shares and selling them at $200 each. Over the next few months, Amazon’s stock falls to $150 per share. The trader then buys back the shares at $150, making a profit of $50 per share. With 1,000 shares, the total profit is $50,000. The trader profits by selling at a higher price and buying back at a lower price.
The Key Difference Between Long Position and Short Position
Understanding the key differences between long and short positions is essential for traders. While both strategies aim to profit from market movements, they differ significantly in how they function and the risks involved. Below is a comparison between a long position and a short position:
Aspect
Long Position
Short Position
Market Expectation
Expecting the price to rise
Expecting the price to fall
Action Taken
Buy the asset at the current price
Borrow and sell the asset at the current price
Profit Scenario
Profit if the price rises above the purchase price
Profit if the price falls below the selling price
Risk of Loss
Loss if the price falls below the purchase price
Loss if the price rises above the selling price
Potential for Loss
Limited to the amount invested (if the price falls to zero)
Unlimited (price can rise indefinitely)
How to Open a Long or Short Position
To successfully navigate the markets, understanding how to open both long and short positions is essential. Below are the steps to follow for each, helping you execute your trades effectively:
Step 1: Understand Long and Short Positions
Before placing a trade, it’s crucial to understand the differences between long and short positions. A long position profits from price increases, while a short position profits from price declines.
Based on your market analysis, choose whether to go long (buy) or short (sell) on the asset you’re interested in. Your decision should be based on whether you expect the price to rise or fall.
Step 4: Implement Risk Management Strategies
Use risk management tools like stop-loss orders, take-profit orders, and position sizing to protect your capital. These tools help limit potential losses and secure profits.
Step 5: Monitor and Stay Informed
Regularly track your positions and stay informed about market conditions. Keeping up with relevant news and events is essential to adjust your strategies and make informed decisions.
When Should You Go Long or Short in Trading?
Deciding when to go long or short depends on your market outlook and the conditions you’re analyzing. Each strategy works best under specific circumstances:
Go Long: A long position is ideal when you believe the asset’s price will rise. Typically, you would go long in a bullish market, where positive news, strong earnings reports, or overall market sentiment suggest growth. If you’re confident that an asset will appreciate over time, opening a long position can help you capitalize on that upward movement.
Go Short: A short position is best when you anticipate that the asset’s price will decline. This is suitable for bearish markets, where negative news, poor earnings, or a general downturn in the market signals a price drop. If you believe the asset is overvalued or facing downward pressure, shorting can allow you to profit from the price decrease.
Understanding market trends, staying informed about news events, and using technical indicators can help you determine the right time to take either position.
Conclusion
Understanding when to go long or short is crucial for successful trading. Both long and short positions offer opportunities to profit from market movements, but they require careful analysis of market conditions. A long position is ideal when you expect the price of an asset to rise, while a short position is suitable when you believe the price will fall. By choosing the right strategy based on market conditions, you can optimize your trading approach and increase your chances of success.
Start Trading Today with VT Markets
If you’re ready to start trading and put your knowledge of long and short positions to the test, VT Markets offers an intuitive platform that supports both MetaTrader 4 and MetaTrader 5. These popular trading platforms provide powerful tools, real-time market analysis, and automated trading options. Whether you’re looking to go long or short, VT Markets gives you the flexibility and resources to trade across a wide range of assets, including stocks, forex, commodities, and more.
Sign up today to begin your trading journey and explore diverse trading opportunities with VT Markets.
Frequently Asked Questions (FAQs)
1. What is a long position?
A long position refers to buying an asset with the expectation that its price will rise. Traders go long when they believe the asset will appreciate over time, allowing them to sell it at a higher price to make a profit.
2. What is a short position?
A short position involves borrowing an asset and selling it with the expectation that its price will fall. Traders go short when they believe the asset will decrease in value, allowing them to buy it back at a lower price for a profit.
3. What is the difference between a long and short position in simple terms?
A long position involves buying an asset with the expectation it will rise, while a short position involves selling an asset you don’t own, with the expectation it will fall.
4. How do I open a long position in trading?
To open a long position, you need to buy the asset at the current market price, expecting its price to rise. Once the price increases, you can sell the asset for a profit.
5. How do I open a short position in trading?
To open a short position, you must borrow the asset from your broker, sell it at the current market price, and buy it back later at a lower price, hoping to profit from the price decline.
6. What happens if a short position goes wrong?
If the asset price rises instead of falling, you will have to buy back the asset at a higher price, incurring a loss. Since the price can rise indefinitely, short selling carries potentially unlimited risk.
7. How do I know when to go long or short in trading?
A long position is best when market conditions suggest rising prices, such as strong earnings or bullish news. A short position is ideal when the market shows signs of falling prices, such as weak earnings or bearish sentiment.
8. Can I trade long and short positions at the same time?
Yes, you can trade both long and short positions at the same time, especially if you’re employing strategies like hedging or pair trading. This approach allows you to manage risk and take advantage of different market movements.
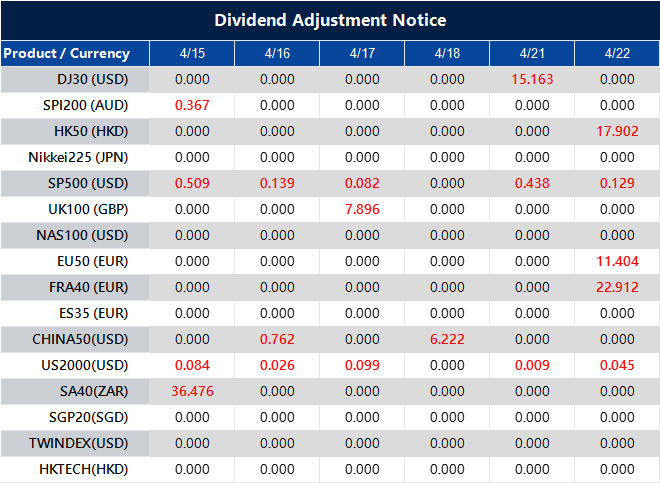
Please note that the dividends of the following products will be adjusted accordingly. Index dividends will be executed separately through a balance statement directly to your trading account, and the comment will be in the following format “Div & Product Name & Net Volume”.
Please refer to the table below for more details:
The above data is for reference only, please refer to the MT4/MT5 software for specific data.
If you’d like more information, please don’t hesitate to contact info@vtmarkets.com.
The US dollar is struggling to regain strength as markets react to mixed signals from Washington and growing expectations of interest rate cuts from the Federal Reserve. Recent policy reversals and investor shifts away from dollar assets have left the greenback on shaky ground, with confidence further dampened by global currency strength and economic uncertainty.
US dollar remains fragile amid policy uncertainty and investor shift
The US dollar showed limited stability in early Tuesday trading, lingering near multi-year lows after a turbulent week marked by abrupt shifts in tariff policy and a notable move away from dollar-denominated assets.
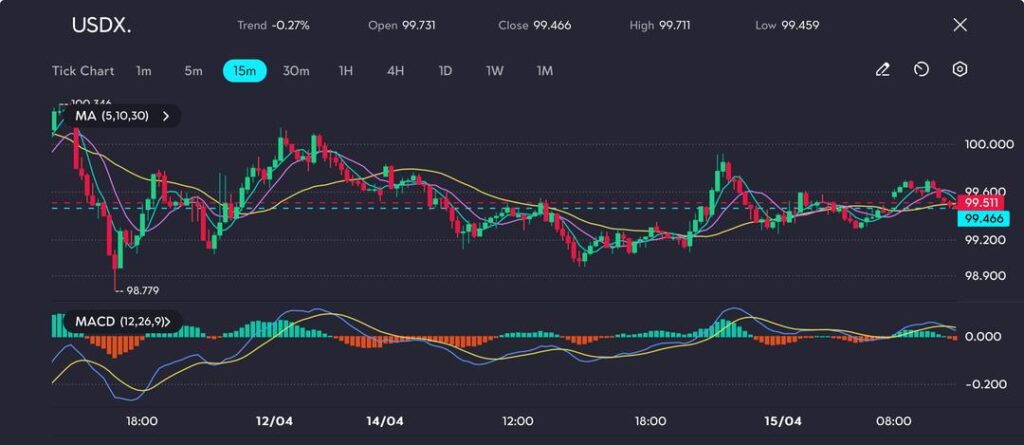
The US Dollar Index (USDX) settled at 99.466, down 0.27% on the day, following a sharp drop to its lowest level since July 2023. This occurred despite US Treasury yields touching their highest levels in two decades last week.
The bond market sell-off escalated Friday to cap off one of the most volatile and unusual trading weeks in recent memory as President Trump's tariff whipsaw sent yields surging as investors fled safe haven assets.
The primary pressure on the greenback stems from inconsistent signals out of Washington. Over the weekend, President Trump reversed course on a widely-criticised plan to implement broad-based import tariffs, opting to exclude several key Chinese consumer goods.
While markets initially viewed this as a relief, his comments implying the change might be short-lived introduced fresh uncertainty for traders.
Elsewhere, the Swiss franc surged to a 10-year high against the dollar last week, reflecting broader weakness. The euro and yen also held firm despite modest pullbacks.
The euro traded around USD 1.1324—just under its three-year peak of USD 1.1474—while the yen hovered at 143.53, slightly above Friday’s six-month low of 142.05.
Technical analysis: US Dollar Index stalls near key levels
Following a sharp drop to 98.779 on 12 April, the US Dollar Index has been consolidating in a narrow band. It has found temporary support in the 99.20–99.30 zone, but upside momentum remains limited, with 99.71 acting as a recent ceiling.
USDX stalls below 99.75 as bulls hesitate to reclaim lost ground, as seen on the VT Markets app.
The index has since slipped back to 99.46 and is currently fluctuating near a confluence of the 5-, 10-, and 30-day moving averages, highlighting market indecision.
Momentum indicators are showing mixed signals. The MACD histogram is flat, and the signal lines are congested near the zero level—indicating a lack of clear direction.
Unless a fresh catalyst emerges, the index may continue to range-trade, with price action capped below the psychologically significant 100.00 level.
A breakout above 99.75–99.80 could reignite bullish sentiment, whereas a move below 99.20 would likely expose the previous low at 98.77.
Federal Reserve hints at dovish shift
Further weighing on the dollar, Federal Reserve Governor Christopher Waller noted on Monday that recent tariff shocks might justify interest rate cuts—even if inflation remains elevated.
This underscores the complex balancing act the Fed faces between managing inflation and supporting economic growth.
Markets reacted quickly, pricing in 86 basis points of rate cuts for the remainder of the year, according to LSEG data.
Meanwhile, US bond yields stabilised, with the 10-year yield holding at 4.354%—following last week’s dramatic 50-basis-point spike, the largest since 2001.
However, analysts view this pause as temporary, given the ongoing shift from Treasuries to global alternatives.
Short-term outlook: Dollar exposed to further downside
With US policy direction unclear and the Fed signalling increased flexibility towards rate cuts, the dollar remains under pressure.
Key technical support for the USDX stands at 98.75, while resistance is capped around 100.20.
Should upcoming data—particularly retail sales and jobless claims—disappoint, the index may continue its downward trajectory, potentially revisiting levels last seen in mid-2022.
As the new trading week begins, investors are navigating a landscape shaped by recent market volatility following the introduction of new US tariffs. Today’s focus will be on inflation expectations, central bank commentary, and corporate earnings—all key drivers that could influence overall market sentiment.
KEY INDICATORS
US consumer inflation expectations (March)
The Federal Reserve Bank of New York is set to release its monthly survey, offering insights into consumers’ inflation expectations.
This data is crucial for gauging potential shifts in consumer behaviour and future monetary policy decisions.
Federal reserve speeches
Several Federal Reserve officials, including Patrick Harker and Raphael Bostic, are scheduled to speak.
Their remarks will be closely analysed for clues regarding the Fed’s stance on interest rates and the broader economic outlook.
International data releases
Japan: Reports on industrial production and capacity utilisation will offer insight into the health of Japan’s manufacturing sector.
Switzerland: The release of the Producer Price Index (PPI) will provide an update on inflationary pressures within the Swiss economy.
MARKET MOVERS
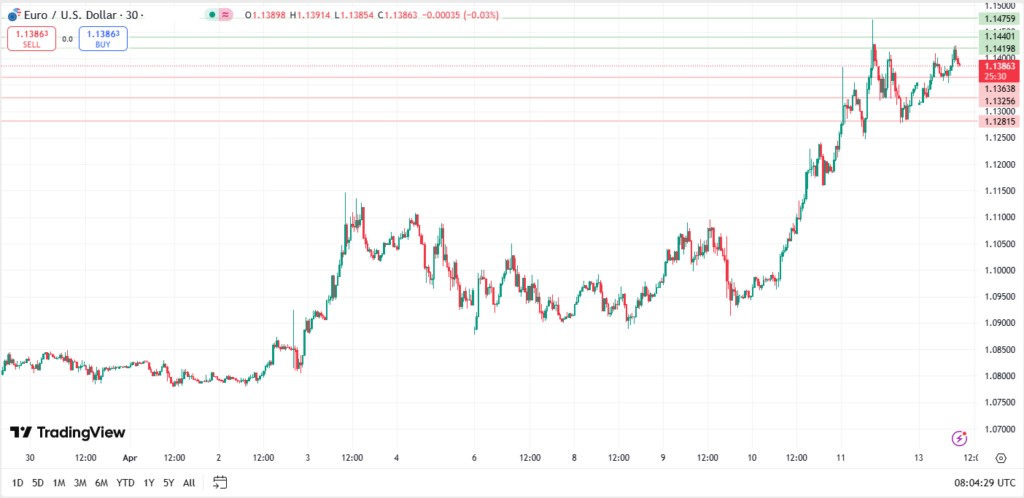
EUR/USD
Possible long preference
Long positions above 1.14198 with targets at 1.14401 and 1.14759 in extension.
Alternative scenario
Below 1.13638, look for further downside towards 1.13256 and 1.12815.
The RSI indicates further upside potential.
Asia FX weak with Chinese yuan down; dollar hits 3-year low amid brief tariff relief
Most Asian currencies weakened on Monday. The Chinese yuan remained fragile amid limited relief on US trade tariffs, while ongoing concerns over economic headwinds pushed the US dollar to a three-year low.
The Japanese yen outperformed, trading near its strongest level in six months as demand for safe havens remained high. The USD/JPY pair fell 0.3% to 143.09.
Chinese yuan dips as Beijing sets weak midpoint; trade data positive
The onshore USD/CNY pair rose 0.2% after another weak midpoint fix from the People’s Bank of China. The pair remained close to a 17-year high reached last week.
The PBOC has set a weaker midpoint in seven of the past eight sessions, with Beijing appearing to devalue the yuan to counteract steep US tariffs.
Last week, Trump hiked tariffs on China to a staggering 145%, with Beijing retaliating with 125% tariffs.
Gold prices dip from record highs amid some US tariff relief
Gold prices fell from record highs on Monday as risk appetite improved marginally following the US signalling some exemptions from steep trade tariffs against China, although sentiment remained largely cautious.
Spot gold fell 0.3% to USD 3,225.79/oz.
Gold futures expiring in June dropped 0.1% to USD 3,240.87/oz by 5:12 AM GMT.
Spot gold remained close to the record high of USD 3,245.69/oz reached last week.
Gold pressured by brief tariff relief as risk appetite recovers
Losses in gold came amid gains in risk-driven markets, with Asian stocks mostly rallying on Monday. US stock index futures also rose during Asian trading hours.
Beijing announced 125% retaliatory tariffs against the US in response to Trump’s latest move, showing little intention of backing down.
Platinum futures rose 0.8% to USD 951.90/oz.
Silver futures fell 0.3% to USD 31.827/oz.
Among industrial metals, copper futures on the London Metal Exchange steadied at USD 9,152.90 per tonne.
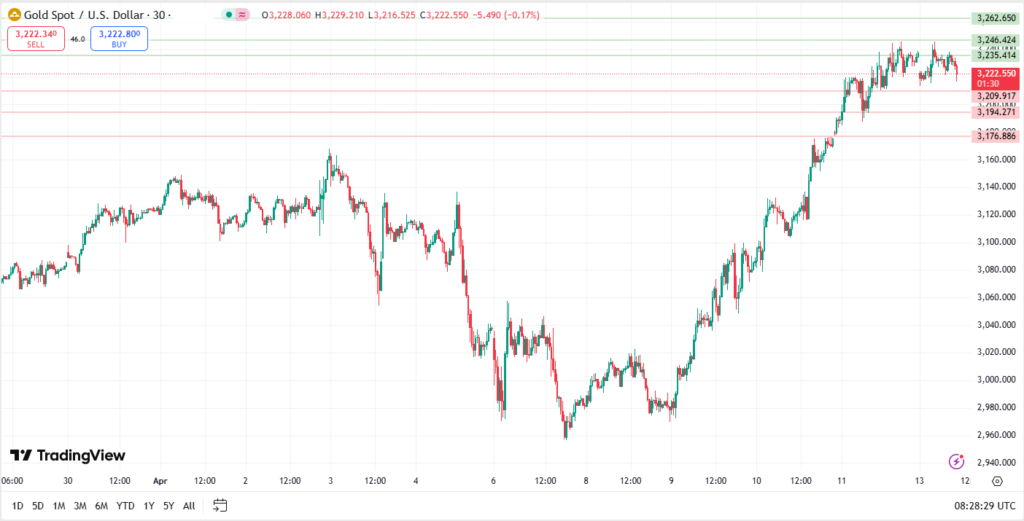
XAU/USD
Possible long preference
Long positions above 3,235.41 with targets at 3,246.42 and 3,262.65 in extension.
Alternative scenario
Below 3,209.91, expect further downside towards 3,194.27 and 3,176.88.
While further consolidation cannot be ruled out, it is expected to remain limited.
TODAY’S NEWS HEADLINES
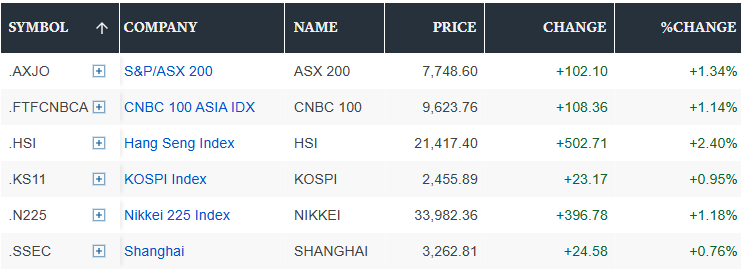
Hong Kong shares rise over 2% to lead gains in Asia after Trump pauses tariffs on consumer electronics
Asia-Pacific markets climbed on Monday as US President Donald Trump paused tariffs on some consumer electronics, boosting risk sentiment.
Hong Kong stocks led gains in the region, with the Hang Seng Index ending the day 2.4% higher at 21,417.40.
The Hang Seng Tech Index rose 2.34% to 5,015.12.
Mainland China’s CSI 300 increased 0.23% to close at 3,759.14.
Japan’s benchmark Nikkei 225 ended the day 1.18% higher at 33,982.36.
In South Korea, the Kospi index added 0.95% to close at 2,455.89.
Meanwhile, Australia’s S&P/ASX 200 rose 1.34% to close at 7,748.60.
Japan’s Nikkei jumps over 9% to lead gains in Asia after Trump pauses tariffs
Asia-Pacific markets rose on Thursday, following Wall Street’s biggest burst of buying since 2008, after US President Donald Trump announced a 90-day pause on higher tariffs for all nations except China.
US futures fell, even as Trump’s pledge to pause tariffs on some trading partners for 90 days spurred a massive surge on Wall Street.
Overnight in the US, the broad-based S&P 500 skyrocketed 9.52% to close at 5,456.90 — its biggest one-day gain since 2008.
European markets close lower as traders brace for Trump’s tariff plans
European markets closed lower on Wednesday as global traders braced themselves for a raft of fresh trade tariffs due to be announced by US President Donald Trump’s administration.
After rebounding on Tuesday, the regional Stoxx 600 index closed down 0.6%. Most sectors recorded declines, though retail and utilities stocks posted slight gains.
Germany’s DAX dropped 0.7%, while France’s CAC 40 was down 0.2%.
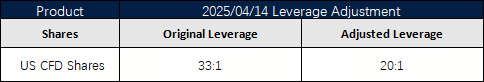
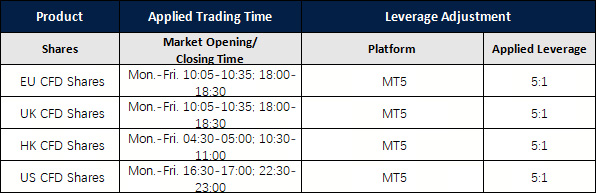
To provide a favorable trading environment to our clients, VT Markets will modify the trading setting of all Shares products. Please refer to the following details:
1. All US Shares products leverage will be adjusted to 20:1.
2. MT5 All Shares products: New positions opened within 30 minutes before market closing and after market opening will start with a leverage of 5:1. After the mentioned period, the leverage will be resumed to original leverage and will not be adjusted back to 5:1.
MT4 will not be affected.
The above data is for reference only, please refer to the MT4/MT5 software for specific data.
Friendly reminders:
1. All specifications for Shares CFD stay the same except leverage during the mentioned period.
2. The margin requirement of the trade may be affected by this adjustment. Please make sure the funds in your account are sufficient to hold the position before this adjustment.
If you’d like more information, please don’t hesitate to contact info@vtmarkets.com.
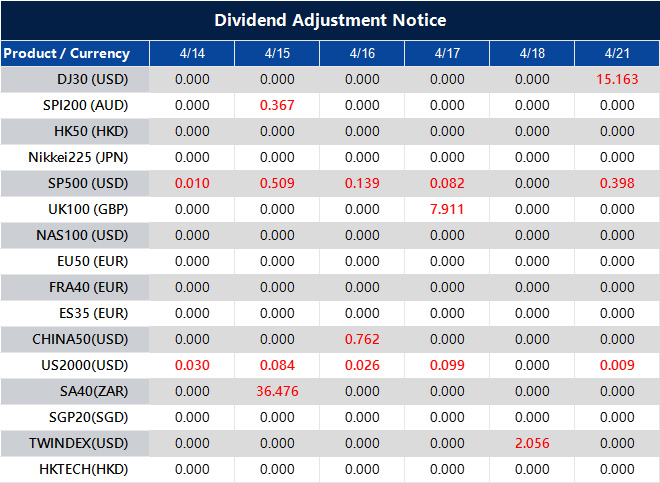
Please note that the dividends of the following products will be adjusted accordingly. Index dividends will be executed separately through a balance statement directly to your trading account, and the comment will be in the following format “Div & Product Name & Net Volume”.
Please refer to the table below for more details:
The above data is for reference only, please refer to the MT4/MT5 software for specific data.
If you’d like more information, please don’t hesitate to contact info@vtmarkets.com.


 | VT Markets")