Back

Week ahead: Markets eye central bank signals

The upcoming week is poised to be pivotal for global financial markets as investors navigate a landscape marked by heightened volatility stemming from recent US tariff implementations.

Key corporate earnings reports, economic indicators, and central bank communications will be in focus as market participants assess the broader economic implications of escalating trade tensions.

KEY INDICATORS

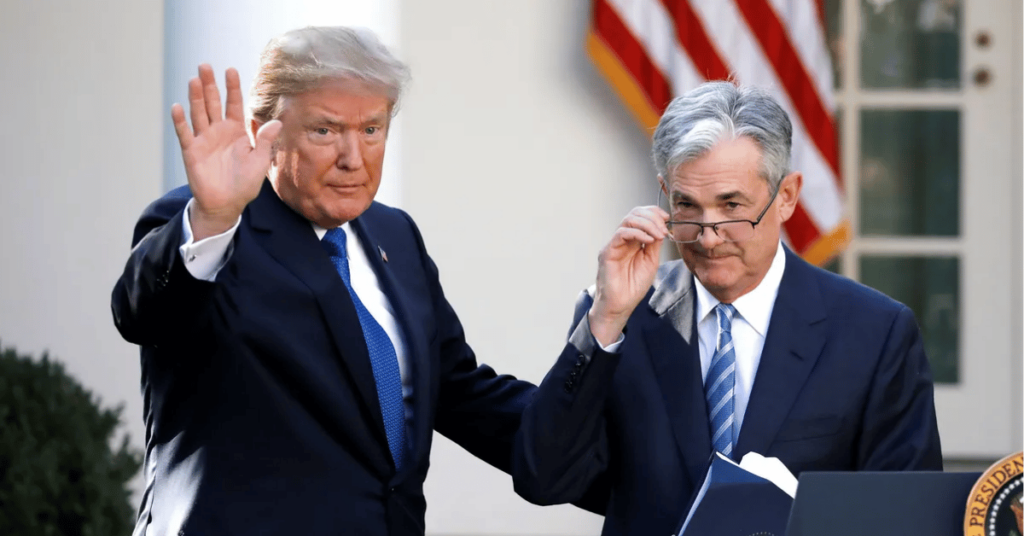
Central bank communications

  • Market participants will closely monitor remarks from Federal Reserve officials for any indications on future monetary policy.
  • The release of the Federal Reserve’s Beige Book on Wednesday will provide a regional economic overview ahead of the upcoming policy meeting.
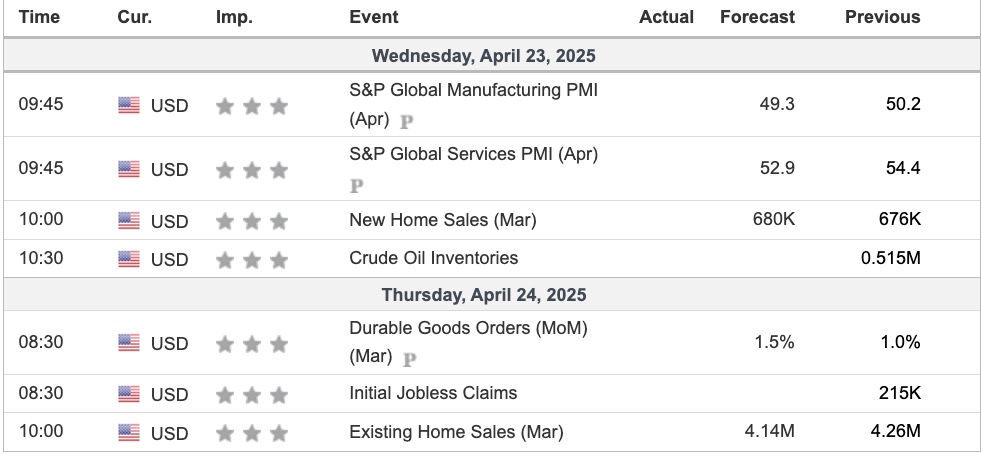
Wednesday, 23 April

  • US new home sales (March): Providing insights into the housing market’s response to current economic conditions.

Thursday, 24 April

  • US existing home sales (March): Further data on housing market trends.
  • Weekly jobless claims: Offering a snapshot of the labour market’s resilience.

Friday, 25 April

  • US durable goods orders (March): Indicating business investment trends.
  • University of Michigan consumer sentiment index (April final): Assessing consumer confidence amid economic uncertainties.

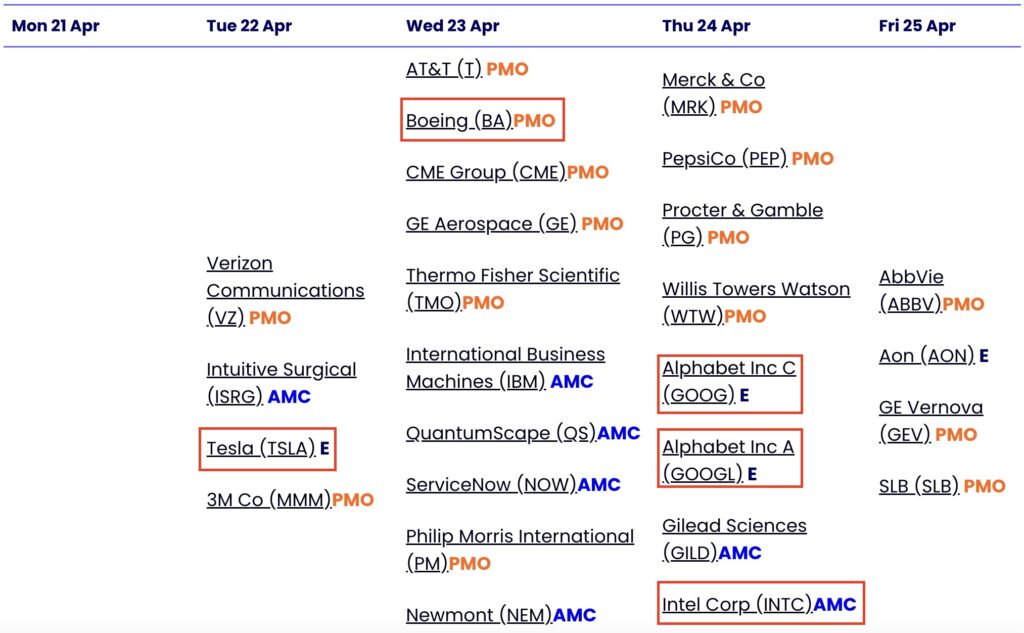
Economic events for the coming week include a slew of major companies set to report earnings, providing insights into how businesses are coping with the current economic climate.

MARKET MOVERS

European stocks pare losses following European Central Bank interest rate cut

European stock markets pared losses to close nearly flat on Thursday following the European Central Bank’s decision to cut interest rates.

  • The pan-European Stoxx 600 index provisionally closed 0.1% lower.
  • Regionally, the UK’s FTSE 100 was little changed for the session.
  • Germany’s DAX and France’s CAC 40 fell by 0.5%.

As widely expected, the European Central Bank trimmed interest rates for the third time this year by 25 basis points amid concerns over the eurozone’s economic growth outlook in a time of uncertainty over global trade and tariffs.

ECB cuts interest rates by 25 basis points

  • The ECB on Thursday cut interest rates by 25 basis points, as was widely expected ahead of the decision.
  • Markets had priced in around a 94% chance of such a cut, and around a 6% chance of a larger, 50 basis point reduction.
  • This takes the central bank’s deposit facility rate, its key rate, to 2.25% — down from highs of 4% in mid-2023.
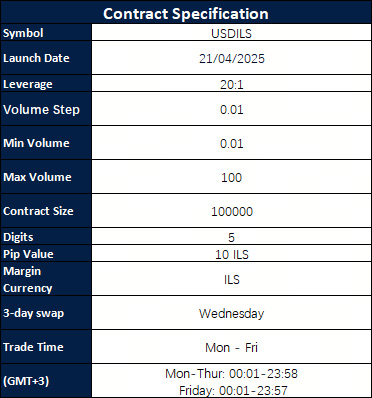
EUR/USD

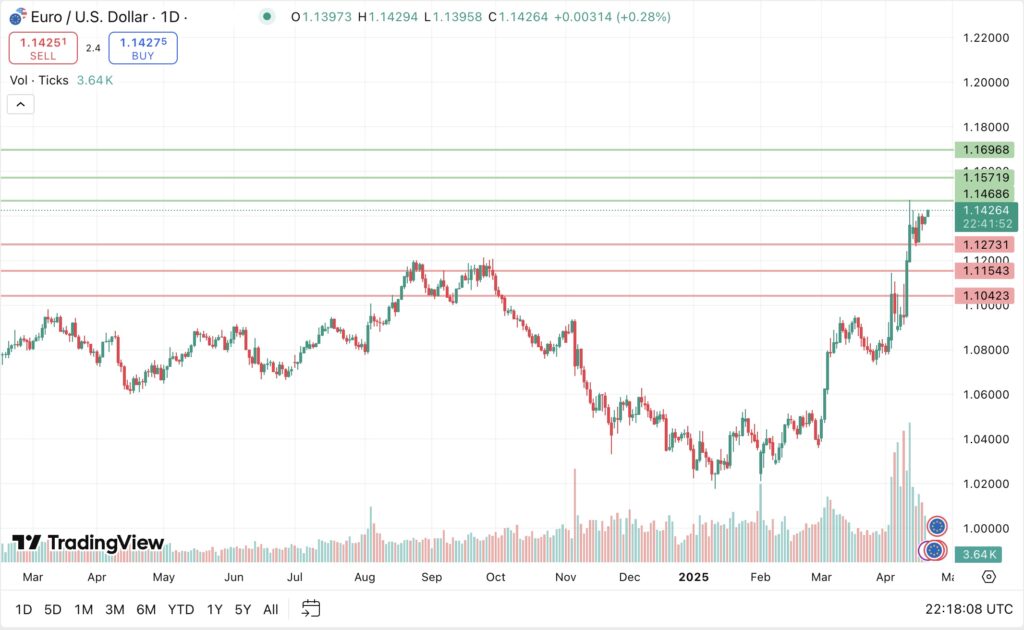
Preferred long preference

Long positions above 1.14686 with targets at 1.15719 & 1.16963 in extension.

Alternative scenario

Above 1.12731 look for further upside with 1.11543 & 1.10423 as targets.

The RSI is above its neutrality area at 50. The MACD is above its signal line and negative. The MACD must break above its zero level to trigger further gains. Moreover, the price is above its 20 and 50 period moving average.

Earnings report news

First-quarter earnings season is due to begin during the second full week of April, led by banking giants JPMorgan Chase (JPM) and Wells Fargo (WFC).

Analysts at US financial data group FactSet estimate a year-on-year earnings growth rate of 7.3% for the S&P 500 companies, which would mark the seventh consecutive quarter of earnings growth reported by the index.

Companies are beating Q1 earnings estimates so far. Some big results are up next

  • The first-quarter earnings season is off to a softish start by some measures, according to new research, but another quarter of year-on-year growth still looks likely.
  • Based on preliminary results—just 12% of S&P 500 companies have reported so far, according to analysis released late Thursday by FactSet—70% of reporting companies in the benchmark index have come in above Street estimates.
  • Earnings have come in 6.1% above estimates, also below the five- and ten-year averages.
  • The S&P 500’s first-quarter results are still projected to grow for a seventh consecutive quarter.
  • A combination of reported results and estimates for those yet to report indicates growth of 7.2% so far.

Key: PMO = Pre-market open | AMC = After market close | E = Estimated

XAU/USD

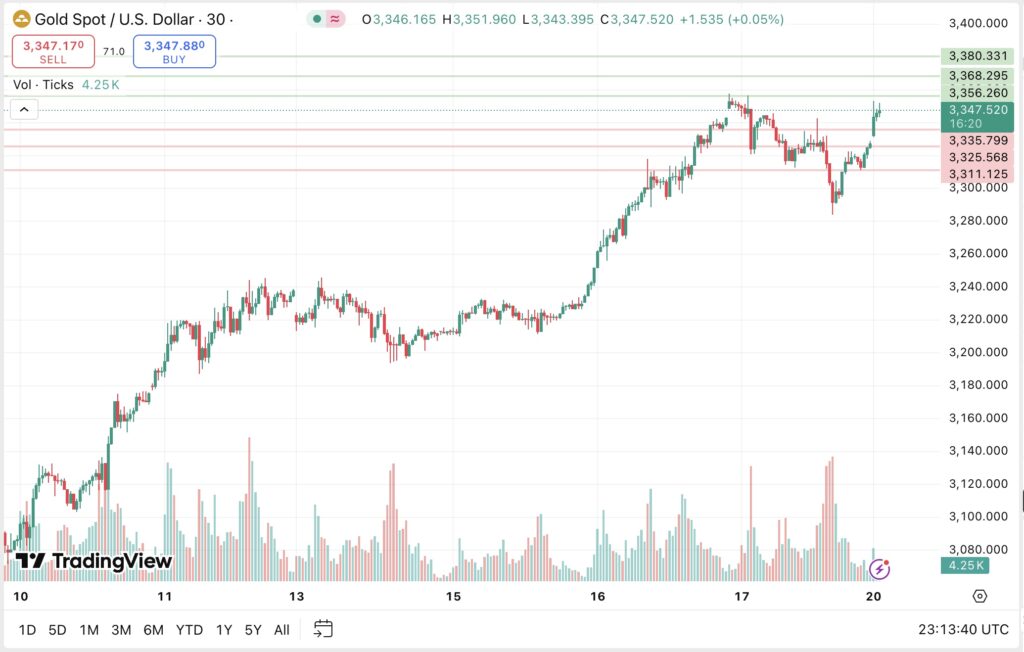
Potential short preference

Short positions below 3335.79 with targets at 3325.56 & 3311.12 in extension.

Alternative scenario

Above 3356.26 look for further upside with 3368.29 & 3380.33 as targets.

The index currently faces a challenging resistance.

Gold starts coming back to Switzerland from US after exclusion from Trump’s tariffs

  • Gold, which traders had been flying to New York since December as a precaution against the possibility of broad US tariffs hitting bullion imports, is being shipped back to Switzerland, where it originated, official data shows.
  • Swiss customs data on Thursday showed that the country’s gold imports from the US rose to a thirteen-month high of 25.5 metric tonnes in March, from 12.1 tonnes in February.
  • Gold exports from Switzerland to the US fell 32% month-on-month to 103.2 tonnes.
  • Gold, silver, and platinum worth more than USD 80 billion were delivered to Comex warehouses in the December–March period, keeping logistics firms and Swiss refineries busier than usual.
  • Part of what is currently being delivered out of the US gold vaults is returning to Switzerland, the world’s biggest bullion refining and transit hub, said a source at a Swiss refinery.

NEWS HEADLINES

Oil prices slip 1% after progress in US-Iran talks

  • Oil prices fell more than 1% at Monday’s open in Asia after nuclear talks between the United States and Iran progressed, easing supply concerns.
  • Brent crude futures slipped 78 cents, or 1.15%, to USD 67.18 a barrel at 10:12 PM GMT.
  • US West Texas Intermediate crude was at USD 63.91 a barrel, down 77 cents, or 1.19%.
  • The two countries agreed on Saturday to begin drafting a framework for a potential nuclear deal, Iran’s foreign minister said, after talks that a US official described as yielding “very good progress.”

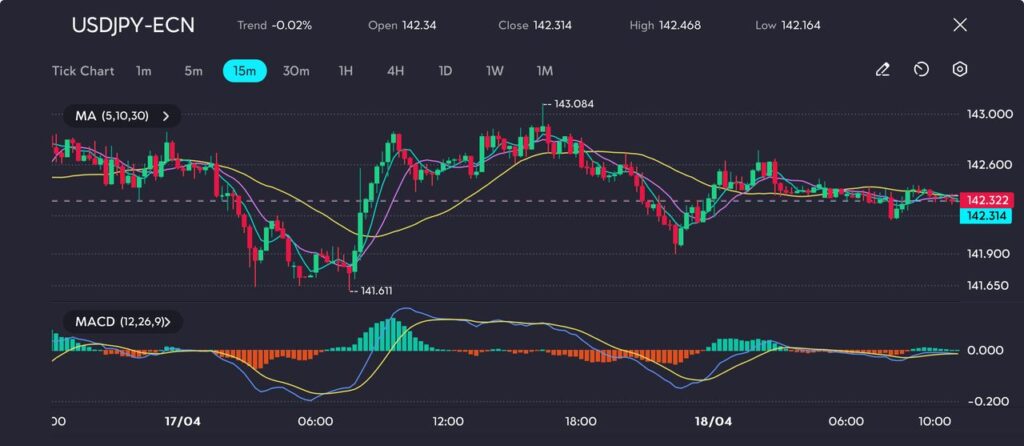
Japan seeks ‘fairness’ in currency talks with US, Prime Minister Ishiba says

  • Japan will emphasise “fairness” in any discussions with the US on exchange rates, Prime Minister Shigeru Ishiba said on Sunday, as bilateral trade talks gain global attention during President Donald Trump’s tariff offensive.
  • Trump has imposed 24% tariffs on Japanese exports to the US, although, like most of Trump’s levies, they have been paused until early July.
  • A 10% universal rate remains in place, as does a 25% duty on cars, a mainstay of Japan’s export-reliant economy.

Stock futures fall after Wall Street posts another losing week

  • Stock futures fell on Sunday evening following yet another negative trading week for Wall Street.
  • S&P 500 futures declined by 0.5%.
  • Nasdaq-100 futures dropped 0.5%.
  • Futures tied to the Dow Jones Industrial Average tumbled 214 points, or 0.5%.
  • These moves come after each of the three major averages logged a third weekly decline in the last four trading weeks.

Click here to open account and start trading.

Dividend Adjustment Notice – Apr 21 ,2025

Dear Client,

Please note that the dividends of the following products will be adjusted accordingly. Index dividends will be executed separately through a balance statement directly to your trading account, and the comment will be in the following format “Div & Product Name & Net Volume”.

Please refer to the table below for more details:

Dividend Adjustment Notice

The above data is for reference only, please refer to the MT4/MT5 software for specific data.

If you’d like more information, please don’t hesitate to contact info@vtmarkets.com.

Forex market analysis: 19 April 2025

The US dollar index (USDX) traded in tight ranges, closing the session near 99.15 as subdued Good Friday volumes capped volatility. Despite holding steady on the day, the greenback remains under pressure near 3-year lows.

Dollar nears three-year lows as trade optimism and Fed discontent collide

President Trump surprised markets with a softer stance on China tariffs, suggesting that not only will he avoid raising duties further, but he may even consider rolling some back. This is a potential pivot that could soothe market anxiety and support risk sentiment next week.

However, his fresh criticism of Federal Reserve Chair Jerome Powell overshadowed the optimism. Trump stated Powell was “too slow” to act and “can’t be removed quickly enough,” escalating the pressure on the Fed just days after Powell reiterated that the central bank is “monitoring data carefully” before adjusting rates.

Markets are now pricing in about 86 basis points of rate cuts for the remainder of 2025.

A drop in U.S. jobless claims to a two-month low underscored a still-resilient labour market, offering some support to the greenback. However, persistent uncertainty around trade policy and renewed pressure on the Fed from Trump have kept traders cautious, leaving the dollar stuck near multi-year lows despite flashes of stability.

Technical analysis for the US Dollar Index

The 15-minute chart of the USDX shows a choppy consolidation phase after the index found short-term support at 98.904. Despite multiple intraday swings, the price remains range-bound, with resistance near 99.50 and support holding above 98.90, signaling uncertainty among dollar bulls and bears.

us-dollar-index-usdx
Dollar bulls struggle to regain ground above 99.20, as seen on the VT Markets app.

The MACD (12,26,9) shows waning bullish momentum as the histogram contracts toward the zero line. The recent bearish crossover and fading histogram strength imply a possible retest of support, especially as the price lingers below the 30-period moving average, capping any upside thrusts. Traders may want to watch for a break above 99.50 for upside continuation, or a clean breach below 98.90 to confirm renewed bearish control.

A sustained move below 98.90 could reopen downside toward 98.50, while upside resistance holds at 99.50. The dollar is likely to remain range-bound in the short term unless next week’s data or Fed communications provide a directional push.

Click here to open account and start trading.

What Is Short Selling and How Does Short Selling Work?

What Is Short Selling and How Does It Work? Everything You Need to Know

In this article, we’ll explore what short selling is, how short selling works, and why it’s a valuable strategy for traders in shifting markets. Whether used to hedge against potential losses or to capitalise on anticipated price drops, short selling offers flexibility across various market conditions.

What Is Short Selling?

Short selling is the act of selling an asset you don’t own with the intention of buying it back later at a lower price. This is typically done by borrowing shares from a broker, selling them on the open market, and then repurchasing them after the price falls, returning the borrowed shares and pocketing the difference.

Alternatively, many traders now use CFDs (Contracts for Difference) to short-sell stocks. With CFDs, you’re not borrowing or owning the actual stock. Instead, you’re trading a contract based on the price movement of the underlying asset, making the process simpler, faster, and more accessible.

Example: Imagine a trader believes Tesla stock will fall from $350 to $300. Instead of borrowing shares, they open a short CFD position. If the stock drops to $300, the trader profits from the $50 difference, minus any trading costs.

How Does Short Selling Work?

Let’s break down how short selling works, including both traditional and CFD short-selling approaches:

Traditional Short Selling:

  • Borrow Shares: A trader borrows shares of a stock from their broker.
  • Sell the Shares: The borrowed shares are sold on the open market at the current market price.
  • Wait for Price Decline: The trader monitors the market, hoping the price drops.
  • Buy Back at Lower Price: If the price drops, the trader repurchases the shares.
  • Return Shares to Broker: The trader returns the original borrowed shares and keeps the difference.

CFD Short Selling:

With a CFD (Contract for Difference), you do not own or borrow the underlying asset. Instead, you enter into an agreement with your broker to exchange the difference in the asset’s price between the time you open the position and when you close it.

When you open a short CFD position, you are essentially speculating that the asset’s value will decrease. If the market moves in your favour and the asset price falls, you can close the trade at a lower price. The broker then pays you the difference between your entry price and the exit price, which becomes your profit.

Example: Imagine a stock is priced at $100. You open a short CFD position at this price, expecting it to decline. The stock drops to $90, and you close your trade. You earn a $10 profit per share, depending on the size of your position.

Which Market Can You Short-Sell?

With VT Markets, you can short-sell across a wide range of global financial markets using CFDs. This allows you to speculate on falling prices without owning or borrowing the asset.

Here are the markets where short selling is available:

The Difference Between a Long and a Short Position

In trading, the terms “long” and “short” refer to the direction of your market expectation. When you take a long position, you’re buying an asset with the belief that its price will rise, allowing you to sell it later at a higher price for a profit. On the other hand, a short position involves selling an asset you don’t own, or speculating on its price falling, with the intention of buying it back later at a lower price. Essentially, going long means you’re bullish on the market, while going short signals a bearish outlook.

Example: If you think Amazon’s price will increase, you go long, buying the stock at its current price and aiming to sell it higher price. But if you believe it’s overvalued and likely to drop, you go short by short-selling Tesla shares. In both cases, your position depends on the direction you expect the market to move.

Why Do Traders Choose to Short-Sell?

Short selling is more than just betting against the market. Traders use it for different strategic purposes depending on their goals and market outlook.

Profit from Bearish Trends

One of the most common reasons to short-sell is to profit when an asset is expected to decline in value. Traders often look for overvalued stocks, weak earnings, or negative market sentiment as signals to go short. For example, if a major tech company is trading at all-time highs but issues a disappointing revenue forecast, short sellers may act quickly to benefit from the expected pullback.

Hedge Existing Positions

Short selling is also an effective hedging tool. Traders who already hold long positions may open short positions to offset potential losses during uncertain market conditions. For instance, if a trader holds a diversified portfolio of U.S. equities but expects a short-term market dip, they might short-sell an index like the S&P 500 to reduce risk exposure without exiting their entire portfolio.

Speculate on Weak Assets

Some traders specialise in identifying underperforming or fundamentally weak assets and shorting them purely for speculative gains. They may use earnings reports, industry news, or technical analysis to spot opportunities. A high-profile example was the wave of institutional short interest in GameStop before its unexpected retail-driven rally. While speculative short selling can be profitable, it also comes with higher volatility and risk.

Conclusion

Short selling is a strategy that allows traders to profit from falling markets by reacting to weak earnings, hedging against volatility, or targeting overvalued assets. Understanding what short selling is and how short selling works is key to using the strategy effectively. While traditional short selling involves borrowing and selling the asset, modern methods like CFDs offer a simpler way to speculate on price drops without owning the asset, making short selling more accessible and flexible for today’s traders.

Short Selling Stocks Today with VT Markets

VT Markets, a regulated and reliable trading platform, gives traders the ability to short-sell a wide range of global stocks through CFDs, all within a single, streamlined platform. Whether you’re trading major names like FAANG companies or spotting short-term opportunities in underperforming sectors, CFD short selling offers the speed and flexibility you need to act with confidence. With seamless integration to MetaTrader 4 and MetaTrader 5, competitive spreads, and fast execution, VT Markets makes it easier to access stocks, indices, forex, and more, all through one account.

Start short selling with VT Markets today and turn market downturns into trading opportunities.

Frequently Asked Questions (FAQs)

1. What is short selling in simple terms?

Short selling is a trading strategy where you borrow and sell a stock now, hoping to buy it back later at a lower price.

2. How does short selling work?

It works by borrowing shares, selling them at the current price, waiting for the price to drop, repurchasing them cheaper, and returning the borrowed shares to make a profit.

3. Is short selling risky?

Yes. Losses in short selling can be unlimited if the stock price rises significantly, which is why stop-loss strategies are critical.

4. What is an example of short selling?

Suppose Tesla shares are trading at $250, and you believe the price will fall. You open a short position by selling the stock (or a CFD) at $250. If the price drops to $230, you buy it back at the lower price, closing the trade with a $20 profit per share. This is a basic example of how a short sell works when the market moves in your favour.

Forex market analysis: 18 April 2025

The Japanese yen has recently drawn strong attention from traders as global uncertainty, shifting interest rate policies, and fresh inflation data keep influencing its movements. With the Bank of Japan set to meet soon, markets are closely watching for signals on the central bank’s next steps. Meanwhile, the yen continues to reflect broader concerns about economic stability and trade dynamics, making it a key indicator for risk sentiment across the region.

Japanese yen stays strong ahead of Bank of Japan meeting

The Japanese yen held firm on Friday, hovering near a seven-month high at approximately 142.30 per US dollar, as traders digested March inflation data and looked ahead to the upcoming Bank of Japan (BOJ) policy meeting.

The USD/JPY pair ended the session at 142.314, recording a slight decline as market sentiment steadied following recent macroeconomic updates.

Headline inflation eased to 3.6%, its lowest in four months, largely due to base effects from energy prices.

However, core inflation, which excludes volatile food costs, remained stable at 3.2%, matching expectations.

This persistence in underlying inflation allows the BOJ to maintain a cautious stance, especially as consumer prices continue to exceed the central bank’s 2% target.

Attention now turns to next week’s BOJ interest rate decision, where policymakers are widely anticipated to leave the benchmark rate at 0.5%.

This follows the BOJ’s recent departure from negative interest rates. However, the bank may revise its economic growth forecasts lower, as concerns grow over potential US tariffs and subdued global demand—factors that could weigh on Japan’s export-reliant economy.

In response to renewed scrutiny of Japan’s currency policy—sparked by comments from former US President Donald Trump—Finance Minister Shunichi Kato defended Japan’s stance, stating that the government is “not manipulating the currency”.

USD/JPY technical analysis: Sideways trend signals uncertainty

On the 15-minute chart, USD/JPY is showing signs of consolidation after sharp intraday volatility. The pair dropped to a low of 141.611, rallied to a high of 143.084, and then settled around 142.30, reflecting indecision among traders as they weigh yield differentials and broader risk sentiment.

USDJPY flattens out after wild swings between 141.60 and 143.08, as seen on the VT Markets app.

The MACD histogram indicates that bullish momentum is fading, flattening near the zero line. Both the MACD and signal lines are converging—suggesting a potential continuation of the range-bound movement in the short term.

Price action is also aligned closely with the 5, 10, and 30-period moving averages, further supporting a neutral technical outlook unless there’s a clear breakout above 143.08 or a breakdown below 141.60.

With the BOJ policy outlook evolving and global trade uncertainties rising, the yen is likely to remain volatile, acting both as a safe-haven currency and a gauge of monetary policy direction in the weeks ahead.

Click here to open account and start trading.

Dividend Adjustment Notice – Apr 18 ,2025

Dear Client,

Please note that the dividends of the following products will be adjusted accordingly. Index dividends will be executed separately through a balance statement directly to your trading account, and the comment will be in the following format “Div & Product Name & Net Volume”.

Please refer to the table below for more details:

Dividend Adjustment Notice

The above data is for reference only, please refer to the MT4/MT5 software for specific data.

If you’d like more information, please don’t hesitate to contact info@vtmarkets.com.

Tech stocks 2025: Buy or sell amid AI and tariff turmoil?

From NVIDIA’s artificial intelligence (AI) dominance to Tesla’s self-driving ambitions, tech stocks are both soaring and stumbling in 2025. Recent US tariff exemptions for electronics have sparked rallies in stocks like Apple and TSMC, yet China’s retaliatory trade measures have rattled NVIDIA and Tesla.

With AI propelling valuations—NVIDIA’s market cap has hit USD 4 trillion—and supply chain risks looming, tech stocks are a thrilling yet turbulent opportunity for retail traders. Should you buy, sell, or hold in this dynamic environment? Let’s explore what’s driving tech stocks, the risks and forecasts, and how to trade them strategically.

What’s happening with tech stocks in 2025?

Tech stocks in 2025 are a tale of innovation and instability, fuelled by AI breakthroughs and disrupted by trade wars. The sector’s diversity—from chipmakers to electric vehicle (EV) pioneers—offers opportunities across the board. Here’s the current landscape:

  • AI-powered surge: AI is reshaping tech valuations. NVIDIA, now worth USD 4 trillion, leads with its AI chips, posting 50% revenue growth in Q1 2025. Microsoft’s AI-driven cloud services grew 20%, cementing its dominance. Tesla’s autonomous driving technology has boosted its EV appeal, despite volatile stock swings.
  • Tariff rollercoaster: Trump’s tariff exemptions for electronics (April 2025) lifted Apple by 5% and TSMC, a key chip supplier, by 7%, per VT Markets’ analysis. However, China’s retaliatory tariffs on US goods hit NVIDIA (-3%) and Tesla (-4%), reflecting supply chain fears.
  • Supply chain strains: China’s restrictions on rare earth exports threaten chipmakers like AMD and Intel, raising production costs. TSMC, while benefiting from tariff exemptions, faces geopolitical risks as US-China tensions simmer.
  • Mixed performance: The NASDAQ 100 index is up 15% year-to-date, but individual stocks vary: NVIDIA (+45%), Microsoft (+25%), Apple (+20%), TSMC (+18%), Tesla (+10%), and AMD (-5%). Asian tech markets, led by TSMC, are outperforming US tech.
  • Investor sentiment: Retail traders are increasingly optimistic about NVIDIA and Microsoft, fuelled by their dominant AI growth strategies and strong market positioning. Conversely, apprehension surrounds tariff-exposed stocks like AMD and Tesla, with concerns mounting over potential supply chain constraints and escalating trade policy uncertainties.

Risks and forecasts for tech stocks

Tech stocks are a rocket fuelled by AI but shaken by tariff storms. Understanding the risks and forecasts can help you decide whether to buy, sell, or hold.

Risks:

  • Overvaluation: Sky-high price-to-earnings (P/E) ratios—NVIDIA at 50x and Tesla at 60x, compared to the S&P 500’s 21x—signal correction risks if AI or EV growth falters. Analysts warn of a potential 10–15% NASDAQ drop.
  • Tariff volatility: China’s escalating tariffs or US policy reversals could disrupt supply chains, impacting Apple, TSMC, and Tesla. Analytics noted a 1.9% premarket dip in US tech stocks on tariff fears.
  • Geopolitical tensions: China’s rare earth export curbs threaten chip production for AMD, Intel, and NVIDIA. TSMC, despite its tariff relief, faces risks from US-China trade talks.
  • Economic pressures: Rising US Treasury yields (4.5%) and delayed Federal Reserve rate cuts could curb tech spending, hitting Microsoft and Tesla.

The tech sector in 2025 is driven by powerful trends. NVIDIA and Tesla’s high valuations, with P/E ratios far above the S&P 500’s, raise concerns about potential corrections, urging traders to stay cautious.

Meanwhile, tariff exemptions lift companies like Apple and TSMC, and AI breakthroughs fuel growth for market leaders. These dynamics—AI potential, tariff shifts, and valuation risks—set the stage for a volatile yet exciting market. Here are the forecasts to guide your trading decisions.

  • Bullish outlook: AI and EV adoption could drive 20–30% gains for NVIDIA, Microsoft, Tesla, and TSMC by Q4 2025, fuelled by corporate AI budgets and Asian demand.
  • Bearish scenario: Tariff escalations and supply shortages might drag the NASDAQ 100 down 10% by mid-2025, with AMD and Intel most vulnerable.
  • Consensus view: Analysts, including Bloomberg, expect AI leaders (NVIDIA, Microsoft) and Asian tech (TSMC) to outperform, while chipmakers (AMD) and EV stocks (Tesla) face volatility.

These forecasts highlight the need for strategic trading to balance opportunity and risk.

Trading tech stocks during volatility

Trading tech stocks in 2025 is like navigating a stormy sea—exciting but demanding caution. Here are practical strategies to trade a diverse range of tech stocks and ETFs amid AI and tariff uncertainty, using VT Markets’ platform:

Choose your assets:

  • Individual stocks: Trade CFDs on AI leaders like NVIDIA and Microsoft for growth potential, tariff beneficiaries like Apple and TSMC for stability, or volatile EV innovators like Tesla for high-reward opportunities. AMD offers riskier bets tied to chip recovery.
  • ETFs: NASDAQ 100 CFDs provide diversified exposure, balancing risks across AI, chip, and EV stocks.

Pick proper strategies for volatility:

  • News-based trading: Capitalise on tariff news. For example, buy TSMC CFDs after exemption announcements, as its 7% rally showed, or sell Tesla CFDs when China escalates tariffs, using VT Markets’ real-time news alerts.
  • Safe-haven shift: During tariff-driven tech dips—like the 4% NASDAQ drop in March 2025—pivot to gold CFDs to protect capital.
  • Small position sizing: Limit trades to 1–2% of your capital to weather sudden drops, such as Tesla’s 4% fall on tariff news.

In times of uncertainty, the best approach is to stay informed, stay calm, and trade with a clear plan. Focus on quality tech assets, keep your position sizes small, and use strategies that respond to market news rather than emotions. Volatility can create opportunities—but only for those who manage risk and act with discipline.

Conclusion

Tech stocks in 2025 offer a thrilling ride, with AI leaders like NVIDIA, Microsoft, and Tesla soaring, tariff beneficiaries like Apple and TSMC gaining ground, and chipmakers like AMD facing headwinds. Yet risks—overvaluation, tariff volatility, and supply chain strains—demand caution.

By staying informed with VT Markets’ news feed, trading selectively with NASDAQ 100 ETFs, and limiting risks with small positions, you can seize opportunities in this turbulent market.

Ready to trade tech stocks in 2025? Open a live account with VT Markets to access low-spread CFDs and real-time insights. With the right tools, you can navigate tech’s turbulence and turn uncertainty into opportunity.

Dividend Adjustment Notice – Apr 17 ,2025

Dear Client,

Please note that the dividends of the following products will be adjusted accordingly. Index dividends will be executed separately through a balance statement directly to your trading account, and the comment will be in the following format “Div & Product Name & Net Volume”.

Please refer to the table below for more details:

Dividend Adjustment Notice

The above data is for reference only, please refer to the MT4/MT5 software for specific data.

If you’d like more information, please don’t hesitate to contact info@vtmarkets.com.

Forex market analysis: 17 April 2025

Nvidia’s recent share decline highlights how quickly market sentiment can shift when global trade tensions and policy changes come into play. With fresh US export restrictions targeting AI chip sales to China and rising concerns over tariff-related uncertainty, investors are reassessing the outlook for the semiconductor sector. As pressure mounts across major chipmakers and broader economic risks re-emerge, Nvidia finds itself at the centre of a cautious and increasingly fragile market environment.

Nvidia shares slump as chip export restrictions weigh on sentiment

Nvidia’s share price continued to slide on Thursday, finishing the session at USD 102.13, marking a 2.32% decline. The drop follows the company’s recent revision of its revenue forecast, prompted by fresh US restrictions on AI chip exports to China.

Nvidia now anticipates a revenue loss of up to USD 5.5 billion in its fiscal first quarter due to these regulatory changes.

The announcement reverberated throughout the global semiconductor sector, with peer ASML also sounding the alarm. The Dutch chipmaker warned that uncertainty surrounding potential Trump-era tariffs could impact the industry through 2025 and 2026, triggering a sharp 6% fall in its share price.

Broader sentiment across chipmakers remains fragile, and attention now turns to TSMC’s upcoming earnings, which will be closely watched as a key indicator of sector health amid escalating trade tensions.

Meanwhile, Federal Reserve Chair Jerome Powell added to investor caution, noting that protectionist policies could dampen economic growth while fuelling inflation, placing the central bank in a difficult position.

Despite Powell’s slightly dovish undertones, fears of stagflation are creeping in—a scenario typically unfavourable for growth stocks, especially high-beta names like Nvidia.

Nvidia technical analysis: Correction phase unfolds

On the 15-minute chart, Nvidia exhibits signs of a momentum shift, indicating a possible short-term correction following a strong rally. After a breakout from the USD 94.73 low, the stock surged to a recent high of USD 115.31, forming a potential swing top.

Bearish crossover on MACD adds weight to NVIDIA’s descending trend, as seen on the VT Markets app.

Since then, price action has weakened, falling below short-term moving averages and settling near USD 102.13.

The MACD indicator reinforces this bearish narrative, with the MACD line crossing below the signal line and the histogram staying negative—pointing to sustained downward momentum.

The divergence between the 5, 10, and 30-period moving averages further highlights growing selling pressure and diminishing bullish strength.

Currently, price is hovering just above a critical support level in the USD 100–USD 101 range. A break below this zone could trigger a decline toward the USD 98–USD 99 area, especially if market sentiment remains cautious.

On the upside, any bounce would need to clear the USD 105–USD 106 resistance to challenge the bearish outlook.

Outlook: Downside risks persist unless sentiment improves

With Nvidia trading below the 30-period moving average and technicals showing signs of fatigue, a retest of the USD 100–USD 98 support region appears likely.

Any recovery would require a positive catalyst, such as encouraging earnings from TSMC or a shift in US trade policy.

In the short term, resistance sits at USD 106–USD 107, while a meaningful rally above USD 110 seems unlikely without a broader turnaround in sentiment.

Click here to open account and start trading.

New Products Launch – Apr 17 ,2025

Dear Client,

To provide you with more diverse trading options, VT Markets will have a new product launch. Please refer to the details:

New Products Launch

Friendly reminders:

1. The above data is for reference only, please refer to the MT4/MT5 software for specific data.

If you’d like more information, please don’t hesitate to contact info@vtmarkets.com.

Back To Top
server

Hello there 👋

How can I help you?

Chat with our team instantly

Live Chat

Start a live conversation through...

  • Telegram
    hold On hold
  • Coming Soon...

Hello there 👋

How can I help you?

telegram

Scan the QR code with your smartphone to start a chat with us, or click here.

Don’t have the Telegram App or Desktop installed? Use Web Telegram instead.

QR code