


When you visit your local store and find the price of everyday goods rising, one of the likely culprits could be President Donald Trump’s tariffs. These taxes on imports, designed to protect domestic industries, have widespread implications beyond the U.S. economy down to currencies, nations’ stabilities, and your portfolio. Understanding the true impact of tariffs on the financial markets is essential for investors looking to navigate the resulting volatility.
What Are Tariffs and Why Do They Matter?
Tariffs are taxes imposed on imported goods, often passed on to consumers in the form of higher prices.
While they aim to protect the U.S. industries, reduce trade deficits, and promote domestic manufacturing, the potential secularisation can lead to inflation, reduced consumer purchasing power, and market volatility.
Trump’s tariff policies, starting with steel and aluminium in 2018 and expanding to broader tariffs in 2025, have significantly impacted global markets, raising the cost of imported goods and squeezing business profit margins.
Recently, Trump threatened to tax imports from eight European countries after they rejected his Greenland plans as a negotiating tool.
This move escalates trade tensions and could lead to retaliatory measures from the EU. Trump’s tariffs, also targeting countries like China, Mexico, and Canada, are intended to boost U.S. manufacturing and address trade imbalances. However, critics warn these measures could harm global trade and increase costs for U.S. consumers and businesses.
The Numbers Behind the Tariffs
According to the Tax Foundation, in 2025, the average effective tariff rate on all goods imports reached 11.2%. This is not only the highest rate of the decade but the highest level recorded in the U.S. since 1943.
Source: Tax foundation
Trump’s tariffs is projected to raise $2.2 trillion in revenue over the next decade, but at a cost to U.S. GDP to fall by 0.5%.
Source: Tax foundation
By 2026, the average tax increase per U.S. household is estimated at $1,500. In the first half of 2025, the effective tariff rate on all goods imports will rise to 11.2%, the highest since 1943. Furthermore, with retaliatory tariffs from other countries, the combined impact on global trade could reduce U.S. GDP by 0.7%.
Impact on Global Stock Markets
The ongoing tariffs announcement has caused significant market turbulence.
Asian stock markets saw declines, with the S&P 500 and EU futures falling, while gold and silver surged to all-time highs. The U.S. dollar weakened against safe-haven currencies like the yen and Swiss franc.
Trump’s looming decision to impose 10% tariffs are not just happening to Europe, but to Asia markets like South Korea hitting tariff hikes to 25% .
The EU’s response could involve measures such as tariffs on $108 billion worth of U.S. imports, with France considering retaliatory tariffs.
Analysts are concerned about the potential for a financial weaponisation of capital, as European countries hold significant investments in U.S. assets, including $8 trillion in U.S. bonds and equities.
This mutual financial interdependence, met with trade barriers, is a recipe for brewing market sentiments. As a result, global markets are on edge, with investors eyeing gold and finding pockets of momentum in equities and forex that experienced significant price jumps amid escalating uncertainty.
A Look at Inflation
In a speech at the World Economic Forum, President Trump claimed that the U.S. has “virtually no inflation,” highlighting lower prices for groceries, energy, airfares, and mortgage rates.
However, economists disagree, pointing out that inflation remains elevated at 2.7%, above the Federal Reserve’s 2% target.
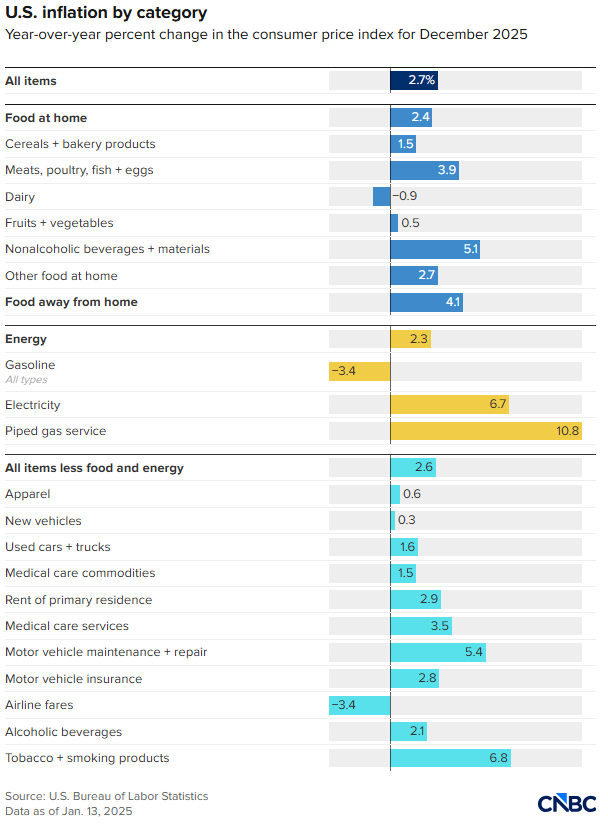
Source: U.S. Bureau of Labour Statistics
While some costs have decreased, others, such as car payments, have risen significantly. Additionally, tariffs imposed under Trump’s administration have contributed to inflationary pressures, raising the effective tariff rate to 17.5%, which adds between $1,300 to $1,700 in annual costs for the average consumer. The intent to curb inflation in the U.S. has certainly affected Americans every day, but the effects extend beyond national borders. Tax increases and shifting policies are altering consumer behaviours globally, particularly in emerging markets.
Supply Flow in Emerging Markets
We can take an example from China. Their aggressive push to export gasoline cars to regions like Latin America, Southeast Asia, and Eastern Europe highlights how domestic policy changes can shape global trade.
China’s auto industry has become a key player in the global market, redirecting production surplus from a growing domestic preference for electric vehicles (EVs) toward international markets where gasoline cars remain in demand. This shift in consumer behaviour has far-reaching consequences, particularly in Europe and China, as these regions navigate the implications of the influx of lower-priced Chinese gasoline vehicles.
The increased competition is forcing automakers from Japan, Korea, and Europe to reconsider their pricing strategies, which could lead to ripple effects across global supply chains, commodity markets, and currency flows.
U.S. farmers, who once dominated the soybean export market, are facing significant competition from Brazil, where China is investing billions in infrastructure. China’s investments in ports and logistics hubs across Latin America are reshaping the flow of daily agricultural products.
China’s strategy to source more agricultural goods from Latin America, especially as tariffs deepen the rift with the U.S., signals a long-term shift in global trade. This move is exacerbating challenges for U.S. farmers, particularly in the Midwest, where soybean production is a cornerstone of agriculture.
Tumulteous Currency Markets after Hike
The ongoing trade tensions are raising concerns about the USD stability, with increasing political risks further pressuring the currency. South Korea’s won (KRW) has been significantly impacted by Trump’s tariff hikes on Korean imports, with the exchange rate experiencing sharp fluctuations, reflecting growing concerns over escalating trade risks and global market uncertainty.
Meanwhile, the Swiss franc (CHF) saw notable fluctuations, with the USD/CHF pair rising as the U.S. dollar gained ground in response to Trump’s tariff threats, including a potential 100% levy on Canadian goods. This surge in risk aversion has driven investors toward the Swiss franc, which continues to serve as a safe-haven asset amid global inflation concerns.
The British pound (GBP) gained as the dollar weakened, driven by Trump’s trade rhetoric and market uncertainty. With the Federal Reserve preparing its policy decision, the pound benefited from broader dollar weakness.
The euro (EUR) saw further gains, driven by heightened U.S.-EU trade tensions. Trump’s tariff threats and the EU’s potential countermeasures added to the downward pressure on the dollar, allowing the euro to rise. The uncertainty surrounding U.S. policies, especially concerning trade with European countries, has prompted traders to seek stability in European assets, positioning the euro to remain resilient amid ongoing volatility.
As tariffs continue to dominate the headlines, currencies like the KRW, CHF, GBP, and EUR are showing significant movement, while the U.S. dollar struggles amidst growing geopolitical risks and domestic uncertainties.
Conclusion
Trump’s tariffs have had significant and complex effects on the U.S. and global financial markets. While inflation has remained relatively controlled in the short term, the long-term impact is expected to increase costs for consumers and businesses.
As we move into 2026, the true impact of the tariffs is likely to be felt more acutely, with higher prices and potential economic slowdowns. Investors need to navigate this period of uncertainty carefully, considering the rising costs of goods and the shifting dynamics in global trade relations.
Interested in monitoring how global trade tensions affect market movements? Stay updated on real-time price action and trading opportunities with VT Markets. Create your live account today and gain access to in-depth market insights and tools.


