Please note that the dividends of the following products will be adjusted accordingly. Index dividends will be executed separately through a balance statement directly to your trading account, and the comment will be in the following format “Div & Product Name & Net Volume”.
Please refer to the table below for more details:
The above data is for reference only, please refer to the MT4/MT5 software for specific data.
If you’d like more information, please don’t hesitate to contact info@vtmarkets.com.
Written on December 23, 2025 at 8:02 am, by anakin
Please note that the dividends of the following products will be adjusted accordingly. Index dividends will be executed separately through a balance statement directly to your trading account, and the comment will be in the following format “Div & Product Name & Net Volume”.
Please refer to the table below for more details:
The above data is for reference only, please refer to the MT4/MT5 software for specific data.
If you’d like more information, please don’t hesitate to contact info@vtmarkets.com.
Written on December 22, 2025 at 8:42 am, by anakin
Please note that the dividends of the following products will be adjusted accordingly. Index dividends will be executed separately through a balance statement directly to your trading account, and the comment will be in the following format “Div & Product Name & Net Volume”.
Please refer to the table below for more details:
The above data is for reference only, please refer to the MT4/MT5 software for specific data.
If you’d like more information, please don’t hesitate to contact info@vtmarkets.com.
Written on December 19, 2025 at 9:31 am, by anakin
As part of our commitment to provide the most reliable service to our clients, there will be maintenance this weekend.
Maintenance Details:
Please note that the following aspects might be affected during the maintenance:
1. The price quote and trading management will be temporarily disabled during the maintenance. You will not be able to open new positions, close open positions, or make any adjustments to the trades.
2. There might be a gap between the original price and the price after maintenance. The gaps between Pending Orders, Stop Loss, and Take Profit will be filled at the market price once the maintenance is completed. It is suggested that you manage the account properly.
3. During the maintenance period, VT Markets APP will not be available. It is recommended that you avoid using it during the maintenance.
The above data is for reference only. Please refer to the MT4/MT5 software for the specific maintenance completion and marketing opening time.
Thank you for your patience and understanding about this important initiative.
If you’d like more information, please don’t hesitate to contact info@vtmarkets.com
Written on December 19, 2025 at 8:48 am, by anakin
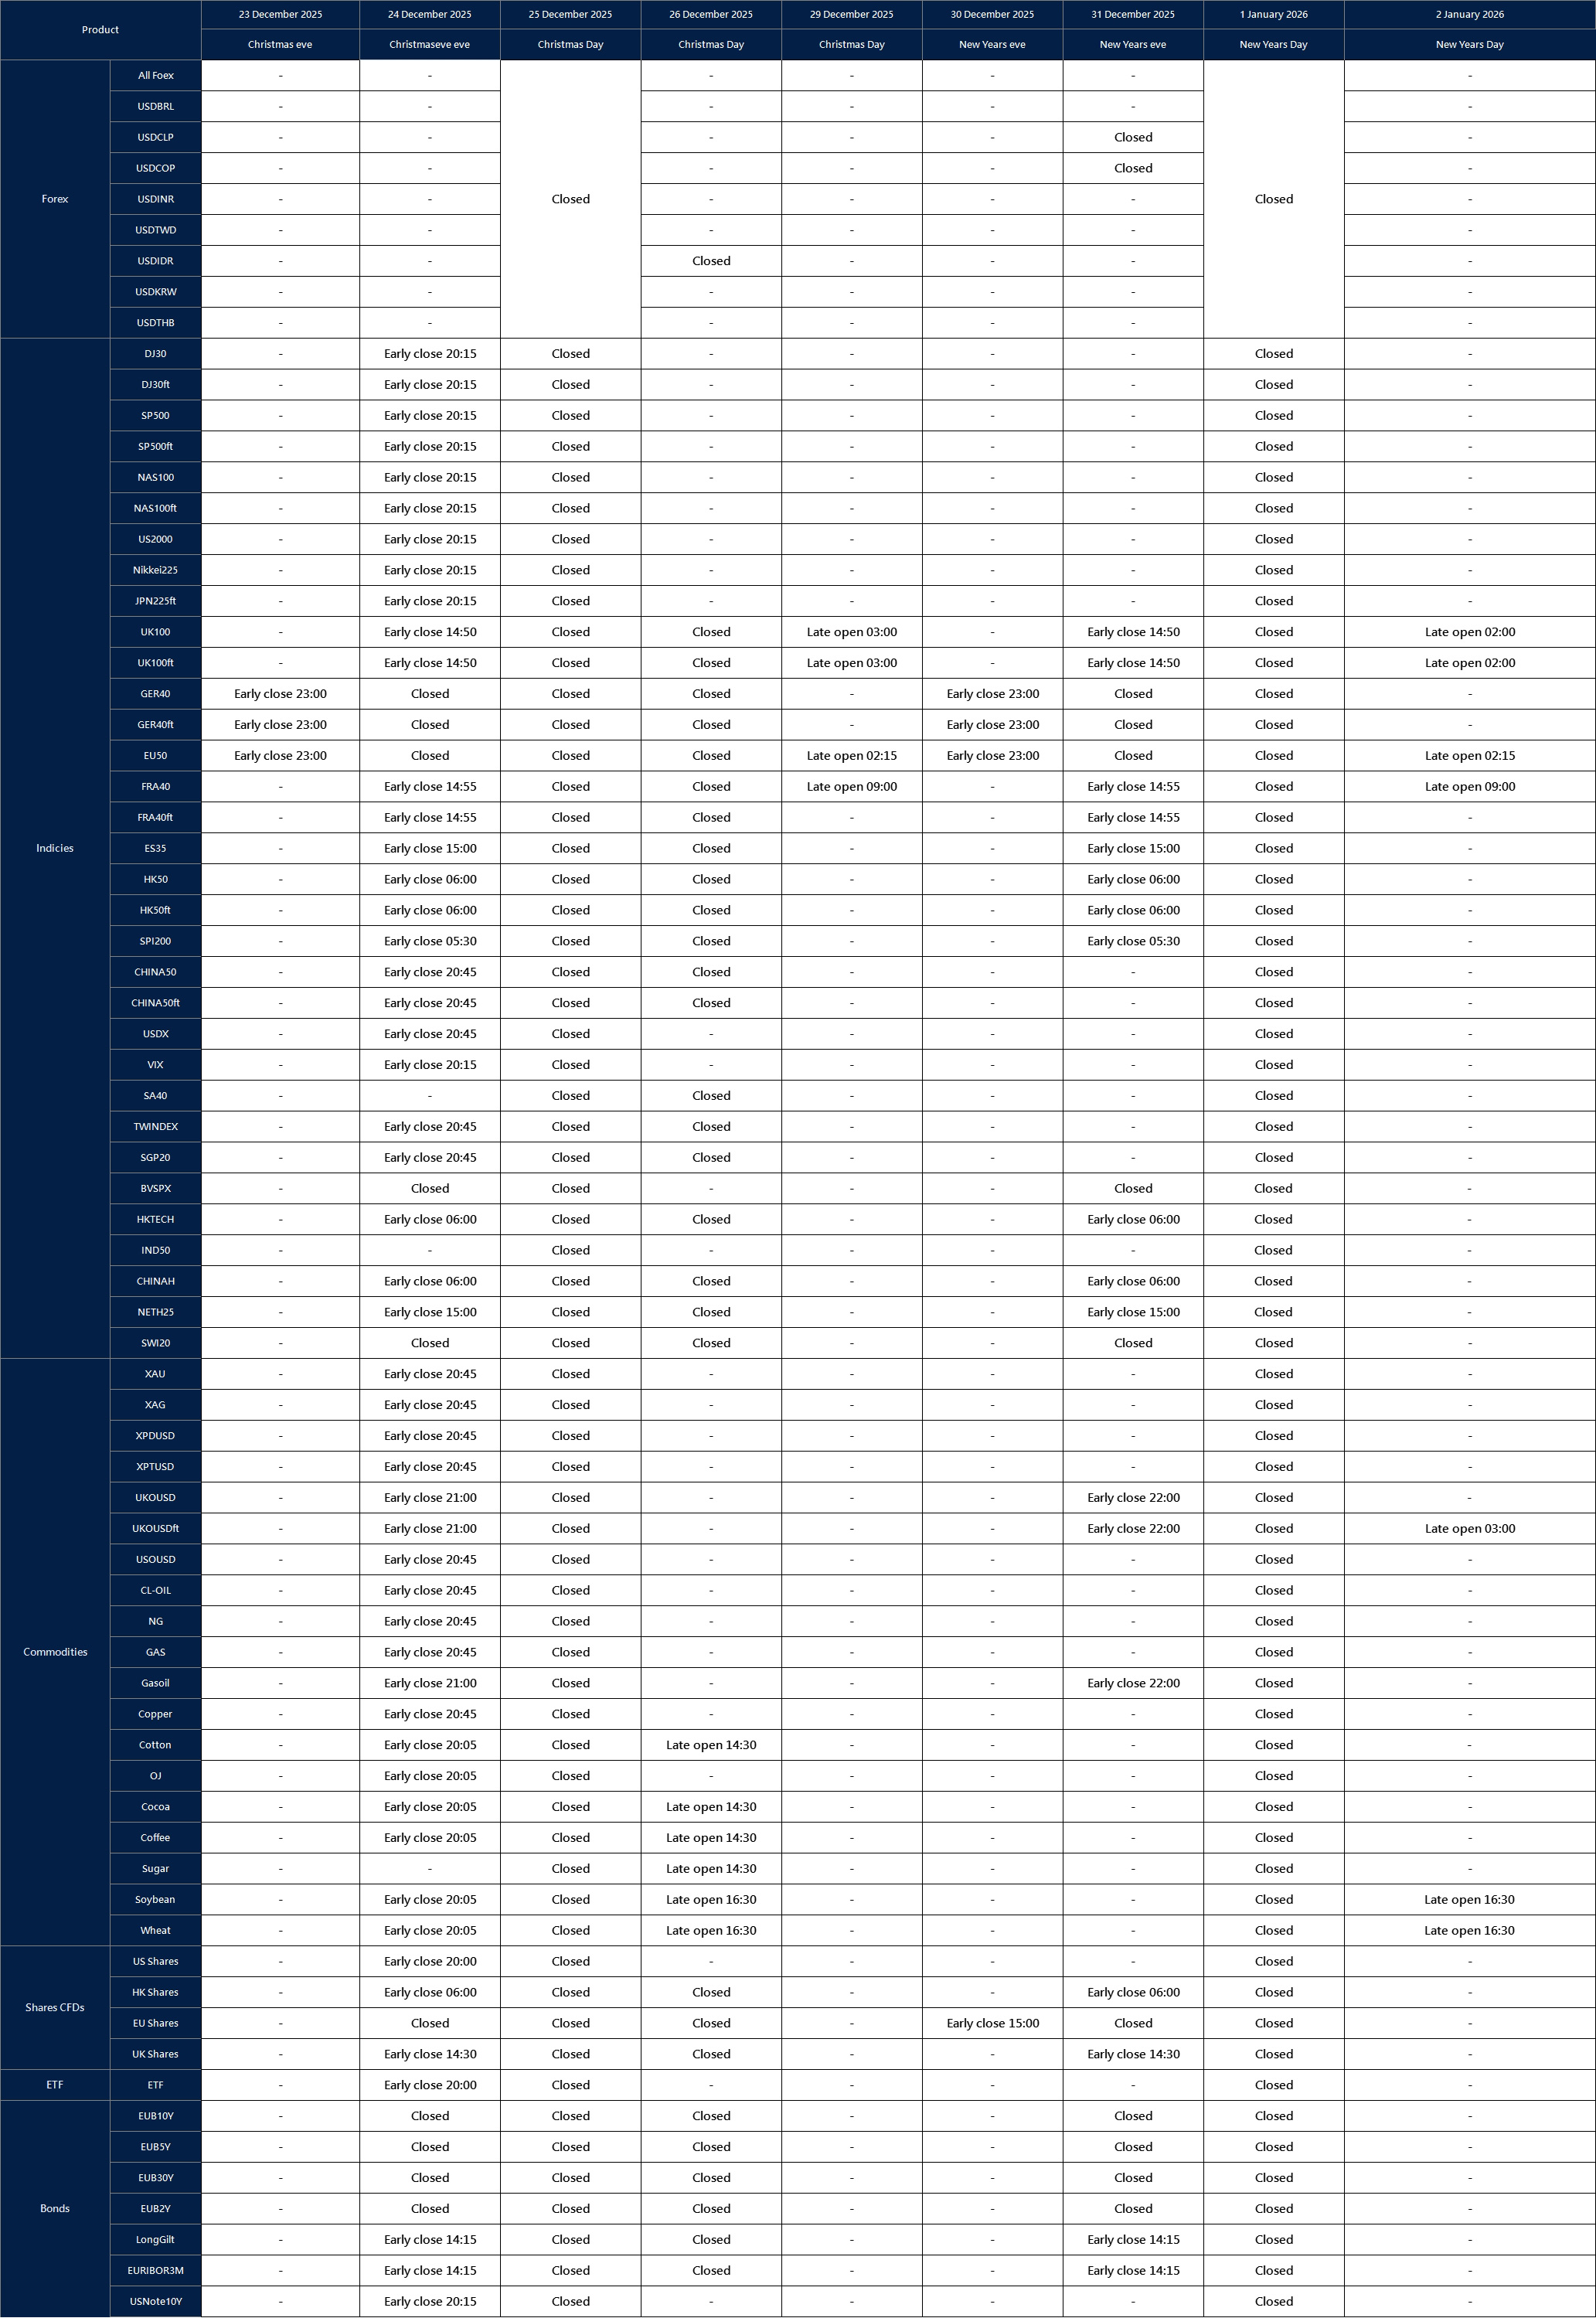
Affected by international holidays, the trading hours of some VT Markets products will be adjusted. Please check the following link for the affected products:
Please note that the dividends of the following products will be adjusted accordingly. Index dividends will be executed separately through a balance statement directly to your trading account, and the comment will be in the following format “Div & Product Name & Net Volume”.
Please refer to the table below for more details:
The above data is for reference only, please refer to the MT4/MT5 software for specific data.
If you’d like more information, please don’t hesitate to contact info@vtmarkets.com.
Written on December 18, 2025 at 8:00 am, by anakin
Please note that the dividends of the following products will be adjusted accordingly. Index dividends will be executed separately through a balance statement directly to your trading account, and the comment will be in the following format “Div & Product Name & Net Volume”.
Please refer to the table below for more details:
The above data is for reference only, please refer to the MT4/MT5 software for specific data.
If you’d like more information, please don’t hesitate to contact info@vtmarkets.com.
Written on December 17, 2025 at 8:18 am, by anakin
Please note that the dividends of the following products will be adjusted accordingly. Index dividends will be executed separately through a balance statement directly to your trading account, and the comment will be in the following format “Div & Product Name & Net Volume”.
Please refer to the table below for more details:
The above data is for reference only, please refer to the MT4/MT5 software for specific data.
If you’d like more information, please don’t hesitate to contact info@vtmarkets.com.
Written on December 16, 2025 at 10:09 am, by anakin
The above data is for reference only, please refer to the MT4 and MT5 software for specific data.
Friendly reminders:
1. All specifications for Shares CFD stay the same except leverage during the mentioned period.
2. The margin requirement of the trade may be affected by this adjustment. Please make sure the funds in your account are sufficient to hold the position before this adjustment.
If you’d like more information, please don’t hesitate to contact info@vtmarkets.com
Written on December 16, 2025 at 6:09 am, by anakin
The AI theme continues to dominate equity positioning, but the tone has changed. Markets have moved away from optimism around intelligence gains and toward a harder focus on economics.
The current phase of the AI cycle centres on infrastructure, power consumption and chip ownership rather than software headlines, with major US technology firms collectively spending more than $400 billion this year on AI-related chips, data centres, and energy capacity, despite AI-driven profits remaining far lower.
Such an imbalance keeps valuations sensitive to earnings guidance and capex discipline. Market participants are increasingly alert to the risk that AI adoption may prove slower or less profitable than equity prices imply.
This tension helps explain why US indices have struggled to sustain breakouts.
The SP500 recently printed a new all-time high before reversing lower, reflecting growing hesitation rather than outright risk aversion. Momentum remains constructive, but the margin for disappointment has narrowed.
For traders, AI continues to support the broader equity trend, while also acting as a volatility trigger when expectations slip.
Dollar Pressure Builds Ahead of Key US Data
The US dollar enters the week on the defensive, with the USD Index finding support near 97.90. The price action last week reflected growing conviction that the Fed may need to ease further as labour conditions soften.
As such, the Non-Farm Employment Change this week is forecasted at 50K, down from 119K previously, while the unemployment rate is expected to rise to 4.5% from 4.4%. A print close to forecasts would reinforce expectations of a slower US economy and could extend downside pressure on the dollar.
Dollar weakness continues to underpin select risk assets, though traders remain reluctant to chase moves ahead of data confirmation.
Central Banks Add Cross-Currents to FX Markets
Central bank decisions add another layer of complexity.
The Bank of England (BoE) is expected to cut its Official Bank Rate to 3.75% from 4.00%, placing focus on forward guidance rather than the cut itself. Sterling reactions are likely to depend on whether policymakers signal further easing in early 2026.
In Japan, the Bank of Japan (BoJ) is forecasted to raise its policy rate to 0.75% from 0.50%. Any indication that policy normalisation will continue could lend support to the yen and cap USDJPY rallies, particularly if US data disappoints.
Upcoming Economic Events
Date
Currency
Event
Forecast
Previous
Analyst Remarks
16 Dec
USD
Non-Farm Employment Change
50K
119K
Soft data may extend USD weakness.
16 Dec
USD
Unemployment Rate
4.50%
4.40%
Rising unemployment supports easing expectations.
18 Dec
GBP
Official Bank Rate
3.75%
4.00%
Focus on BoE guidance beyond the cut.
18 Dec
USD
CPI y/y
3.00%
3.00%
Stable inflation keeps policy outlook unchanged.
19 Dec
JPY
BOJ Policy Rate
0.75%
0.50%
Hawkish signals may strengthen JPY.
For full view of upcoming economic events, check out the VT Markets Economic Calendar.
Key Symbols to Watch
SP500
The index made a fresh all-time high before pulling back sharply.
AI-heavy stocks continue to drive direction, but valuations face tighter scrutiny.
A sustained hold above 6,790 keeps upside open; failure may accelerate profit-taking.
Gold (XAUUSD)
Gold retreated from 4,360 and now consolidates near 4,220.
Holding above this zone may open a move back toward 4,300.
US data remains the primary short-term catalyst.
US Dollar Index (USDX)
USDX found support near 97.90 after last week’s decline.
Resistance sits near 98.30 and 98.55.
Weak labour data could expose the 97.40 area.
Bitcoin (BTCUSD)
Bitcoin continues to consolidate within a descending channel.
A close below 87,712 could expose lower levels near the 70K handle.
Recovery attempts depend on stabilising risk sentiment.
Bottom Line
The AI theme continues to support US equities, but traders are becoming more selective as infrastructure costs rise and earnings expectations face closer scrutiny.
US labour data, inflation readings, and key central bank decisions will help determine whether easing expectations remain justified.
A softer data run could keep pressure on the dollar and support gold and risk assets, while any upside surprise may prompt sharper pullbacks as positioning adjusts.


