Since returning to the White House in 2025, Donald Trump has acted quickly to roll out an aggressive policy agenda. Executive orders, tariff threats, and major administrative changes were announced in rapid succession, often moving markets and drawing global attention. However, many of these decisions did not remain in place for long. Several were later delayed, adjusted, or reversed after running into political resistance, legal hurdles, or concerns from investors and institutions.
A Pattern in Trump’s Policy Decisions
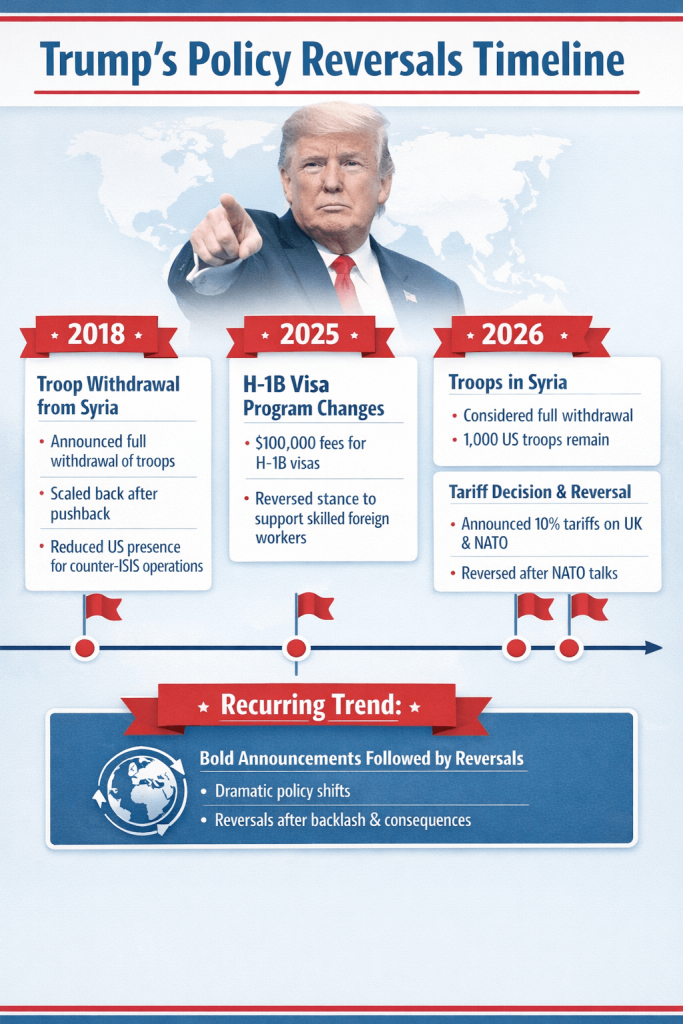
Trump’s approach to policy often involves bold announcements followed by significant reversals once practical or geopolitical consequences become clear. His flippant words have been seen in various sectors:
- Military Presence: Trump frequently announced troop withdrawals, like from Syria, only to scale back after realising the complexities, such as security concerns and ISIS prisoners.
- Immigration: His initial hardline stance on foreign labor, like imposing high fees on H-1B visas, shifted after aligning with business leaders who stressed the need for skilled foreign workers in tech and defense.
- Tariffs: Trump’s 2026 decision to impose tariffs on UK and NATO allies sparked backlash. After talks with NATO officials, he reversed the decision, framing a new long-term deal.
These episodes demonstrate a recurring trend in Trump’s decision-making: bold and often controversial policy announcements that dilutes geopolitical strategy and generate haphazard fluctuations in global markets.
How Policy Shocks Move Global Markets
Trump’s tariff threats have consistently created volatility in global markets, with investors often uncertain about whether the threats will materialise or be reversed.
This pattern has given rise to the ‘Trump Always Chickens Out’ (TACO) effect.” – a cycle of bold threats followed by softening positions, leading to a market reaction where investors are initially rattled, but tension typically eases when Trump backs down.
In the latest round of tariff threats, markets reacted swiftly. European stocks dipped, with major indexes such as Germany’s DAX, London’s FTSE, and France’s CAC 40 seeing declines. The VIX volatility index surged 27%, indicating growing concern. Yet, investors have become increasingly sceptical, having been burned before by Trump’s on-again, off-again approach.
Just like that, markets are once again pricing in the possibility of a policy reversal, with traders betting that many of Trump’s threatened tariffs on European countries may not be implemented. According to Polymarket, only a small percentage of investors believe the full set of tariffs will take effect. This reflects a broader investor sentiment shaped by the consistent pattern of Trump backing down under market pressure.
Despite the uncertainty, the impact of Trump’s trade policy on the U.S. dollar and inflation continues to be significant. Analysts at UBS have noted that additional tariffs would increase inflationary pressures in the U.S. and further erode the dollar’s status as a global reserve currency. However, bond investors do not appear overly concerned, with most dismissing the long-term effects of the threats.
While the “TACO” effect has become a familiar response for investors, it’s clear that the unpredictable nature of Trump’s trade policies keeps global markets on edge, creating a paradox: the more the market discounts these tariff threats, the more likely they are to be enacted as the administration gains confidence. This ongoing uncertainty underscores how policy shocks can significantly impact investor sentiment and global market stability.
Strategies in the Current Political Climate
As the markets react to sudden policy shifts, how can traders capitalise on volatility without the luxury of foresight? Here’s how to turn market chaos into a potential opportunity:
1. Stay Informed
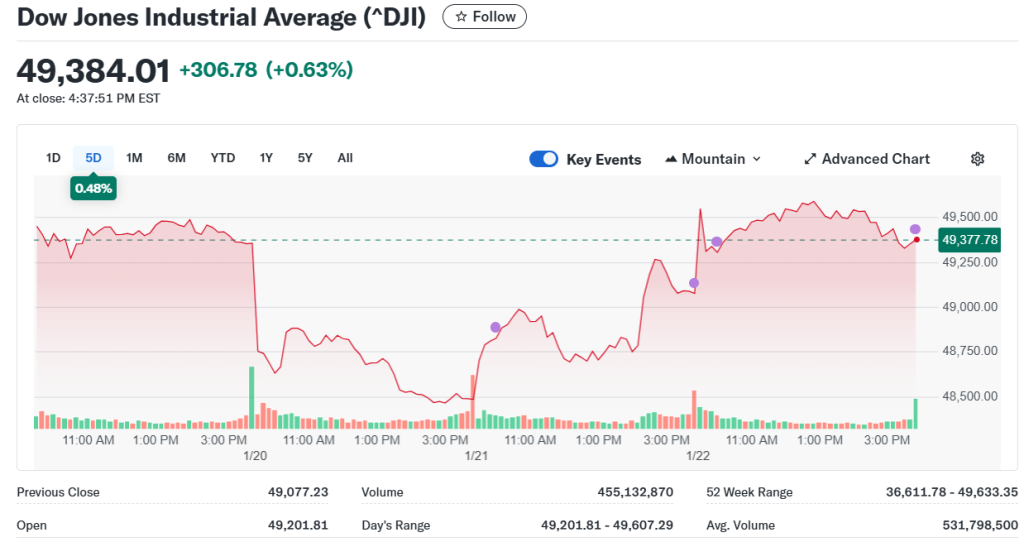
News moves markets, and there’s no clearer example than President Trump’s sudden reversal on Greenland and tariffs. The Dow Jones spiked around 1.2%, or over 550 points, following Trump’s announcement that the US and NATO had reached a deal framework, which led him to backtrack on tariffs previously scheduled to hit European nations.
Source: Yahoo finance
This news came just days after Trump’s threats had caused widespread panic, pushing investors to exit positions. By staying informed through apps like Reuters, Bloomberg, and CNBC, traders can react quickly to unexpected shifts in sentiment, giving them an edge before the broader market adjusts.
A quick check of headlines, Economic Calendar and VT Markets’ daily analysis could’ve kept you in the game during this chaotic period. Set up alerts for keywords like “Trump” or “tariff” to stay ahead of the curve.
2. Use Stop-Loss Orders
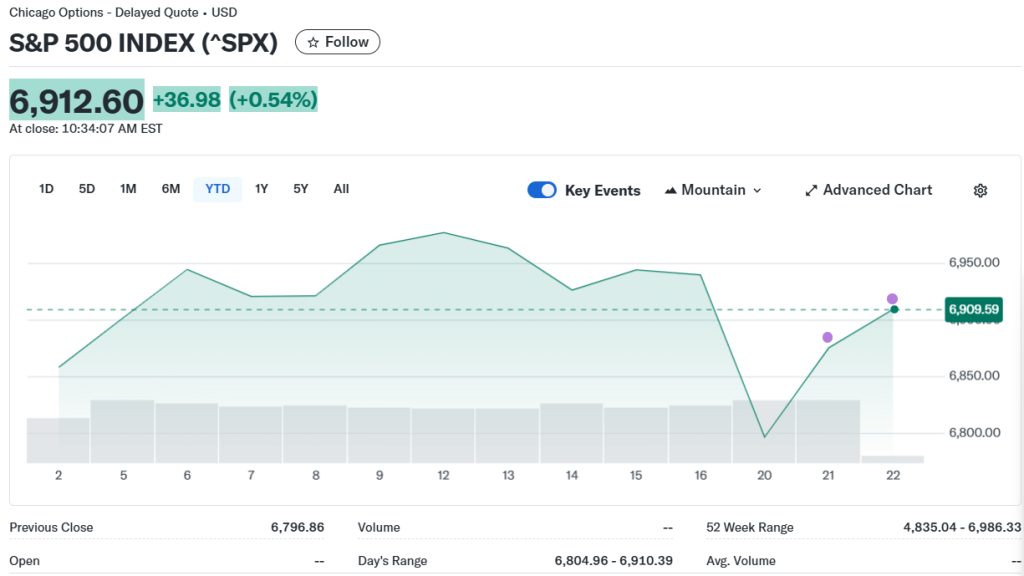
Market volatility, such as the one seen after Trump’s tariff threats, can make it tough to navigate trades. But using stop-loss orders offers a safety net.
Source: Yahoo finance
After the initial sell-off in January 2026, the market saw a strong reversal. A stop-loss protects traders during the downturn, but provides calculated rallying opportunities when the news breaks.
3. Diversify with Safe Havens
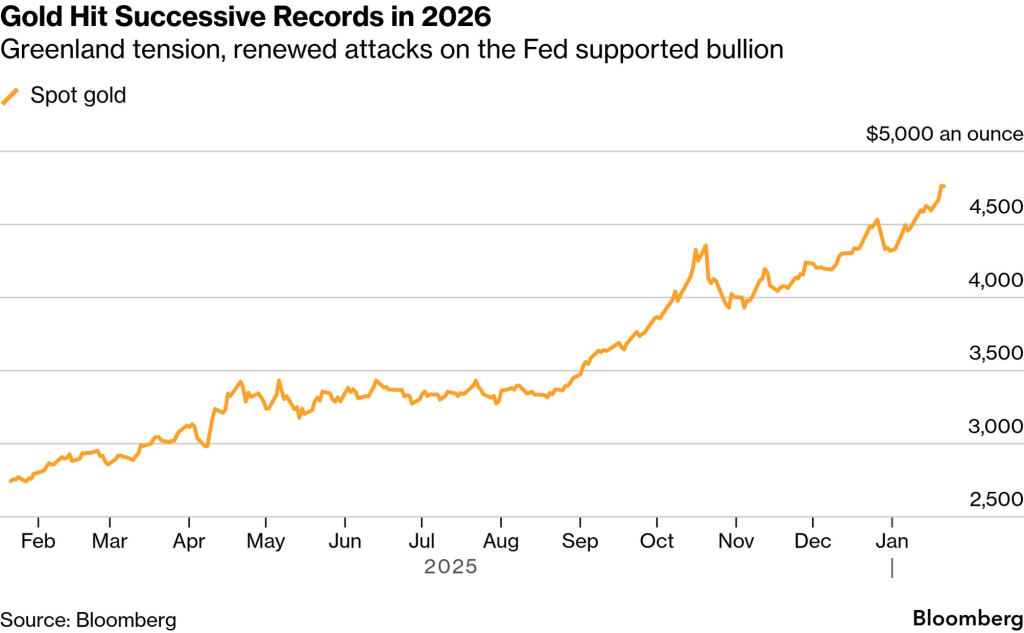
When news like Trump’s tariff threats hits the market, many traders flock to safe-haven assets like gold or bonds. In the wake of the announcement about Greenland, gold prices remained steady, providing a buffer against equity volatility.
A small stake in gold or Treasuries before the market rally could provide a more stable environment to park assets during uncertainty, and offer gains once the market recovers.
Source: Bloomberg
Gold prices, for example, remain quite steady before the positive news hit, allowing traders to stay grounded before pivoting back into riskier assets after Trump’s tariff reversal.
4. Monitor Currency & Commodity Correlations
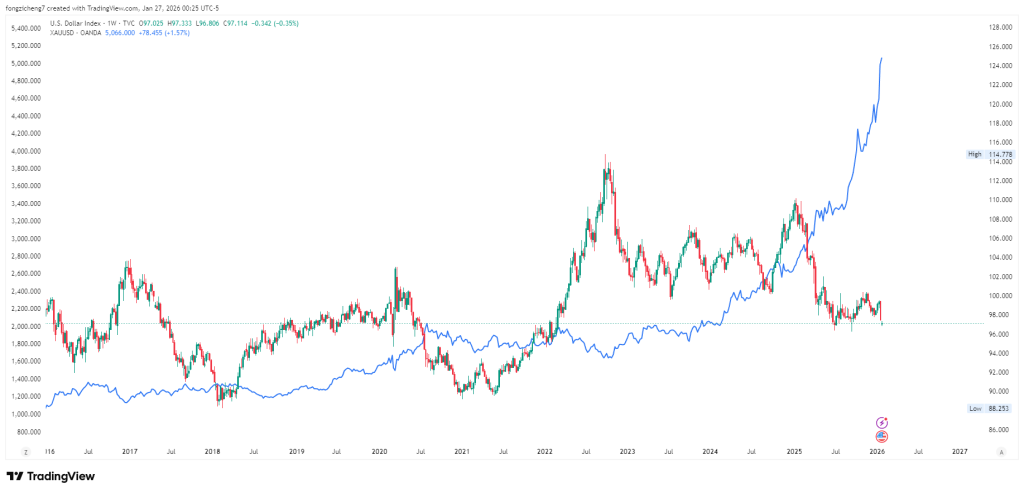
When political news hits, some markets move in tandem. For example, a sudden US tariff reversal often strengthens the USD against riskier currencies like AUD or emerging market FX, while commodities like oil or gold may react differently. Understanding these correlations can help traders hedge or position effectively.
Source: Tradingview, Description: In candlesticks: Dollar. In blue: Gold
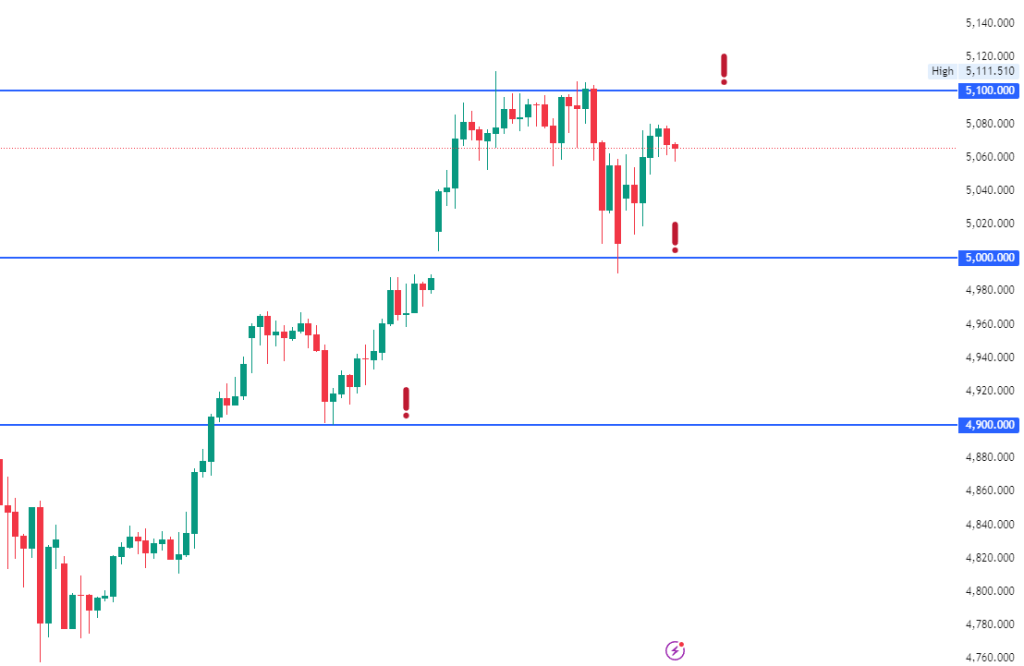
5. Use Technical Levels for Confirmation
Even in news-driven markets, prices often respect key technical levels (support, resistance, Fibonacci, trendlines). Traders can combine news analysis with these levels to time entries and exit more confidently, going beyond headlines and market noise.
Source: Tradingview
Conclusion
Markets have a flair for the dramatic, and Trump’s tariff U-turns prove just how quickly sentiment can shift —flipping the Dow, Nasdaq, and S&P 500 from sharp losses to strong gains. In this political climate, traders can stay in the game when things get unpredictable.
Ready to test your strategies? Start practising on VT Markets’ demo account with small, no-risk trades. And when you’re ready, open a live account with VT Markets, starting small and seizing the next twist in the market.
You’ve got this—grab your phone, set those alerts, and get prepared for the next market move!